NPS
Taking the Pulse of the National Parks
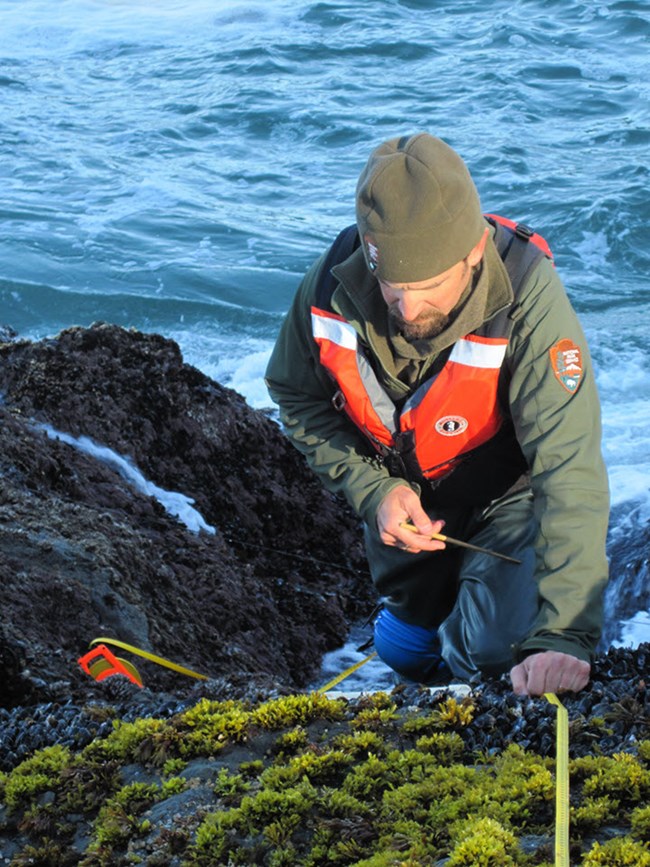
Monitoring is the repeated observation and measurement of specific park natural resources in order to better understand their condition. Monitoring allows us to detect change, identify any potential problems in the early stages, and measure success. Data and analyses resulting from monitoring are powerful tools that allow park managers to make sound decisions about the parks entrusted in their care.
The Inventory & Monitoring (I&M) Program uses the term “vital signs” for particular species, habitats, landscapes, and abiotic factors (e.g., water, air, soil) that help indicate the health of an ecosystem. Just as people monitor their vital signs such as blood pressure and pulse, we monitor selected vital signs to help parks understand the condition and trends of their natural resources.
The 32 I&M networks have established vital signs monitoring in over 280 parks. Vital signs data allow us to better understand natural processes and the results of management actions, and help guide parks in the successful protection and use of park resources.
Goals for Vital Signs Monitoring
- Determine the status and trends, in selected indicators, of the condition of park ecosystems to allow managers to make better-informed decisions and to work more effectively with other agencies and individuals for the benefit of park resources.
- Provide early warning of abnormal conditions of selected resources to help develop effective mitigation measures and reduce costs of management.
- Provide data to better understand the dynamic nature and condition of park ecosystems and to provide reference points for comparisons with other, altered environments.
- Provide data to meet certain legal and Congressional mandates related to natural resource protection and visitor enjoyment.
- Provide a means of measuring progress towards performance goals.
More than 1,000 scientists, resource specialists, park managers, and data managers have actively contributed to the design and implementation of this long-term program. This collaborative effort has resulted in strong links between scientific information and management needs, and is helping to "put science into the hands of park managers and planners" in the National Park Service.

Ecological Monitoring Framework
The NPS Ecological Monitoring Framework is a systems-based, hierarchical organizational structure for vital signs, which helps parks, networks, programs, and other agencies coordinate their work. The framework has three levels, from the general to the more specific.
Vital signs selected by networks for monitoring are assigned to a Level 3 category that most closely pertains to that vital sign. For example, the vital sign “Shoreline Change” is assigned to the Level 3 category of “Coastal/oceanographic features and processes. ” This is within the Level 2 category of "Geomorphology" and the higher Level 1 category of “Geology and Soils.” The common framework provides a level of consistency among the many different vital signs, and a broader perspective of monitoring efforts.
Examples of Vital Signs
Summary of the most common vital sign categories (and examples of specific measures) that are being monitored by the U.S. National Park Service long-term ecological monitoring program (from Fancy and Bennetts 2012).
| Vital Sign Category | Example Measures (varies by network) | Number of Parks |
|---|
Monitoring Highlights
Monitoring - Multimedia Highlights
Videos
- Duration:
- 3 minutes, 27 seconds
Why do scientists track the soil elevation in mangrove habitat to learn more about climate change impacts? The network's 2018 Future Park Leader of Emerging Change (FPL) intern, Malcolm Wells shares his experience.
-
Pika Monitoring at Craters of the Moon National Monument and Preserve, Idaho
Monitoring the American Pika at Craters of the Moon National Monument and Preserve. Long-term monitoring is important to understand the pika's sensitivity to climate change, and to detect changes in pika populations over time.
- Duration:
- 4 minutes, 44 seconds
Story Maps
Source: NPS DataStore Collection 3750. To search for additional information, visit the NPS DataStore.
Last updated: March 14, 2024

