
The restoration process at the Giacomini Wetlands has had a profound effect on the vegetation communities that occur within the Giacomini Wetland Restoration Project Area (Project Area). Before the restoration, the site was a working dairy ranch, and the project area was actively managed as pasture. Not only were tidewaters prevented from entering the site, but several active steps we taken to manage the plant community for dairy production. Palatable forage grasses such as ryegrass were seeded at the site, and pastures were irrigated to keep grasses growing longer and favor certain grasses. In addition to direct management, cattle-grazing has profound effects on plant communities: grazing and trampling by cattle determine which grass and forb species thrive or are selected against in the pasture environment. The restoration occurred in two phases. There was a period of a little more than a year - from early 2007 through summer 2008--in which the cattle had been removed from the restoration site, but the levee removal activities had not commenced. We refer to this time period as "passive restoration" because the removal of grazing caused noticeable changes to the plant and animal communities at the site, but they did not come as a result of direct restoration activities. "Full restoration" occurred in summer through fall 2008 and included the removal of the levees bordering Lagunitas Creek, the reconnection of Tomasini Creek (a smaller creek which used to flow through the Project Area, but was routed to a channel on the Project Area perimeter) into a reconstructed channel following one of its historical alignments, and the removal of ranch roads, fences, and other infrastructure. This caused much of the restoration project area to become subject to regular flooding by the tides, and the entire project area to be subject to upstream flooding from the Lagunitas, Tomasini, and Fish Hatchery Creeks during larger storm events. For more information about the restoration activities, please see the Summary of Construction under Phase I and II for a full description of the work. We do four types of vegetation monitoring on the Project Area. Each type of vegetation monitoring is designed with slightly different goals in mind--or to answer a different question about the site--but they also have areas of overlap. Vegetation Mapping is intended to give us detailed information about the vegetation communities at the site, and their spatial representation. It tells us overall acreage of different communities throughout the site, allows us to see how they are configured spatially, and visually represents how the spatial extent of different types of community changes over time. Vegetation Monitoring Transects quantitatively monitor the percent cover of different plant species along permanent 50-meter transects scattered throughout the Project Area and in three reference marshes (relatively pristine natural marshes used for comparison). Soil and plant biomass data are also collected at each transect. This data has been collected annually since 2006 and allows us to evaluate the changes in plant community between years and before and after the restoration, and connect this to changes in the soil and biomass of each site. We can use this data to assess important ecological functions such as plant community diversity, biomass production (a food source for the ecosystem), and the abundance of weedy non-native plant species. [The "Vegetation Monitoring Transects" section of this page is in development. Please check back later.] Vegetation Assembly Monitoring investigates the formation of new plant communities in the intertidal zone of the restoration site where vegetation largely died off after the restoration. It is set up to monitor vegetation communities forming in zones along the channels and in the marsh plain. Rare Plant Mapping tracks the extent and abundance of rare plant colonies within the Project Area from year to year. Vegetation MappingMethodsVegetation is mapped in patches or "polygons" according to species composition. Within each polygon, the dominant plant species are noted. Each polygon mapped represents an area of relatively uniform composition among dominant species. Dominant species are defined as any species comprising greater than 20% absolute cover. The minimum mapping unit was primarily 0.01 acres or 40m2, meaning that vegetation patches that smaller then this were lumped into the surrounding polygons and not distinguished separately. Based on the data gathered on the dominant plant species, the vegetation of each polygon was classified into a Vegetation Community (Table 1). Vegetation Community classifications represent a modified version of the Holland (1986) classification system and include designations such as Freshwater Marsh, Coastal Scrub, and Open Water. In some cases, Vegetation Community classifications are split by specific factors considered to be significant within the community. This may be the height of the dominant vegetation, as with, for example, Brackish Marsh Short/Medium (<1m tall) and Brackish Marsh Tall (>1m), or Scrub-Shrub (<5m) and Forested (>5m) Riparian. Salt marsh communities are split into low, mid, and high to reflect elevation relative to the tides, with low salt marsh occurring between mean sea level and mean high tide, mid salt marsh occurring between mean high tide and mean higher high tide, and high salt marsh occurring between mean higher high tide and the extreme high tides. Moist Grasslands were split based on native component, as native species formed a higher percentage than in other grassland communities. ResultsVegetation communities have changed drastically on the Project Area since restoration (Figure M1 - 1,103 KB PDF). The biggest change is the loss of Wet Pasture, which had decreased by more than 200 acres in 2010 compared to pre-restoration in 2003. The largest increase was in Mudflat/Panne habitat, which has been the dominant community in the Project Area since restoration. This prevalence of mudflat habitat and loss of Wet Pasture can be traced to two factors. When tidewaters returned to the site, the influx of salty water immediately killed most of the pasture vegetation that dominated the site, supported by diking, ditching, and irrigation. This created large swathes of mostly unvegetated habitat. Most of the tidal area remained mudflat in 2010 because the parts of the project area had subsided relative to the surrounding area when the site was converted from the historic tidal marsh into pasture. Diking and draining cause subsidence by exposing soils rich in organic material to decomposition, which is occurs more slowly when soils are saturated. Most of the mudflat habitat is too low in elevation relative to the tides to support vegetation. However, this habitat has had some colonization: in 2010, this habitat had decreased by almost 20 acres compared to 2009, reflecting that this habitat is slowly being colonized by salt marsh plants. Even as Brackish Marsh and Salt Marsh communities moved into some of the bare mudflats, much of the area classified as Brackish Marsh in 2009 was colonized by salt-tolerant grass species and had developed into Salt Marsh Grassland by 2010.
CitationsHolland, R.F. 1986. Preliminary Descriptions of the Terrestrial Natural Communities of California. State of California, Department of Fish and Game. Sacramento, CA. Vegetation Assembly MonitoringIntroductionThe restoration project created an interesting opportunity to examine the way in which plant communities form or "assemble." Ecologists examining why particular groups of organisms are found together in similar abundances theorize about whether these communities represent a "set endpoint" that the community will reconstruct no matter what species get to the site first, or the whether the community that eventually forms instead depends on other factors such as the order in which species colonize or other chance events (Keddy 1999). In much of the project area, particularly the East Pasture, removal of the levees and the subsequent return of tidal flow resulted in complete die-off of the grassland vegetation. By contrast, a creek runs through the West Pasture, that experienced frequent, but inconsistent, tidal flow (muted tidal) even prior to restoration, and already supported an area of brackish/salt-tolerant vegetation along its banks. In addition, restoration activities also had some potentially important effects on plant community formation. In particular, parts of the area were scraped of vegetation and soil during restoration activities such as levee and road removal. All these factors created different baseline states. On the East Pasture, a classic "clean slate" was created with the die-off of all the existing vegetation. Scraped areas also represent a clean slate, but lack in both dead vegetation and the top layer of soil. These provide a good opportunity to examine the way completely new communities form. On the West Pasture, salt tolerant vegetation existed prior to restoration, theoretically able to withstand the new conditions, but a key environmental variable--tidal flow--was changed. In this area, the question is not how entirely new plant communities will establish, but how existing plant communities will change. Will the communities that form in each of these areas resemble each other and other natural marshes in the area (reference sites), in other words move towards a set endpoint? That restoration will result in a marsh resembling the reference site is by no means a foregone conclusion. Numerous studies and reviews of restoration projects have found that restoration sites do not necessarily converge with reference sites (Zedler & Lindig-Cisneros 2000, Palmer et al. 1997, Wolters et al. 2008). The landscape surrounding the project area has undergone considerable change since the reference marsh formed. In particular:
Thus, instead of reaching a set endpoint, new conditions may result in novel communities. To explore these questions, we set out to discover:
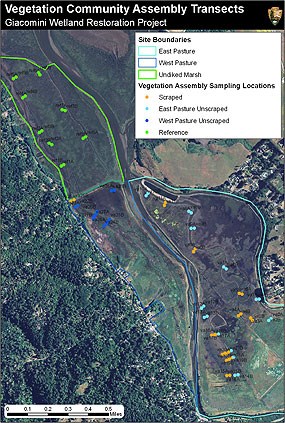
To this end, we sample the plant community scattered throughout the project area, measure various environmental factors with the potential to contribute to the formation of plant communities at the site, and compare the Project Area to a natural marsh, or reference site (Figure A1 - 1623 KB PDF). MethodsChannels are known to be important drivers of slight habitat differences within salt marshes, so vegetation assembly was examined in transects radiating out from channels to represent this variation in habitat. Transects were located at random locations along channels in both the former East Pasture, which experienced large scale vegetation die-off, and the West Pasture, which possessed brackish vegetation prior to restoration (Figure A1). The sites were further divided by whether the site had been scraped down to bare soil or left unscraped. In 2010, an additional 6 transects were surveyed within a reference marsh adjacent to the project area. 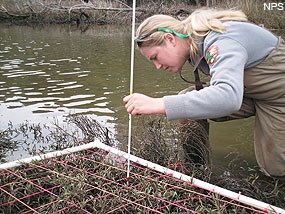
Transects are oriented perpendicular to the channels, and vegetation cover is estimated at 0 to 1 m, 6 to 7 m, and 22 to 23 m from the channel. Percent cover was estimated in a 2 m x 1 m quadrat by point intercept method in 100 points located at at evenly spaced intervals (Figure A2). The cover of plant species, detritus (dead vegetation; organic debris), and bare ground was recorded. Unless noted, data presented here represents an average of the three quadrats in each transect. Data was collected in Summer/Fall 2009, 2010, and 2011. Data for the reference sites was collected only in 2010. Plant species diversity was analyzed using Shannon's Diversity Index (H' = -∑Pi*Ln(Pi), and by Species Richness (the number of species present). Differences between the three years within the restoration area were analyzed using a paired samples t-test. 2010 and 2011 comparisons between restoration and reference sites were analyzed using a two sample t-test assuming unequal variance. Data was considered significant if p<0.1. Non-metric multidimensional scaling (NMS) was used to examine the relationship between the species composition of the sites within the restoration project area in 2011 and the reference site. NMS is a way of looking at sites and grouping them by the similarity of their plant community and then evaluating whether there are any known environmental factors associated with the how the sites and plant species are grouped. Sites that are close together are more similar to each other, and are associated with the plant species that are nearest to them. Environmental factors, shown as vectors or lines, point towards the sites that with which that factor is associated. The longer the line shown on the graph, the stronger the effect of that environmental factor. We looked at 6 environmental factors including Elevation, Soil Salinity, August Water Salinity, Distance to Bay, Channel Width and Distance to Channel. NMS groups sites by grouping associated variables into axes and plotting the sites along these axes. Depending on how complex the relationships are between sites, NMS may create a model in up to six dimensions (meaning six axes, each associated with a combination of variables). NMS was configured as follows: Main matrix = plant community, Secondary matrix = environmental variables, Distance measure = Sorensen, Real data runs = 250, Random data runs = 250, Step length = 0.20. There were 110 sites (sites a, b, c for 28 transects in the restoration project area, plus a site d for two transects, and sites a, b, and c for 8 reference transects). 
ResultsDiversityPlant species diversity has increased significantly each year since restoration (Figure A3 and Figure A4 - 154 KB PDF), as measured by both Shannon's Diversity Index (2011 vs. 2010: p=0.0002; 2010 vs. 2009: p=0.011), and average Species Richness (2011 vs. 2010: p=0.0003; 2010 vs. 2009: p=0.005). Despite these gains, the overall diversity of the restoration site was remained lower than the reference marsh in 2010 and 2011 as measured by both Shannon's Diversity Index (p<0.0001) and average Species Richness (p=0.004; not shown). This means that while every species found in the reference site is found within the Project Area, the average number of species per plot is lower, and they tend to have lower cover. Plant Community StructureWe used NMS to compare sites to each other and the reference site based on plant community. NMS compared the 2011 species data from each site and related it to a suite of environmental factors such as distance to bay, salinity, elevation, and distance from channel in order to build a model of the relationship of the sites to each other and to the each plant species. In this case, a three dimensional model was created to show the relationship of the sites to each other. This model is represented in three graphs (Figure A5) that show the relationships of the three axes to each other. Axis 1 is the strongest axis (meaning it explains the largest part of the variation between sites), followed by Axis 2, and then Axis 3. 
Figure A5 shows the way plant communities were structured along the channels in 2011, three years after restoration. In general, the Reference sites were clustered fairly closely together, especially along Axis 2. They were most associated with the unscraped sites in the West Pasture, and with some of the unscraped sites in the East Pasture. These sites were associated with the presence of most of the plant species, especially saltgrass (Distichlis spicata; DISP), gumplant (Grindelia stricta; GRST), sea lavender (Limonium californicum; LICA), jaumea (Jaumea carnosa; JACA), plantago (Plantago maritima; PLMA), and arrowgrass (Triglochin spp.; TRMA and TRCO). These sites were also associated with higher elevation. Elevation was the environmental factor most strongly associated with the way sites were clustered, and was most closely aligned with Axis 2. This result is not surprising: numerous other researchers have found that tidal marsh community composition is driven largely by elevation relative to tides (e.g. Wolters et al 2008). Distance to Bay was also associated with Axis 2, but in the opposite direction, meaning sites further from the bay were associated with lower elevation. These further, lower sites were East Pasture Scraped and some East Pasture Unscraped sites. This cluster of sites was associated with bare ground (aka mudflat), and with the presence of ditchgrass (Ruppia maritima; RUMA), a species of plant generally found in sites with brackish water sites that are either always underwater, or underwater most of the time. Soil salinity also affected plant distribution, though it was weaker than the other two environmental variables. Soil salinity was associated with Axis 3, the weakest axis, and with pickleweed (Salicornia pacifica, formerly S. virginica) and brass buttons (Cotula coronopifolia). Pickleweed is highly salt tolerant, so its association with soil salinity is not surprising, but Cotula is a more brackish species, and it is surprising that this species was - at least weakly - associated with higher soil salinity. The three other environmental variables including August Water Salinity, Channel Width, and Distance to Channel, were found to have no effect on the plant community of the sites. 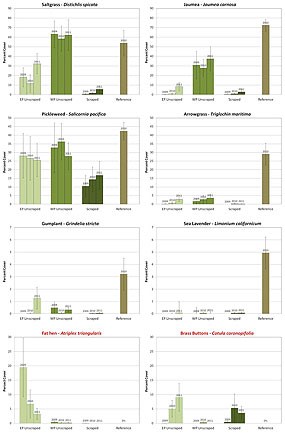
Individual Species ResponseThe above analyses indicate that species composition underwent a number of changes over the three years after restoration (Figure A6 - 255 KB PDF). Pickleweed was already present on the former west pasture, and immediately colonized suitable unscraped habitat in the east pasture, averaging 25-35 percent cover from year one (2009). Pickleweed was slower to colonize the lower-elevation scraped habitat, averaging 10% cover in year one. By year three, pickleweed increased significantly (p=0.03) in cover relative to year one, averaging 17%. Jaumea increased in percent cover over the entire project area (p=0.02), and in the East Pasture Unscraped habitat in particular (p=0.06). Like Jaumea, Arrowgrass increased both throughout the project area (0.006) and in the East Pasture Unscraped habitat (p=0.03). Gumplant also showed a trend of increase over the first three years (p=0.08), and though difficult to capture in the two-meter-by-one-meter plots, far more gumplant was visable throughout the project area in year three than in year one. Sea lavender increased in the project area, going from none to a few individuals in scattered plots, but its average cover remained so low, and the variance was so high, that this increase was not significant (p=0.32). Saltgrass showed no clear overall pattern, which may reflect that saltgrass is something of a special case within the project area. This salt tolerant species was present in both the East and West Pastures prior to restoration (albeit in smaller amounts on the East Pasture), some of which fell in the sampling sites. After restoration, saltgrass lost cover in some of the areas in which it was present prior to restoration. Loss of saltgrass cover was correlated with lower elevation (R2=0.235), suggesting that some sites that were suitable for saltgrass in the managed pasture environment where water was pumped out, may be too low (relative to the tides) for this species to survive when the levees were removed. In higher elevations, saltgrass gained cover in many sites which it colonized, or if already present, changed very little in cover. This varied response lead to no overall trend for this species. Two non-native species showed strong, and opposite trends in the vegetation die off zone over the two years. Fat hen (Atriplex triangularis) was highly prevalent in the first year after restoration, but lessened in cover each subsequent year two (p=0.08), whereas brass buttons (Cotula coronopifolia), was barely present in year one, but greatly increased in cover by year two (p=0.02), and increased still more in year three (p=0.01). 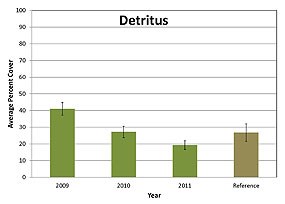
DetritusThe amount of detritus decreased significantly in the restoration project area over the years since the restoration (p=0.03; Figure A7 - 81 KB PDF). In 2010, there was no significant difference between the amount of detritus found in the project area and that in the reference site. By 2011 detritus declined further to levels that were below that found in the reference site. The downward trend in detritus (or dead vegetation) captures the spike in dead vegetation caused when restoration introduced salt water to the site, and then the gradual decomposition of this dead vegetation. The fact that detritus dropped below the reference condition may reflect that the restoration site has a greater range in elevation than the reference site, with little to no detritus found on lower elevation sites. 
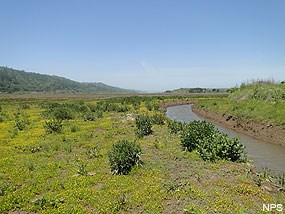
Discussion and ConclusionsAs the new marsh communities on the restoration project assemble, at some point in the future will they come to resemble the existing salt marsh plant communities in Tomales Bay? Data gathered at present indicates that the restoration area does not yet mirror the reference site. The marsh communities in Tomales Bay tend to be highly diverse and dominated by native plant species. At the reference marsh used in this study, there was an average species richness of nearly six species in each two meter quadrat, which, while low compared to some communities, is fairly high for a salt marsh. No non-native species were encountered. So far, overall species diversity in the restoration site has been significantly lower, and species composition has been different from that at the reference site. There are two non-native species at the restoration site that are not present at the reference marsh in any numbers. There are also signs; however, that the vegetation composition of the restoration site may be trending towards that of the reference site:
Many assembly plots are already just as diverse as the reference marsh, while other lower elevation plots are nearly unvegetated. As the hydrology of the site evolves, we expect some of these unvegetated plots to become colonized. We also expect vegetated plots to continue to evolve and even go through succession. As sites are colonized, new plants established, and grow, species diversity is likely to continue to increase. While the final outcome is unknown, so far the primary driving force of plant community assemblages at the restoration site appears to be elevation. The reference site, too, was ordered, at least in part, by elevation. Only the future can tell whether the plant community that ultimately results on the restoration site approaches that found in the reference marshes, or if new conditions will order a new assemblage. CitationsKeddy, P.A. 1999. Wetland restoration: the potential for assembly rules in the service of conservation. Wetlands 19:716-732. Palmer, M.A., R.F. Ambrose, & N.L. Poff. 1997. Ecological theory and community restoration ecology. Restoration Ecology 5:291-300. Wolters, M., Garbutt, A., Bekker, R. M., Bakker, J. P. and Carey, P. D. 2008.Restoration of salt-marsh vegetation in relation to site suitability, species pool and dispersal traits. Journal of Applied Ecology, 45: 904-912. Zedler JB, Lindig-Cisneros R. 2000. Functional equivalency of restored and created salt marshes. In: Weinstein MP, Kreeger DA, eds. Concepts and controversies in tidal marsh ecology. Dordrecht: Kluwer. p 569-582. Rare Plant MappingRare Plants within the Giacomini Wetland Restoration Project AreaFour species of plant found on the Project Area are considered to be "rare" plant species. These plants are Point Reyes bird's beak, Humboldt Bay owl's clover, Lyngbye's sedge, and Marin knotweed. More information about each species can be found below. Rare plants species are plant species of management concern, which encompasses species listed by the USFWS as "Threatened" or "Endangered" (i.e. federally listed), listed by the California Department of Fish and Game as "Threatened," "Endangered," or a "Species of Concern" (i.e. state listed), and those species listed by the California Native Plant Society (CNPS) as being of potential conservation concern (https://www.cnps.org/rare-plants/cnps-rare-plant-ranks). None of the species found on the Projected Area are federally or state listed species: rather they are all species that have been designated as rare by CNPS. Though these species do not have legal status, the National Park Service is directed to "proactively conserve listed species and prevent detrimental effects on these species," and, "inventory, monitor, and manage state and locally listed species in a manner similar to its treatment of federally listed species to the greatest extent possible,"(NPS Management Policy 4.4.2.3). CNPS ranks rare plant species using a list divided into five main categories, ranging from 1A (presumed extinct) to 4 (of limited distribution). Each category (except 1A), is further broken into three categories based on degree of threat to that plant. These categories are summarized in the table below.
To monitor rare plants, we map the boundary of each rare plant patch using a global positioning (GPS) unit, or if the patch is very small (<1 meter) a point is recorded. If a patch is small, we also count the number of plants within the patch. In larger plots, the number of plants is visually estimated. 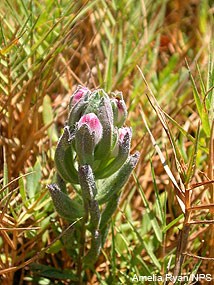
Point Reyes Bird's Beak - Cordylanthus maritimus ssp. palustris (Chloropyron maritimum ssp. palustre), CNPS 1B.2 Point Reyes bird's beak is a rare herbaceous annual plant in the Orobanchaceae family that occurs in the high marsh habitat. It is a hemiparasite, meaning that while it does photosynthesize, it requires a host plant for additional nutrients. Point Reyes bird's beak was found in natural marshes directly north of the Project Area prior to restoration, but not within the Project Area, itself. Since restoration in 2008, this species has expanded to numerous locations within the Project Area. The maps below show the distribution of Point Reyes Bird's Beak in 2005, prior to restoration, and in 2010, 2011, and 2012, post restoration. Click on one of the four maps in the image below to download it individually, or download them all in one 518 KB PDF file. 
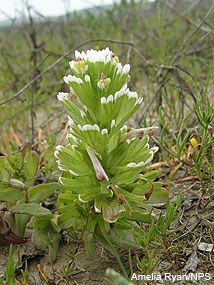
Humboldt Bay Owl's Clover - Castilleja ambigua ssp. humboldtiensis, CNPS 1B.2 Humboldt Bay Owl's Clover, like Point Reyes bird's beak, is a rare herbaceous annual plant in the Orobanchaceae family that occurs in high marsh habitat. It is also a hemiparasite, as are all members of the Orobanchaceae. Though classified as Humboldt Bay owls clover, the individuals of this subspecies found in Tomales Bay look fairly different to those found in Humboldt Bay, having white-tipped, rather than pink-tipped, bracts and lighter colored flowers. This has led some botanists to suggest that the Tomales Bay form should be given its own name. Prior to restoration, Humboldt Bay owl's clover was found in natural marshes directly north of the Project Area, and outside the levees along Lagunitas Creek, but not within the ranch pastures. Since restoration in 2008, this species has expanded to several new locations within the Project Area. The maps below show the distribution of Humboldt Bay owl's clover in 2005, prior to restoration, and in 2010 and 2011, post restoration. Click on one of the three maps in the image below to download it individually, or download them all in one 375 KB PDF file. 
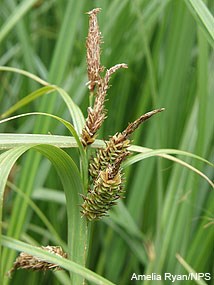
Lyngbye's sedge - Carex lyngbyei, CNPS 2.2 Lyngbye's sedge is an herbaceous, rhizomatous perennial sedge which grows in brackish (low salinity) marshes and creek banks. Lyngbye's sedge is found in two patches in the Project Area. Both patches were originally just outside the levees that separates the former dairy pastures from adjacent creeks and marshes. Though they were near the former levees, neither patch was disturbed when the levees were removed from the Project Area. No change in the distribution of this species has been observed since the restoration. Marin Knotweed - Polygonum marinense, CNPS 3.2 Marin knotweed is a small herbaceous annual in the Polygonaceae family found in brackish and salt marches. Though listed as rare by CNPS, taxonomist now think this species is probably not a rare plant, but rather a non-native knotweed (Polygonum robertii) introduced from Europe. Even if non-native, this species is not invasive (i.e. it is not known to spread rapidly or outcompete native plants for habitat). A few individuals have been seen in the Project Area before and after restoration, but given its dubious status as a rare plant, this species is not monitored regularly. | ||||||||||||||||||||||||||||||||||||||||||||||||||||||||||||||||||||||||||||||||||||||||||||||||||||||||||||||||||||||||||||||||||||||||||||||||||||||||||||||||||||||||||||||||||||||||||||||||||||||||||||||||||||||||||||||||||||||||||||||||||||
Last updated: June 27, 2024


