Filter Your Results
- Lesson Plan (10)
- Student Activities (2)
- Teacher Reference Materials (2)
- Cowpens National Battlefield (2)
- Badlands National Park (1)
- Cape Lookout National Seashore (1)
- Death Valley National Park (1)
- Denali National Park & Preserve (1)
- Kings Mountain National Military Park (1)
- Klondike Gold Rush National Historical Park (1)
- Knife River Indian Villages National Historic Site (1)
- New Orleans Jazz National Historical Park (1)
- Show More ...
- Science (9)
- Math (6)
- Social Studies (5)
Showing 14 results for graphing ...
- Type: Lesson Plan
- Grade Levels: Middle School: Sixth Grade through Eighth Grade
Students will research information to find information about the number of wounded from both patriot and British forces from the SC revolutionary battles: Battle of Camden, Battle of Waxhaws, Kings Mountain, and Cowpens. They will then create a graph that compares the number both injured and fatally wounded.
New Orleans Jazz National Historical Park
FLAMBEAUX GLEAUX: THE NEW ORLEANS MARDI GRAS FLAMBEAUX STRIKE OF 1946
- Type: Lesson Plan
- Grade Levels: High School: Ninth Grade through Twelfth Grade
This lesson concerns a strike by FLAMBEAUX, men (generally African American) in New Orleans who carry large torches to light the parades. It concerns reasons a community might become militant and the role of solidarity in such struggles. It uses music created by the New Orleans Jazz National Historical Park that is found on the cd Remembering 300- Arrowhead Jazz Band.
President William Jefferson Clinton Birthplace Home National Historic Site
Graphic Fractions
- Type: Lesson Plan
- Grade Levels: Upper Elementary: Third Grade through Fifth Grade

The teacher will introduce the concept of voting. Lead whole group discussion of voting questions, such as "When will a woman be elected President of the United States". Poll students on a pre-selected group of issues, followed by a showing of the "graphing" video (see link). Divide the class into small groups or pairs to create graphs. Once graphs are posted around the classroom, each student will individually formulate fractions from each of the graphs for credit.
- Type: Lesson Plan
- Grade Levels: High School: Ninth Grade through Twelfth Grade
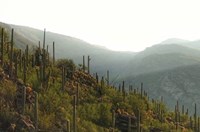
To introduce the important relationship between nurse trees and saguaros, while learning about percentage and how to create several graphs using Excel.
Ozark National Scenic Riverways
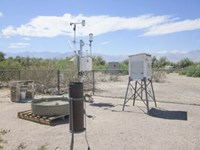
Man, it's Hot!
- Type: Student Activities
- Grade Levels: Upper Elementary: Third Grade through Fifth Grade

What does 'global warming' mean, and we are really seeing climate change? In this activity, students will read a Global Warming Information sheet, and measure and graph the local temperature.
Cowpens National Battlefield
Linear Formation of Cowpens
- Type: Lesson Plan
- Grade Levels: High School: Ninth Grade through Twelfth Grade

Cowpens has some great math examples in history to explore for a cross curricular lesson. Morgan formed his troops in three lines straddling the road. The linear formation of troops charged enemy targets while firing in unison. Although not graphed on a Cartesian plane (x-y axis), students can graph their beginning formation. Two levels of the lesson are provided. One option is for advanced students too look at the map and create their own equation and restrictions appropriate for their model. T
Denali National Park & Preserve
Climate Change and Dog Sledding in Denali
- Type: Lesson Plan
- Grade Levels: Middle School: Sixth Grade through Eighth Grade

This lesson plan explores the impacts of Denali’s changing climate on the northern tradition of dog mushing. Students will have an opportunity to practice reading graphs and analyzing trends in real climate data collected in Denali National Park and Preserve.
Death Valley National Park
Extreme Temperatures: Pre-Virtual Trip
- Type: Lesson Plan
- Grade Levels: Upper Elementary: Third Grade through Fifth Grade
Students will research temperature and precipitation data from three National Park System units and their local community. Students will express the data into charts & graphs and interpret the information to determine which park unit's weather is most similar to their local community.
Star-Spangled Banner National Historic Trail
War of 1812 Learning Module
- Type: Teacher Reference Materials
- Grade Levels: Upper Elementary: Third Grade through Fifth Grade
This reference packet for teachers includes worksheet templates for independent and guided activities utilizing a cross-curricular approach to learning. Activities can be modified to meet the needs of your group. Includes guided primary source research, graphing, writing and literacy activities.
Knife River Indian Villages National Historic Site
Biodiversity Study
- Type: Lesson Plan
- Grade Levels: Middle School: Sixth Grade through Eighth Grade

Fun, hands-on activity to introduce students to the idea of biodiversity and/or increase math graphing skills. This activity is part of a Knife River Indian Villages' field trip opportunity. However, it can be adapted to any open, wild grass area near your school.
Badlands National Park
Bison by the Numbers
- Type: Student Activities
- Grade Levels: Upper Elementary: Third Grade through Fifth Grade

The American bison was an important species to Native Americans on the Great Plains of North America. However, as settlers moved west during the nineteen century, the population numbers dramatically dropped from overhunting. In this exercise, students will learn graphing skills while learning about this species that almost went extinct.
- Type: Lesson Plan
- Grade Levels: Upper Elementary: Third Grade through Fifth Grade

In “Exploring Climate Science (Streamflow Tools and Data),” students will use data to draw conclusions about climate change. The students will be able to: 1. Create a double line graph to show the changes in streamflow throughout the year 2. Make two predictions about how climate change may affect stream flows
Klondike Gold Rush National Historical Park
Resources and Energy
- Type: Teacher Reference Materials
- Grade Levels: Middle School: Sixth Grade through Eighth Grade
Teachers can use these worksheet templates to help students understand resource and energy use. One worksheet provides a Venn diagram template with U.S. Energy Consumption source graph, and another worksheet provides a chart template for students to record information on different types of energy sources. There is also an energy research project assignment with rubric.
Cape Lookout National Seashore
Past, Present, and Future: Shackleford Horses Unit
- Type: Lesson Plan
- Grade Levels: Middle School: Sixth Grade through Eighth Grade

Lesson plan activities designed to be used over 8 class periods, each activity will need 60 minutes. This lesson plan will cover 6th-8th grade social studies relating everything back to the horse on Shackleford Banks, NC. This lesson plan has several activities to get students discussing and creating maps, charts, graphs, and historical narratives that explain historic events.