|
Restoration efforts along the Merced River are guided by the best available science. A number of research studies are ongoing to support the restoration work and inform future decisions concerning the most effective methods and locations for restoration work as well as the management of bridges and infrastructure along the river. Through these studies, both park managers and the public are gaining a better understanding of the ecological condition of the river, how the floor of Yosemite Valley was formed, and how the river naturally moves and shapes its channel. Learn more about findings from these studies: Restoration of the Merced River: Phase 2 Report [2.4 MB PDF] Geology of Yosemite ValleyGeologic history and processes set the physical template for the river corridor, reveal the undisturbed pre-anthropogenic behavior of the river, and help to anticipate the river’s response to future manipulations and climate change. The modern landforms of the Yosemite Valley floor are primarily created through two processes—the lateral delivery of sediment from the steep bedrock walls, contributed primarily by episodic rockfalls and debris-flow fans built by the tributary channels, and the downvalley transport and deposition of sediment by the Merced River. The river emerges from the primary influence of coarse-grained glacial-age sedimentary deposits in the reach between Clarks Bridge and Sugar Pine Bridge, and it continues downvalley largely encased by its own floodplain deposits except where locally impinged upon by valley-wall deposits. The most prominent, widespread valley-bottom feature is a terrace of fluvial sand and gravel with a surface typically 2-2.5 m above the modern summertime baseflow of the river through the Study Area, and on which most of the Valley’s iconic meadows have developed. This surface is still a zone of active deposition, at least episodically. 
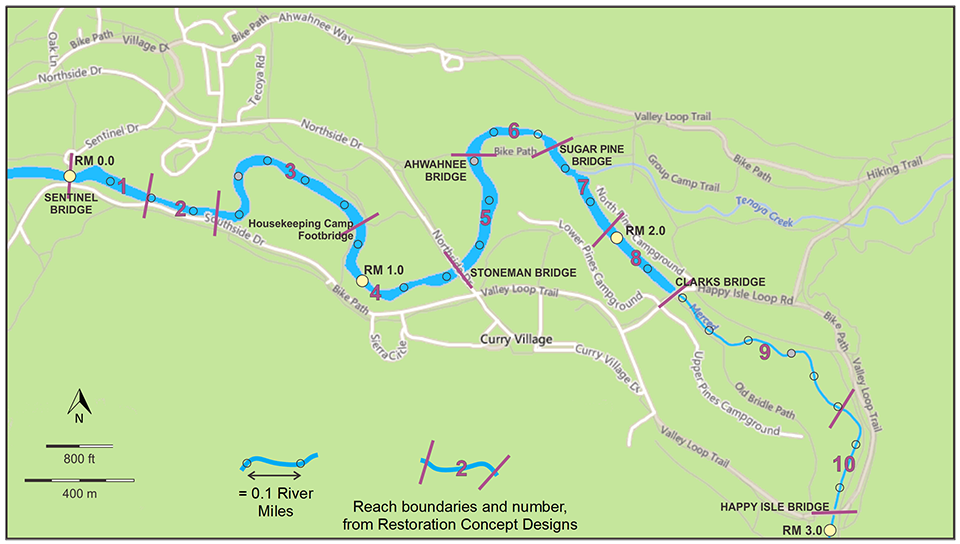
Channel Margin ConditionsInitial studies conducted to support river restoration efforts included a physical survey of existing conditions in the Merced River channel. This census produced initial recommendations on potential opportunities and restoration concepts that holistically addressed the health of the river and riparian corridor.

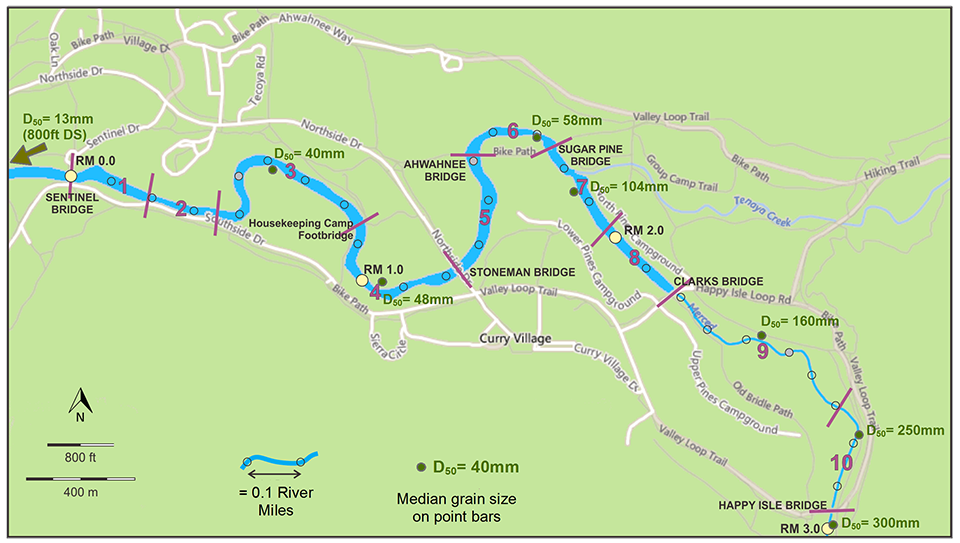
D. Boothe Channel Sediment CharacterizationThis diagram displays the median sediment diameter (D50) found in the channel bed at points along the Merced River, displaying the monotonic reduction in sediment size as the river enters Yosemite Valley above Happy Isle Bridge and declines in gradient as it reaches the valley floor. 
D. Boothe Channel Migration ModelingThe Merced River, like all meandering sinuous channels, tends to erode on the outside of bends, and tends to deposit on the inside of bends. In many places, such dynamic activity is restrained, and yet the tendency remains, creating forces on the banks and any infrastructure that might be there. Planning on the Merced will benefit greatly from understanding the inherent tendencies over time. We have used a meander migration simulation model to investigate such tendencies, and to identify areas along the river where natural geomorphic processes are particularly susceptible to the influence of artificial bank-hardening structures. The following image shows the types of output that the meander migration model provides for the study reach on the Merced River. 
E. Larsen |
Last updated: October 20, 2020
