An official website of the United States government
Here's how you know
Official websites use .gov A
.gov website belongs to an official government
organization in the United States.
Secure .gov websites use HTTPS A
lock (
) or https:// means you've safely connected to
the .gov website. Share sensitive information only on official,
secure websites.
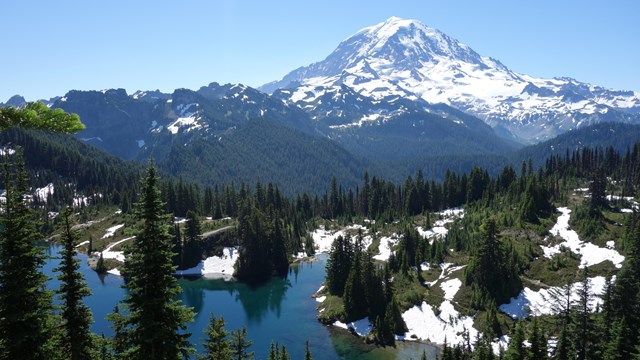
“Only when one comes to listen, only when one is aware and still, can things be seen and heard. Everyone has a listening-point somewhere...some place of quiet where the universe can be contemplated in awe.”
- Listening Point by Sigurd Olsen
Soundscape recording site near Kautz in 2017.
NPS Photo
What are natural soundscapes - and why are they important?
The audio equivalent of a landscape, a natural soundscape is the combination of an area’s natural sounds. Natural soundscapes can include everything from animal and bird sounds to rushing water, wind through vegetation, glacial crevassing, to thermal or volcanic activity. The amplitude of these sounds is measured in a unit known as decibels (dB), which is similar to the Richter scale for earthquakes because an increase of 10 dB equals a 10-fold increase in intensity. Below are some examples of sound pressure levels measured in national parks.
Sound Level (dBA)1
Sound Source
0
Threshold of human hearing
10
Volcano crater
20
Leaves rustling
40
Crickets at 5 meters
60
Conversational speech at 5 meters
80
Cruiser motorcycle at 15 meters
100
Thunder
120
Military jet at 100 m AGL
126
Cannon fire at 150 meters
1Sound levels are often adjusted ("weighted") to match the hearing abilities of a given animal. Sound levels adjusted for human hearing are expressed as dB(A).
These sounds are vital to the natural functioning of ecosystems. For example, they play important roles in the ability of wildlife to communicate, establish territory, find prey or avoid predation, experience courtship rituals and mate, and protect young.
Natural soundscapes also integral to the experiences visitors have in wild places like the Mount Rainier Wilderness. The sounds of elk bugling and glaciers cracking - or mountain music - can create a sense of awe that connects us to the splendor of a natural environment. In fact, a system-wide survey of park visitors revealed that nearly as many visitors come to national parks to enjoy the natural soundscape (91 percent) as come to view the scenery (93 percent) (Report on the Effects of Aircraft Overflights on the National Park System, Table 6.1. 1995).
Human-caused noise, however, can threaten natural soundscapes - and the value afforded by them. Noise from transportation including military, commercial, private overflight, and park operations as well as vehicles contribute the largest amounts of noise.
Given the impact soundscapes have on ecosystems and visitors’ experiences, the National Park Service regards natural sounds as a resource that must be protected. Specifically, the agency policy on soundscape management states: “The National Park Service will preserve, to the greatest extent possible, the natural soundscapes of parks.” (National Park Service 2006 Management Policy, Soundscapes Section 4.9, pg 56).
Pika calls were some of the sounds recorded in the park.
NPS Photo
What does Mount Rainier sound like?
Mount Rainier’s soundscape program aims to answer this question. Acoustical monitoring stations are located throughout the park to capture soundscapes of the diverse vegetation and elevation zones, and a sampling of the recordings collected can be explored in the map above.
Overall, the thousands of hours of audio recorded reveal numerous species such as woodpeckers at Trail of the Shadows, barred owls and red-tailed hawks at Green Lake, elk at Crystal Mountain, bears at Lakes Trail, and pikas at Sunrise Ridge. There were also recordings collected of a rock slide at Green Lake and shale sliding down the slope on Crystal Mountain. Soundscape equipment also captured audio from a 2015 debris flow along Tahoma Creek. Along with wind and flowing water, these are just a few of the many natural sounds which join to create the acoustical environment in Mount Rainier National Park.
In addition to natural sounds, studies found Mount Rainier National Park to be moderately impacted by human-caused noise. Over all hours of the day, human-caused sounds were audible between 12.5 and 26 percent of the time in the backcountry and 40 percent of the time in the developed areas of the park. At the backcountry sites aircraft were the most pervasive non-natural sound source, audible between 11 and 24 percent of the time.
Installation of sound equipment at Shriner Peak Trail (left) and Ptarmigan (right), Mount Rainier National Park
NPS Photos
Figure 1. Mount Rainier Spectrograms
NPS Image
Figure 1. Mount Rainier Spectrograms
Sounds occur in different frequencies and are represented visually using a spectrogram, an image that incorporates frequency (y axis), time (x axis), and amplitude (brightness of color). This spectrogram displays 60 minutes of sounds from Ptarmigan Ridge, Mount Rainier National Park in 2013. Each row displays 20 minutes of acoustical data. Brighter colors indicate louder sounds, which stand out from the quiet blue background. Each type of sounds has its own unique signature, allow us to read the spectrogram and see what sounds occurred during the hour.
Metrics
The National Park Service examines several metrics to learn more about the condition of the acoustic environment at each site. Examples of these measures include daily or hourly sound pressure levels, and percent time that certain sounds can be heard. High frequency sounds (such as a cricket chirping) and low frequency sounds (such as thunder rumbling) often occur simultaneously, so the frequency spectrum is split into 33 smaller ranges, each encompassing one-third of an octave. The sound levels for 33 one-third octave band frequencies over the day (yellow) and night (purple) periods at Longmire during the summer of 2006 are shown in Figure 2 below.
Key points:
The grayed area of the graph represents sound levels outside of the typical range of human hearing. For example, in order for us to hear very low frequency sounds (far left), we need them to be really loud (higher sound pressure level). Similarly, we need high pitched sounds (far right) to be really loud for us to hear them.
The exceedance levels (Lx) represent the sound level exceeded x percent of the time. For example, L90 is the sound level that has been exceeded 90% of the time, and only the quietest 10% of the samples can be found below this point. On the other hand, the L10 is the sound level that has been exceeded 10% of the time, and 90% of the measurements are quieter than the L10.
The size of the bold portion of the column between the L50 (median sound level) and Lnat (natural ambient) is directly related to the percent time that human caused sounds are audible. When bold portions of the column do not appear, the natural and existing ambient levels were either very close to each other, or were equal. In the examaple figure below, the night hours were quieter, and human caused sounds at night were audible less frequently than during the day.
Figure 2. Day and night decibel levels for 33 one-third octave bands at Longmire, Fall 2006.
NPS Image
Use of Soundscape Data in Other Disciplines
Data from the soundscape array can have unexpected benefits to other groups studying the features of Mount Rainier’s dynamic landscape. In 2015, a soundscape monitor was placed near Tahoma Creek and was recording during a sequence of outburst floods and debris flows that occurred on August 13th. The soundscape data proved to be invaluable to geologists as it not only recorded the passage of each of the four debris flow surges, but it also recorded an unusual, anomalous, and never-before-seen decrease in “river noise” beginning about an hour prior to the first debris flow surge’s arrival (Figure 3). This critical finding suggests that there was a physical blockage either in or just downstream of the South Tahoma Glacier which decreased the flow of water to Tahoma Creek. Following the third debris flow surge, the “river noise” was elevated, which suggests that the physical blockage was eliminated and the impounded water was released to the stream. Higher than normal flows were seen for several days after the debris flow event, which was corroborated by the soundscape data. Without the data from the soundscape array, a critical finding from the August 13th 2015 debris flow event would have been missed.
Figure 3. Soundscape Data from August 13, 2015.
NPS Image
Figure 3. NPS Soundscape data as recorded near Tahoma Creek on August 13, 2015. Data is clipped to the period between 8:00 AM – 8:00 PM. The green line indicates the 42-day average background level, while the blue line is the sound trace from August 13th. Individual seismically-indicated debris flows (DF) are correlated to peaks in the sound trace from 10:00 AM to 1:00 PM.
Additional Resources on Mount Rainier's Soundscape