Rivers, Snow, and Hydrology

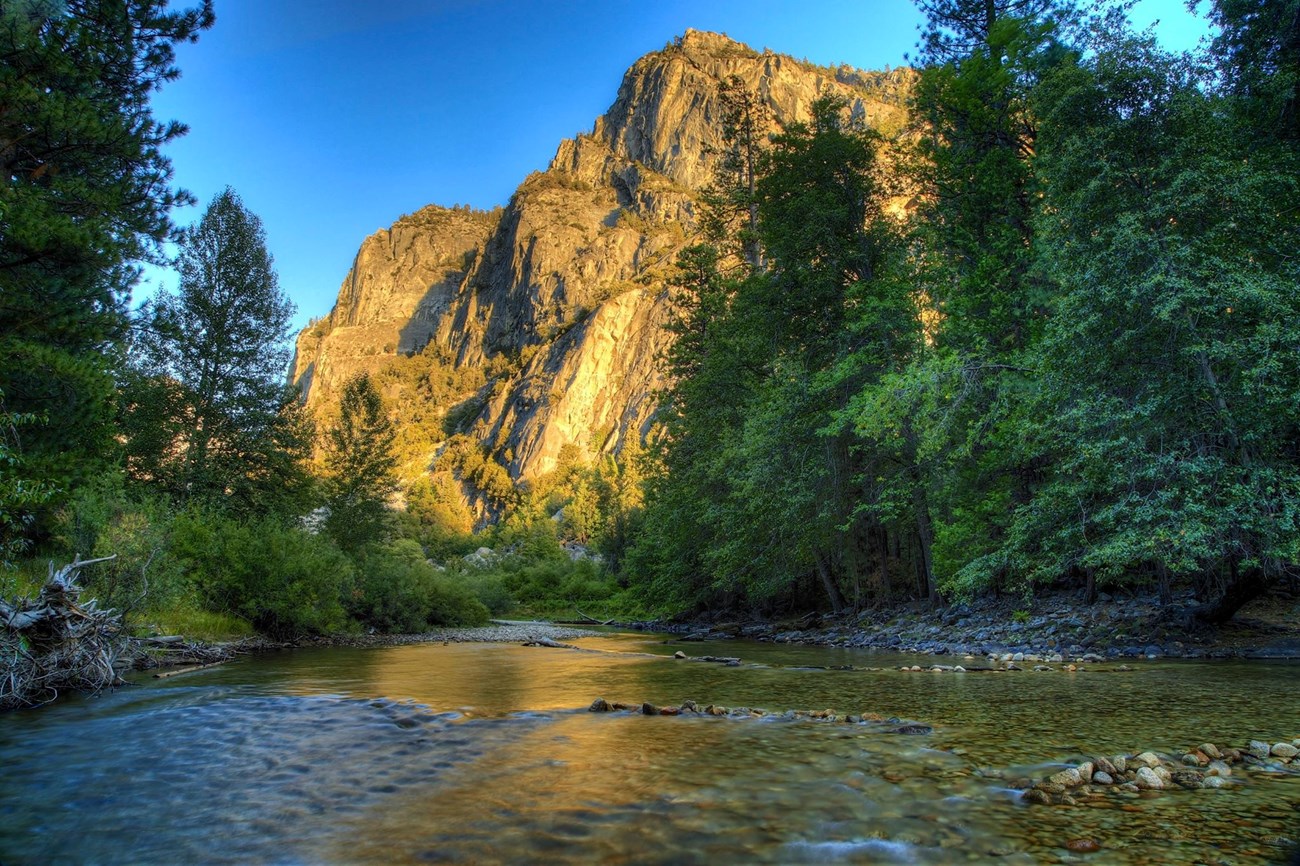
Sunlight shines on river flowing by green shrubs and trees and lights a cliff golden in the background.
South Fork of the Kings River in Kings Canyon National Park.

Photo courtesy of Bob Nelson

These parks contain the headwaters of three major rivers – the Kings, Kaweah, and Kern. Rivers and streams are the major transporters moving snow meltwater downslope to lakes, meadows, forests, and foothill shrublands and oak woodlands. Beyond park boundaries they transport water to reservoirs where it is distributed to farmlands, cities, industries, and wildlife refuges in California’s Central Valley. About 60% of California’s fresh water (and 75% of its agricultural water) comes from the Sierra Nevada snowpack.
Most of the parks’ land area is mid- to high-elevation, where snow is the major form of precipitation. The snowpack is a frozen reservoir that gradually melts in spring and summer, supplying water to thirsty plants, animals, farms, and communities through the dry summer and early fall seasons. In recent years, severe droughts have greatly reduced the snowpack while warming temperatures have raised the snowline to higher elevations, so that more precipitation falls as rain where historically it snowed. Rain, unlike snow, washes away and won’t be saved in the snowpack for the dry season, when it is most critically needed!

 
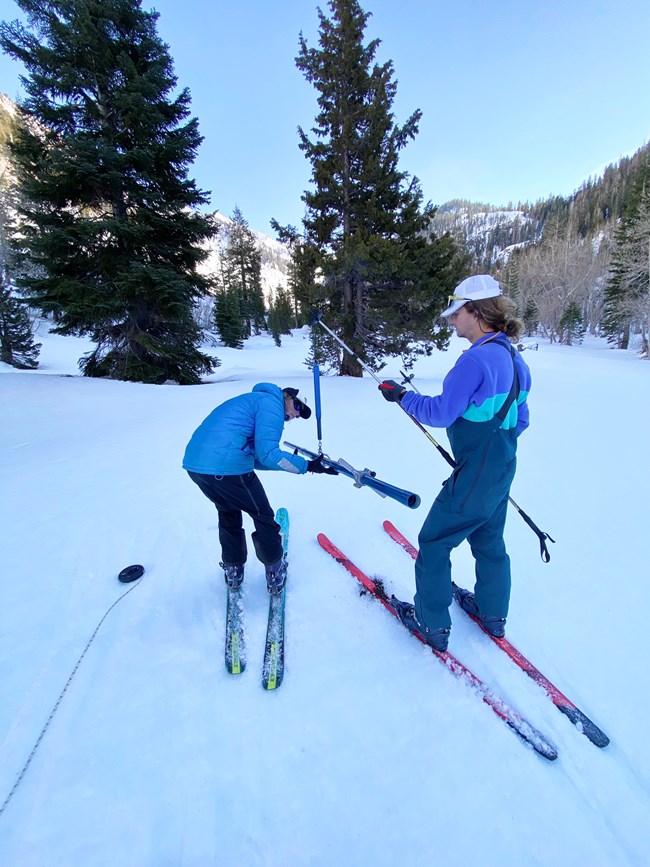
Two people on skis weigh a long tube that's used to sample snow for depth and water content on monthly snow surveys.
Two scientists weigh a long tube used to sample snow on monthly winter and spring snow surveys. These data help the state estimate the amount of water in the snowpack.

NPS Photo - Joshua Flickinger

What is hydrology?

Water is a major driver of where plants and animals live in the Sierra Nevada. Hydrology is the study of water and its interactions with the landscape. Precipitation falls on these parks as rain or snow, some of which immediately runs into lakes and rivers. Some is stored in snowpack or groundwater, used by plants, or evaporates back into the atmosphere, only to fall somewhere else. The science of hydrology studies the processes that control how much water flows into our streams, how much is stored underground, how much moves through the landscape, what the water quality is, and the ways it is recycled in the natural environment.
The National Park Service works with partners to monitor weather, river discharge (amount of water), and snowpack. These datasets help managers understand and estimate current condition and trends in water availability for park ecosystems and downstream water users.

 
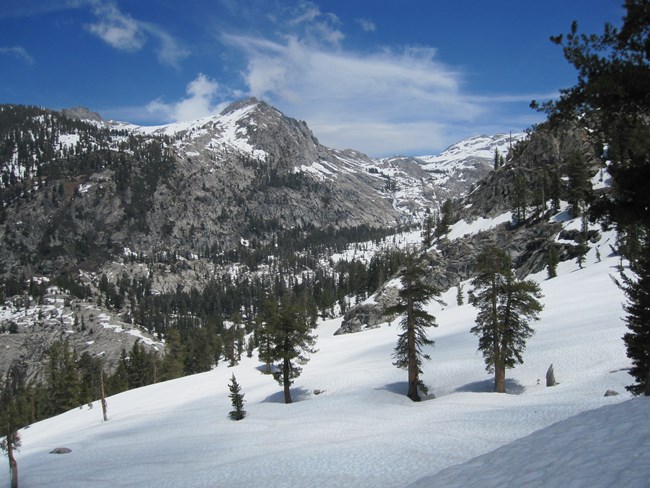
View of a snowy slope with conifer scattered conifer trees and rugged granite slopes and peak in distance with patches of melting snow.
During a drought year, this Marble Fork of the Kaweah River watershed has much less snow than in an average year, where much of the upper granite slopes would have more snowcover. This photo was taken in April 2014.

NPS Photo - Linda Mutch

Climate Change Impacts on Hydrology

Climate change is having profound effects on water resources in the Sierra Nevada and the ecosystems that have evolved within a snowmelt-driven hydrologic system. One of the most widely observed trends that will continue to affect the hydrologic cycle is an increase in air temperatures. The region's climate has warmed 1.4 to 1.8°F (0.8-1.0°C) over the past 100 years, and there is scientific consensus it will continue to warm.

Some of the most notable effects of increased air temperatures on river flow occur through snow accumulation and snow melt. Air temperature influences the form in which precipitation falls, and warmer air temperatures raise the elevation of the rain-snow transition zone. In the mountains, as this zone moves upward, more precipitation falls as rain rather than snow.

Scientists have documented hydrologic changes (earlier snowmelt runoff, reduced summer base flows of streams, and decreased winter snowpack) in the Sierra Nevada and western US and predict further changes. These changes and others, including more erratic winter flows and extreme flood events, prolonged low summer flows, reduced soil moisture, and periodic drying of streams that once flowed year-round are illustrated in Figure 1.

 
Graph shows stream discharge for 1 year - a blue line shows an average, historic pattern of one pronounced snowmelt period and peak in June to early July, and another line showing climate change related impacts - rain-on snow events and prolnged low flows
Figure 1. The blue line in the graph shows the average, historic streamflow pattern with one major peak for stream runoff. The gray line shows changes occurring or anticipated with climate change - many more peaks related to rain-on-snow events or more erratic flows, plus prolonged low summer flows and periodic drying of perennial streams.

Adapted from a presentation by David Herbst, Sierra Nevada Aquatic Research Lab, Marine Science Institute, UC Santa Barbara.
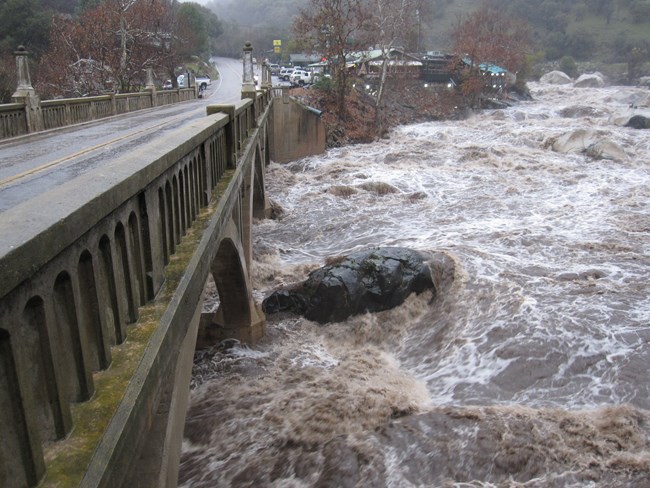
 
Muddy, high river water rushes downstream past a riverside restaurant and under a bridge in December 2010.
The Kaweah River just outside of Sequoia National Park, close to flooding in December 2010, after substantial precipitation. In January 1997, a bigger event where warm rains fell on snow at mid to high elevations, caused even higher flows that damaged bridge abutments.

NPS Photo - Tony Caprio

Climate change increases risk of severe storms and floods.

Although drought has been a prevalent pattern in the past decade, the risk of severe floods has also increased with climate change. Recent research indicates that climate change has doubled the likelihood of precipitation events capable of producing catastrophic flooding, and larger increases are likely due to continued warming. Warmer air can hold more moisture. Runoff in the future storm scenario is 200 to 400% greater than historical values in the Sierra Nevada because of increased precipitation rates and decreased fraction of precipitation as snow. And megastorms are also likely to occur more often: Extreme flood events that historically occurred once every two centuries could occur approximately three times per century.


Learn More

Loading results...
     

    References

    National Park Service. River Monitoring. Web page for Sierra Nevada Network Inventory & Monitoring Program. Accessed 22 August 2022.

    National Park Service. Hydrology. Web page for Yosemite National Park. Accessed 22 August 2022.

    Rice, R., and R. C. Bales. 2013. A natural resource condition assessment for Sequoia and Kings Canyon National Parks: Appendix 7a – rain, snow, and temperature. Natural Resource Report NPS/SEKI/NRR—2013/665.7. National Park Service, Fort Collins, Colorado.

    Swain, D. 2022. ARKStorm 2.0: Climate change is increasing the risk of a California megaflood. Research Summary, Weather West Blog.

    Last updated: October 4, 2023

    Park footer

    Contact Info

    Mailing Address:

    47050 Generals Highway
    Three Rivers, CA 93271

    Phone:

    559 565-3341

    Contact Us