One of the greatest challenges for park managers and planners is in connecting these climate drivers to the actual resources they must manage and protect. At the end of the day, climate projections suggesting ranges of temperature increase or upper and lower bounds on variables like seasonal precipitation have limited practical value for shaping policy and guiding investment.
Introduction

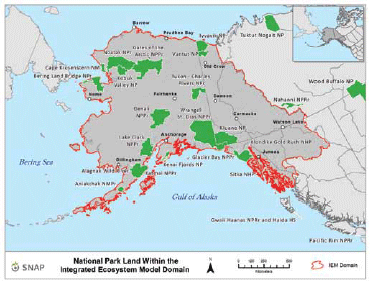
Map courtesy of the Scenarios Network for Alaska and Arctic Planning (SNAP)
By any measure, climate change promises to bring major impacts to parks and preserves in the Alaska region. We know with great certainty that temperatures will continue to increase in coming decades, and warming will undoubtedly be accompanied by some combination of altered precipitation regimes, changes in seasonal weather patterns, and shifting extremes (IPCC 2007).
However, one of the greatest challenges for park managers and planners is in connecting these climate drivers to the actual resources they must manage and protect. At the end of the day, climate projections suggesting ranges of temperature increase or upper and lower bounds on variables like seasonal precipitation have limited practical value for shaping policy and guiding investment.
In-and-of themselves climate projections offer little actionable information. Climate projections only take on meaning in the context of park adaptation management and planning when they can be linked to impacts on the resources, services, and amenities these lands provide.
Fortunately, we have a growing set of tools to help us address the challenge of linking changes in climate to the physical, ecological, and cultural systems that make up our parks and preserves. We can, for example, rely more and more on observed links between park resources, climate variability, and climate change gleaned from field observations.
Efforts such as the US National Park Service’s (NPS) Inventory and Monitoring program are particularly valuable in this sense. Likewise the NPS’ use of Scenario Planning (Weeks et al. 2011) is helping park managers and stakeholders envision the potential range of future climate change impacts, while also providing a platform for exploring adaptation and mitigation options.
Here we describe another approach centered on the use of modeling to connect climate-change drivers to tangible on-the-ground impacts in parks. At the most basic level, the Integrated Ecosystem Model (IEM) for Alaska and Northwestern Canada ingests climate scenarios (historical or projected future) and, in turn, uses tightly interconnected simulations of key physical and ecological processes to produce estimates of future landscape response.
The IEM is focused on producing spatially-explicit (e.g., map-based) outputs that can serve as stand-alone decision support tools. This effort is also designed to produce information that can be integrated into many of the tools used by resource managers and planners. Such process-based simulations are of vital importance because they offer us the ability to explore novel climate-ecosystem-resource interactions and potential events that may be outside the bounds of available observations.
The IEM domain covers most of Alaska, the Yukon Territory, and portions of northern British Columbia (Figure 2). This domain was originally chosen to coincide with the Arctic, Western Alaska, and Northwest Boreal Landscape Conservation Cooperatives (http://alaska.fws.gov/lcc), and the northern portion of the North Pacific LCC.
The domain is also governed by practical concerns. For instance, portions of the Northwest Boreal LCC in the Mackenzie and Selwyn Mountains area are not included in the domain due to a lack of critical climate data. Similarly the Aleutian and Bering Sea Islands are also not included because the heavily maritime-influenced processes at work in these areas are not well represented by the IEM.
Just as this general modeling approach allows us to consider climate-ecosystem scenarios beyond those captured in the observational record, this large, cross-border domain is intended to help us understand cross-boundary processes.
Building an Integrated Ecosystem Model

NPS Image
Three models that depict different components of high latitude landscapes provide the basic building blocks of the IEM. Collectively these individual models have been used in hundreds of ecosystem impact studies. All three have a long track record of applications in Alaska and northwest Canada, including previous work in the context of parks and preserves (e.g., Loya et al. 2011).
However, this new IEM effort represents the first time these tools have been brought together in a coupled fashion, thereby allowing us to more fully understand feedbacks and interactions between the many interconnected elements of high-latitude landscapes. It is also worth noting that all three of these building blocks emphasize spatial patterns in ecosystem variability and change, as will results from the full IEM.
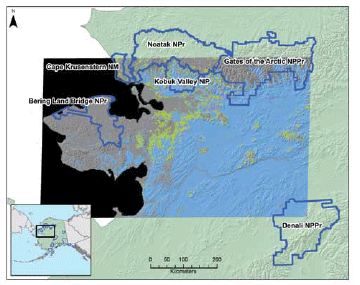
The Alaska Frame-Based Ecosystem Code (ALFRESCO) is being used to simulate vegetation dynamics including establishment, succession, and migration (Figure 3), along with disturbance processes such as wildland fire and insect outbreaks (Rupp et al. 2007). ALFRESCO was originally designed to model the dominant landscape-scale processes in boreal forest ecosystems, and it has been successfully applied in National Park Service units from Interior Alaska including Denali National Park and Preserve, Yukon-Charley Rivers National Preserve, and Wrangell-St. Elias National Park and Preserve.
Meanwhile, recent updates have greatly enhanced its utility for understanding changes in shrub and tundra ecosystems. More specifically, the latest ALFRESCO development work has focused on the ability to capture potential transitions between conifer and broadleaf dominated vegetation types, and to track shifts in both latitudinal and altitudinal treeline. Likewise, work on ALFRESCO is also moving towards improved depictions of the dominant ecosystem types found in Southeast Alaska, and in particular the coastal temperate rainforest.
The application of ALFRESCO to Southeast Alaska is especially important and exciting as it will give us a chance to explore processes and potential climate-vegetation interactions with little or no historical precedent. For example, some climate-change projections suggest the possibility of emerging drought impacts in Southeast Alaska. If that were the case, drought conditions could also introduce the chance for fire and novel pest outbreaks. Because we have no observed analogs for these types of situations in southeast Alaska, it is vitally important that we be able to simulate related dynamics within the context of the IEM.
The second basic component of the IEM is the Terrestrial Ecosystem Model (TEM; Yi et al. 2010). TEM is used to describe fundamental terrestrial ecosystem processes, while also giving us insights into related hydrologic variability.
In short, TEM simulates the movement of carbon, nitrogen, and water through plants and soils based on inputs including climate, vegetation type, elevation, solar radiation, and substrate. TEM has been widely used to understand how different scenarios for climate variability and climate change might affect net primary productivity and other critical ecosystem characteristics at regional to global scales. In the case of the IEM project, however, special attention is being given to the ability of TEM to portray changes in the quantity and quality of forage available for ungulate consumption.
Moreover, the IEM team is looking at multiple ways to improve the representation of hydrology at high latitudes. As one example, the IEM team has formed a working group focused exclusively on the modeling of wetland and thermokarst dynamics via TEM. At the same time, members of this wetland-thermokarst group are conducting field experiments and collecting real-world observations to feed into these simulations. Similarly, IEM team members have begun preliminary work to better account for the contributions of glaciers and snowmelt to regional hydrology in southeast and southcentral Alaska.
Overall, the resulting spatially-explicit representations of plant productivity, plant community types, nutrient fluxes, and water availability will be critical for resource managers as they seek to understand the impacts of climate change on parks, preserves, and other large natural areas. In addition, once fully coupled with the other components of the IEM, output from the TEM-based simulations will give us a unique look at how large parks and preserves can serve as sources or sinks of carbon, and thus help us better appreciate the significance of these lands in a global context.
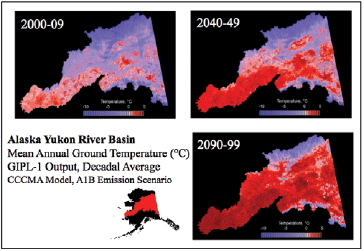
Lastly, the Geophysical Institute Permafrost Lab (GIPL; Jafarov et al. 2012) model is being used to simulate permafrost dynamics in the Arctic and sub-Arctic ecosystems of Alaska and northwest Canada (Figure 4). In essence the GIPL model simulates changes in the ground thermal regime as driven by inputs of climate, vegetation, soils, topography, and geology. Snow distribution and the role of snow as a ground insulator are also major players in GIPL.
As heat moves through the simulated ground layers, water freezes and thaws, and GIPL thus yields spatially-explicit information on permafrost extent, ground temperatures, active layer thickness, and freeze/thaw regimes over time. While the IEM team anticipates that related outputs will be of interest in areas currently underlain by more-or-less continuous permafrost, the most significant results for parks and resource management are likely to come from areas that now feature discontinuous permafrost.
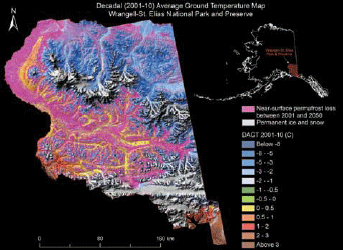
Because changes in permafrost can trigger substantive changes in hydrology, further development of the GIPL module is proceeding in close cooperation with the wetlands and thermokarst group mentioned earlier. Special attention is also being given to the relationship between permafrost change, lakes, and rivers. Late 2013 should also see the start of major efforts aimed at understanding how climate change and associated permafrost dynamics might impact infrastructure and access to resources in parks and preserves (e.g., Figure 5).

NPS Image
Figure 4 shows the simulated distribution of near-surface permafrost as indicated by mean annual ground temperatures at 1 m depth (blues – temperature < 0° C and red – temperature > 0° C) in the Alaska portion of the Yukon River Drainage Basin for the decades 2000-2009, 2040-2049, and 2090-2099.

NPS Image
Figure 5 shows decadal average ground temperatures during the period 2001-10 for Wrangell-St. Elias National Park and Preserve overlain with areas susceptible to active near-surface permafrost thawing (shown in pink) by 2051-60.
Progress to Date
While the IEM is still in its developmental phases, much has been accomplished. The project began in earnest during 2010-2011 with a pilot exercise focused on the Alaska portion of the Yukon River Basin. The central feature of this exercise was a proof-of-concept model run linking ALFRESCO, TEM, and GIPL in a simple, linear fashion where the component models communicated sequentially.
This pilot work was especially helpful for evaluating the degree to which feedbacks between forest types and fire regime might alter organic soils and permafrost under climate warming (Rupp et al. 2012). Likewise it also pointed out the need to better model certain elements of wetland hydrology.
More recent accomplishments include the final compilation of downscaled climate datasets (historical and future projections) for use in driving the IEM. Similarly, biophysical parameters have now been developed for the entire project domain. Of particular note, these input variables include a newly developed 820 ft (250 m) resolution vegetation map based on the North America Land Change Monitoring System model (CEC 2010).
The individual ALFRESCO, TEM, and GIPL models have been “cyclically” coupled over the past year. In short, this involves assembling all of the models on a common computer platform, and then allowing them to communicate at regular time intervals. In a technical sense the current mode of operation is something just shy of the fully-coupled, dynamic framework envisioned for the IEM. However, this still represents an enormous accomplishment in terms of computer programming and hardware, software, and data integration. Other major milestones include the development of new algorithms describing tundra fires and tundra-treeline dynamics, selection of conceptual approaches for representing thermokarst dynamics at management-relevant spatial scales, and continued field studies that provide insight into carbon and vegetation dynamics in boreal fens and collapse-scar bogs resulting from thermokarst formation.
IEM is focused on generating datasets that can be directly applied to natural and cultural resource management and planning. Plans for distributing IEM output emphasize free and easy access. Moreover, derivative products and the underlying source code will be made available to the management and scientific research community alike. General categories of data products include maps depicting historical and future climate; vegetation types, landcover and landscape structure; disturbance types, frequencies and intensities; key ecosystem processes; soil properties; and permafrost distribution and dynamics (Table 1).
The IEM team will provide thorough documentation describing the modeling process, along with practical, user-friendly descriptions of model uncertainty.
| Dataset Name | Data Type | Description |
|---|---|---|
| Historical and projected average monthly temperature, precipitation, radiation, and vapor pressure | Spatial | Downscaled historical grid-based products and downscaled projections of monthly temperature, precipitation, radiation, and vapor pressure from multiple sources. |
| Treeline extent | Spatial | Maps depicting projected treeline change under selected climate scenarios. |
| Potential vegetation distribution | Spatial, tables/graphs | Modeled distribution of dominant vegetation types (e.g., black spruce or shrub tundra). Graphs showing changes in area of vegetation types through time. |
| Area burned and burn severity | Spatial, tables/graphs | Maps and graphs that depict simulations of area burned and burn severity under selected climate scenarios. |
| Potential susceptibility to thermokarst formation | Spatial | Results of model runs used to identify areas susceptible to thermokarst disturbance. Datasets may include fractional coverage of thermokarst/wetland landforms, distance from surface to ice rich permafrost, amount of ice in the soil column, drainage efficiency (parameter that describes the ability of the landscape to store water), and soil water content. |
| Carbon fluxes and pools | Spatial, text, tables/graphs | Model output related to carbon fluxes (GPP, Net Primary Productivity, decomposition, carbon released by fire, etc.) and carbon pools in soil and vegetation. |
Conclusions and Acknowledgements
Modeling that links climate to ecosystem processes is certainly not the only means for parks and other resource managers to connect climate change with real world impacts. However, climate-driven ecological process modeling such as the IEM effort has several important strengths. In particular it allows us to consider ecosystem- and landscape-change scenarios outside range of historical experience. Such approaches also give us a tool for exploring complex feedbacks, interactions, and threshold responses that may not be evident from field studies or other observations. Overall, linking ALFRESCO, TEM, and GIPL will produce a more realistic picture of future ecosystem conditions and, in turn, help us more effectively plan for climate change and manage the resources these lands provide.
Acknowledgements
The authors wish to thank Paul Duffy, Zhaosheng Fan, Guido Grosse, Dustin Rice, David Swanson, Mark Waldrop, and Feng-Ming Yuang for their contributions to this effort. Funding for this work was provided by the Alaska Climate Science Center; Arctic, Western Alaska, and Northwest Boreal Landscape Conservation Cooperatives; and the National Park Service’s Climate Change Response Program.
Further information is available at:
https://www.doi.gov/csc/alaska/
http://csc.alaska.edu/
Part of a series of articles titled Alaska Park Science - Volume 12 Issue 2: Climate Change in Alaska's National Parks.
Last updated: August 7, 2015
