After several years of monitoring, scientists can begin to analyze trends and explore changes to national parks in Alaska

NPS Photo
By design, the National Park Service’s Inventory and Monitoring (I & M) program identifies key resources in national park units, called vital signs, then sets out to document and track the condition of those resources using rigorous protocols (Fancy et al. 2009).
In addition, important drivers of changes in resource condition, including climate change, are incorporated into the monitoring either by direct monitoring (e.g. weather) or by monitoring resources impacted by the drivers in question. In recent years, established monitoring programs have reached a point of delivering results and trends. In addition, supplemental funding has enabled I & M to oversee several studies aimed at assessing the current and potential impacts of climate change.
Established Monitoring Programs— Delivering on the Promise

Credit?
In the early years of the I & M program, focus was placed on the selection of key resources (vital signs) and on designing monitoring programs to track the status of the selected vital signs. Established monitoring programs are now starting to deliver results on the condition of vital signs, and in the process, they are not only telling us the story of these resources, but how climate change may be affecting parks, now and in the future.
Recent studies suggest that climate warming in interior Alaska may result in major shifts from sprucedominated forests to broadleaf-dominated forests or even grasslands. To quantify patterns in tree distribution and abundance and to investigate the potential for changes in forest dynamics through time, the Central Alaska Network initiated a spatially extensive vegetation monitoring program covering 3.2 million acres (1.28 million ha) in Denali National Park and Preserve. In early 2013, Carl Roland, Fleur Nicklen, and Josh Schmidt published an article in the prestigious journal Ecological Monographs describing the landscape patterns they observed during the decade-long study (2001–2010).
In contrast to some previous studies, the authors report that white spruce (Picea glauca) may respond favorably to warming conditions by increasing in abundance and distribution by expanding into newly thawed terrain. In addition, this study reports no current evidence for a large-scale shift from spruce to broadleaf forests in the lowlands of Denali National Park, where coniferous forests still dominate the landscape (Roland et al. 2013).
Vegetation monitoring was established in Denali in the mid-1990s. In 2001, the new study design was implemented across a large area in the northern portion of the park as part of the Central Alaska Network’s monitoring efforts (MacCluskie et al. 2005).
The tree data presented in the 2013 article present one facet of the vegetation monitoring program data, whose overall goal is to establish a robust, statistically rigorous baseline for important aspects of vegetation structure and composition at a landscape scale that will allow us to detect changes in these attributes over time. In 2013 and 2014, sampling efforts using the same protocol will be focused in Yukon-Charley Rivers National Preserve.
Tracking Growing and Winter Season Processes
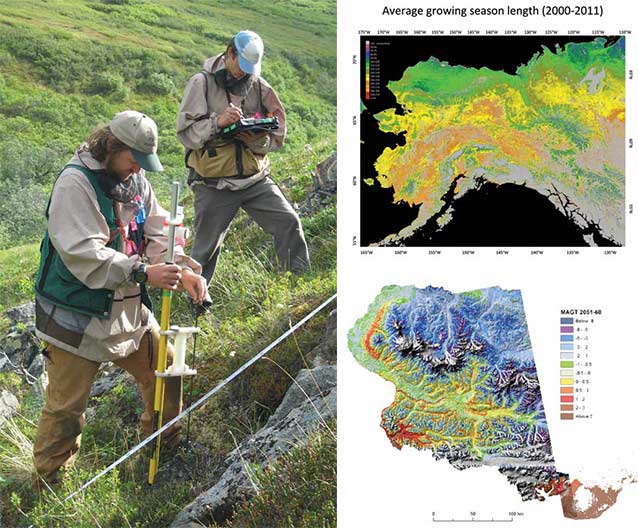
Globally, leaf-out and flowering dates are occurring earlier in the spring, and fall colors are turning later. Across Alaska, the I & M Program is using MODIS satellite data to track variation in growing season length (Normalized Difference Vegetation Index, or NDVI) as well as snow cover metrics. As NDVI—an indicator of vegetation productivity—increases in the spring and declines in the fall, it provides an approximation of when the growing season starts and ends.
To date, data for NDVI has been analyzed for ten-year periods in the Southwest Alaska and Arctic Networks. While no strong trends of change have been detected in southwest Alaska for 2001–2010, NDVI values for late June steadily increased from 1990–2009 in the Arctic Network.
This shift reflects an increase in plant biomass which is likely due to warming (Swanson 2010). This initial data serves as a baseline dataset and positions the I & M program to track and identify future changes in growing and winter season processes.
In addition to accomplishing the goals of the monitoring programs, this effort is now leading to new collaborations as scientists and agencies seek out the data made available by the efforts of NPS and Geographic Information Network of Alaska (GINA). The I & M program led and funded the effort to obtain data for NDVI and snow metrics, and as a result of their efforts, data for all of Alaska is now publicly available for the 2001-2011 period via the GINA.
Responses to Warming in Katmai and Lake Clark
Regional warming over the last several decades is thought to have contributed to widespread mortality in spruce forests of southwest Alaska, but also to oftenenhanced growth in trees at the western forest-tundra ecotone (Beck et al. 2011).
As part of the vegetation composition and structure vital sign monitoring program in the Southwest Alaska Network, NPS staff and collaborators at Humboldt State University are using tree-ring and plot-level data to better understand stand tree growth-climate interactions in white spruce woodlands. Forest monitoring plots located in low-elevation, open spruce stands are arrayed across a 300-km north-south transect that spans Lake Clark and Katmai National Parks and Preserves.
All trees analyzed to date have shown increased growth in the last 10-30 years. Trees in the northernmost sites show the earliest response to warming with increases in growth appearing a decade or more ahead of trees in plots at the southern end of the transect.
The positive growth of white spruce in response to warming in this area contrasts with the decreases in growth often seen in drought-stressed trees in interior Alaska. While the project is ongoing, field work on tree growth responses concluded in 2013. Final analysis, including comparisons of growth patterns to climate data, is scheduled for completion in early 2014.
Enhanced Monitoring Efforts Assess Impacts of Climate Change
In 2010, the National Park Service adopted the Climate Change Response Strategy. The strategy lists science as one of the four platforms by which NPS will respond to climate change, and under that platform it states that NPS will “inventory and monitor key attributes of the natural systems… likely to be affected by climate hange.” Using funds associated with the adoption of the Strategy, the Alaska I & M program funded four initiatives addressing information needs for several existing vital signs. These initiatives have enhanced existing efforts and position the I & M Program to assess future changes using the newly obtained baseline data.
Glaciers in Alaska’s National Parks
It’s no secret that the iconic glaciers of Alaska are vulnerable to climate change. However, until now no comprehensive inventory of the status and trends of all glaciers in Alaska’s national parks has been conducted. The glacier inventory, a three-year project by partners at the University of Alaska Fairbanks and Alaska Pacific University, is nearing completion. Detailed surface elevation profiles and extent maps have been developed for all glaciers. For those with multiple data sets, changes in extent have been quantified. In addition, estimates of change in total volume have been made for some glaciers (Arendt et al. 2012). Progress reports are currently available via IRMA (Integrated Resources Management Applications Data Store).
By the close of 2013, a final report as well as an additional interpretive report of 20 focus glaciers will also be available (see Loso in this issue). Data from this project will become part of a global glacier inventory housed and distributed by Global Land Ice Measurements from Space (GLIIMS). Investigators working on the NPS glacier project developed the data sharing model that has now been adopted by GLIMS and applied to the broader global inventory of glaciers. This extensive dataset not only tells us how the glaciers have changed over the last fifty years or so, but also positions us with the information needed to track future changes.
Permafrost in Central Alaska
Roughly 80% of Alaska is underlain by permafrost— ground that is permanently frozen. As the climate warms, permafrost is expected to melt. As it melts, it will change the landscape. To gain a more complete understanding of current permafrost conditions in Alaska’s national parks and to predict future conditions, several projects were initiated with enhanced climate change monitoring funds.
The first project, conducted by partners at the University of Alaska Fairbanks, uses existing NPS soils and landcover inventory data as well as NPS weather data as inputs to develop maps of current permafrost conditions and to model future conditions in all parks (Romanovsky et al. 2012). This project will produce maps of current and likely future permafrost conditions for all parks in the Arctic and Central Alaska Networks. Phase one of this project is scheduled for completion in 2014.
To expand upon the work previously done in the Arctic Network parks, two additional projects were funded in Yukon-Charley Rivers and Wrangell-St. Elias. Permafrost related features were inventoried and mapped in specific areas within the park units (Wells 2013a and 2013b). The projects in Yukon-Charley and Wrangell-St. Elias both focus on areas of importance to the parks and will serve as management tools for future action.
Monitoring Phenology on the Ground
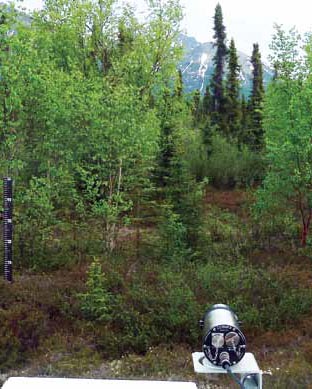
To supplement and ground truth the MODIS satellite data being used to track seasonal processes, several timelapse cameras were purchased with enhanced climate change monitoring funds. While satellite imagery provides information on a landscape-scale, the cameras provide more localized information, showing additional details such as breaks in snow cover during a winter season.
The cameras are mounted to existing climate monitoring stations in Katmai, Lake Clark, and Kenai Fjords National Parks. Six additional cameras are mounted to climate stations in the Central Alaska and Arctic Network. Several images are captured daily from early spring to late fall. The daily images from cameras are then analyzed to estimate the timing of green-up (start of the growing season) and leaf-fall (end of the growing season) at each site.
Imagery collected by the cameras is shared with the National Phenocam Network. The images from the time-lapse cameras in southwest Alaska align with the satellite imagery confirming the validity of remote sensing techniques for detecting green up at large spatial scales.
Conclusion
One of the core purposes of the Inventory and Monitoring Program is to track the status and trends in the condition of natural resources in our national parks. In Alaska, the I & M program is transitioning from design and data collection to a phase that also includes delivery of results.
Knowing the status and trends in the condition of natural resources serves as the foundation from which management decisions are made and the public is informed. As the impacts of climate change become more visible and recordable, this foundation of knowledge becomes increasingly important.
Part of a series of articles titled Alaska Park Science - Volume 12 Issue 2: Climate Change in Alaska's National Parks.
Last updated: August 7, 2015
