Last updated: August 30, 2022
Article
2022 Harbor Seal Monitoring Updates
Harbor seals live a dual life, spending half their time on land and the other half in the ocean. This duality means they have to avoid both terrestrial and oceanic predators. In recent years, the harbor seals in Marin County have been dealing with more interactions from coyotes. Biologists monitoring the seals in 2022 continued to see this issue.

Sue Van Der Wal / NPS Volunteer
In the spring months, National Park Service staff and volunteers from the Harbor Seal Monitoring Program monitor the seals during the breeding season. Then over the summer, we monitor them during their molt season—when the seals are onshore for extended amounts of time shedding their fur and growing a new layer. The first site where we began seeing coyotes more regularly was Double Point about five years ago. At the same time, we saw a decline in the number of seals hauling out at that location. Then in 2021, we saw multiple coyotes regularly at Drakes Estero and the number of seals there also dropped dramatically. Again, in 2022, we recorded low numbers of seals hauling out in Drakes Estero and Double Point.
Breeding Season Summary
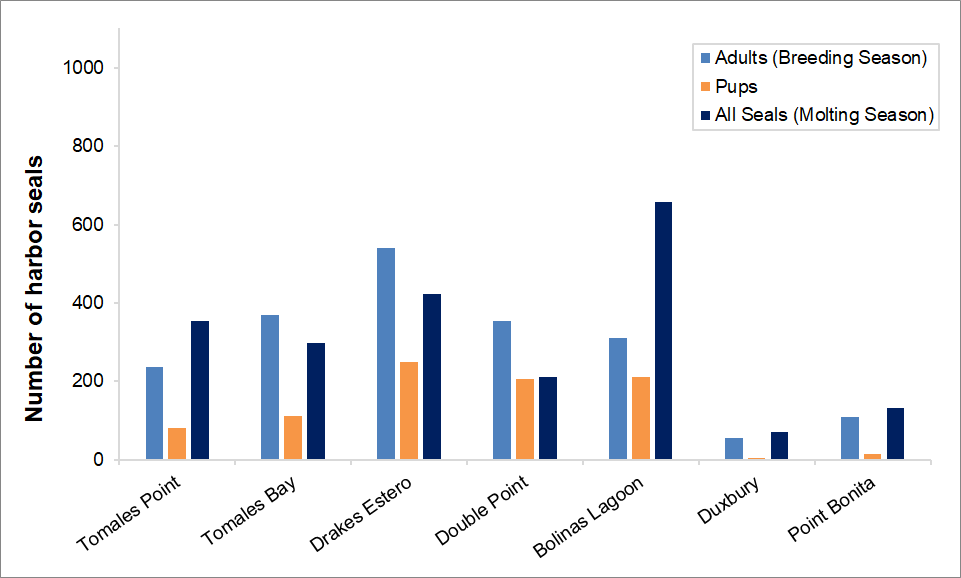
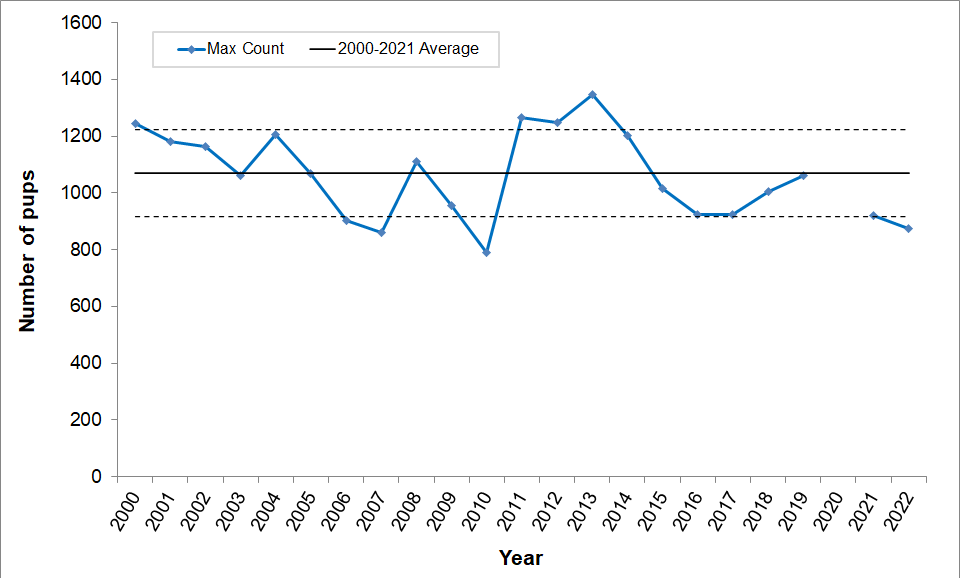
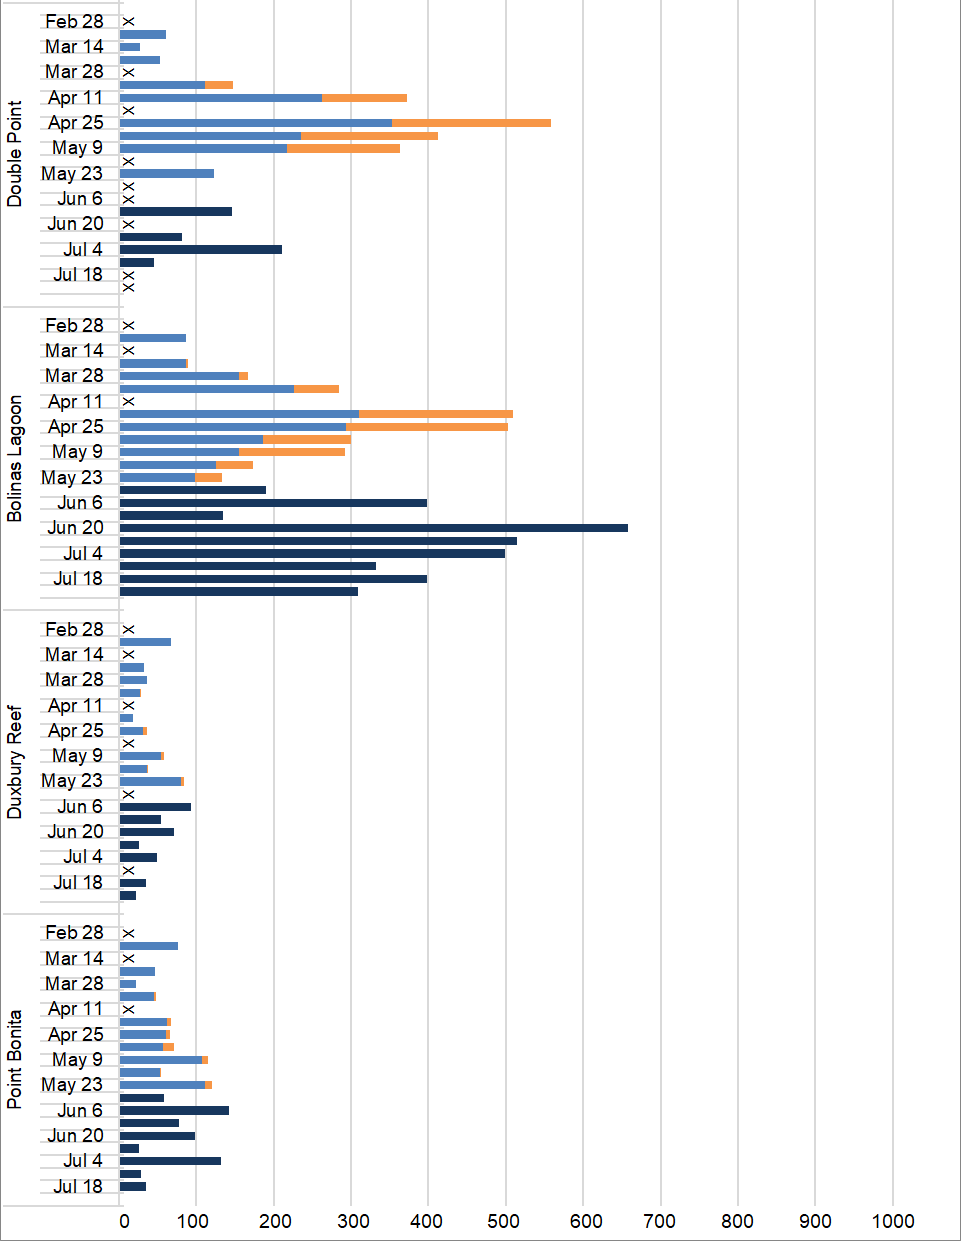
The total number of pups recorded during the breeding season in Marin County this year was 876. While this is one of the lowest counts on record for the monitoring program, we normally see cycles of high and low counts during the breeding season. Our long-term data show that harbor seal reproductive success overall is fairly stable. The next few years will show us if the numbers bounce back up or if we see a continued decline. All monitoring locations had lower than average counts this year except Bolinas Lagoon—which has had higher than average counts for the past few years—and Point Bonita in the Marin Headlands, which is a small pupping site.
Molting Season Summary
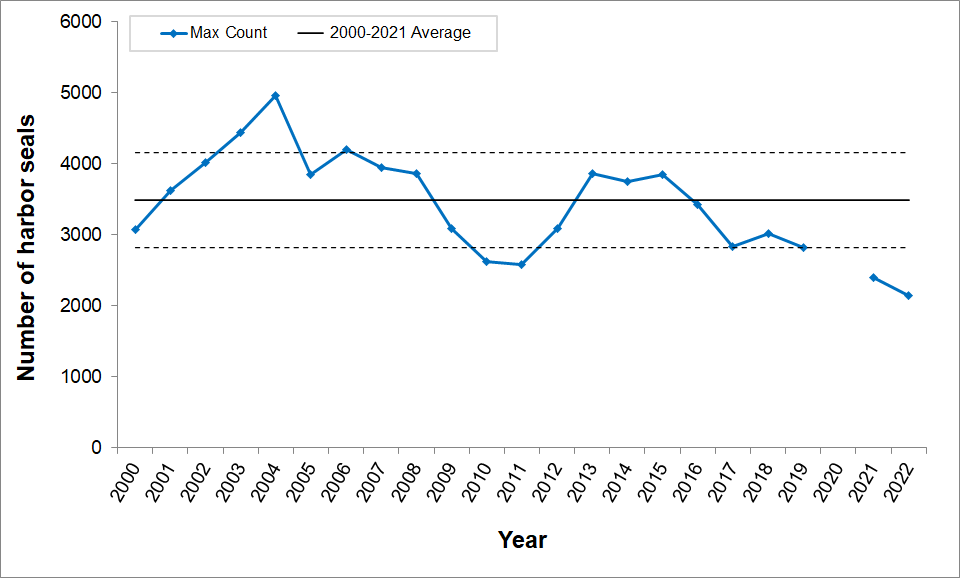
The total number of seals recorded during the molt season in Marin County this year was 2,149. This is far below the long-term average of 3,490 seals and is the lowest count ever recorded for the monitoring program. This decline has been ongoing for many years. Drakes Estero and Double Point saw dramatically low counts with this year's counts being more than 50% below their respective long-term averages. Bolinas Lagoon was the only site to have a higher-than-average count during the molt season. This location has become a very important site for Marin's harbor seals. Unfortunately, a coyote was seen at this harbor seal colony at the end of the molt season, and it killed a seal. We will have to see next year if coyotes become a regular occurrence at the Bolinas Lagoon harbor seal sites and affect how the seals use that area.
A special thank you to the Marin County Parks Natural Resources staff for assisting with harbor seal monitoring at Bolinas Lagoon this year. We hope this becomes a permanent collaboration between the two agencies.
Preliminary Data
2022 Maximum Harbor Seal Count By Site
Maximum Harbor Seal Pup Counts, 2000-2022
Maximum Harbor Seal Molt Counts, 2000-2022
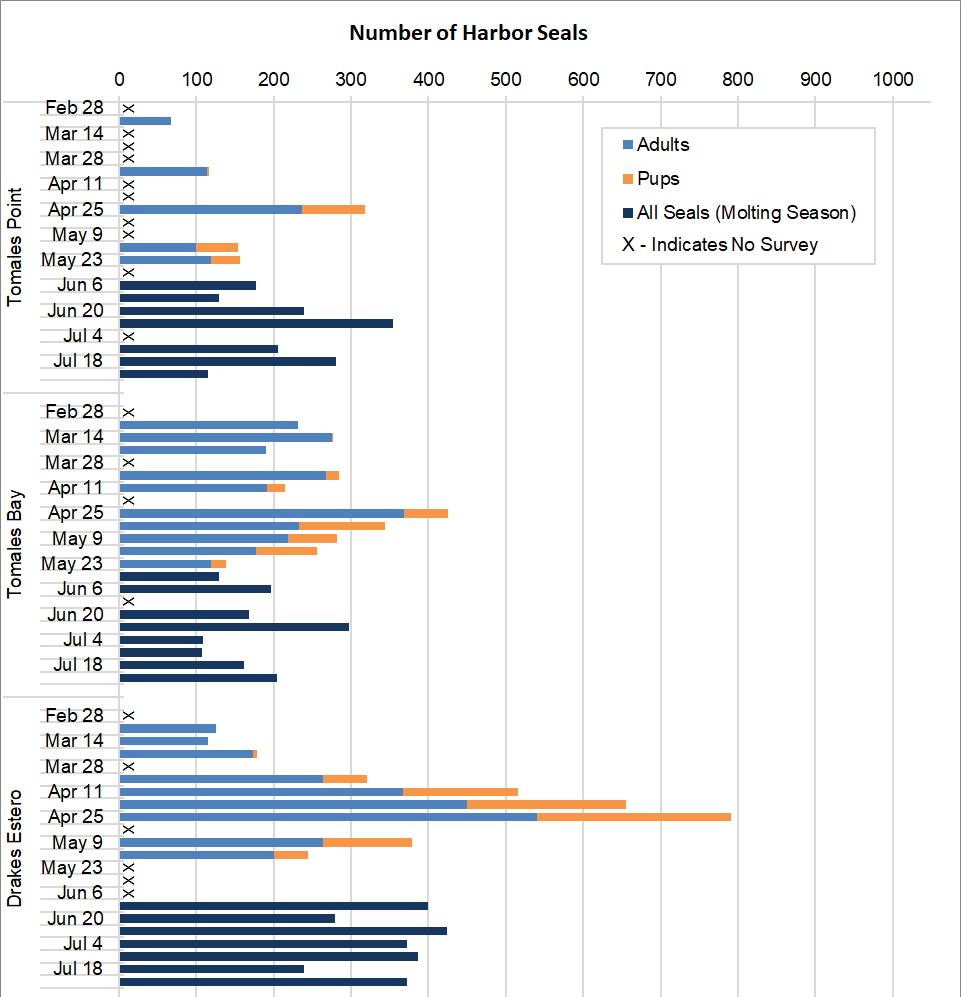
The Details: 2022 Weekly Maximum Harbor Seal Counts By Site
For More Information
Contact
Webpages
San Francisco Bay Area Network - Pinniped Monitoring
Pacific Coast Science and Learning Center - Harbor Seals
The National Park Service shall not be held liable for improper or incorrect use of the data described and/or contained herein. These data and related graphics are not legal documents and are not intended to be used as such. The information contained in these data is dynamic and may change over time. The data are not better than the original sources from which they were derived. It is the responsibility of the data user to use the data appropriately and consistent within the limitations of geospatial data in general and these data in particular. The related graphics are intended to aid the data user in acquiring relevant data; it is not appropriate to use the related graphics as data. The National Park Service gives no warranty, expressed or implied, as to the accuracy, reliability, or completeness of these data. It is strongly recommended that these data are directly acquired from an NPS server and not indirectly through other sources which may have changed the data in some way. Although these data have been processed successfully on computer systems at the National Park Service, no warranty expressed or implied is made regarding the utility of the data on other systems for general or scientific purposes, nor shall the act of distribution constitute any such warranty. This disclaimer applies both to individual use of the data and aggregate use with other data. The National Park Service requests that the data user refrain from publishing these data and related graphics and wait until data is available in official, published reports.
