
Photo by Ken & Mary Campbell (c) Program Overview and Results of the 2015 Field SeasonThis was our sixth full year of the Olympic Marmot Monitoring Program, and the fourth year adding lands on Olympic National Forest. With the addition of USFS lands the program now encompasses the entire range of the species – pretty sobering. 2015 will be our last year for a while, as we are going to take a pause for one to two years to analyze the data and evaluate if we need to make any changes to the program. Because of that, we had a big push this year to get as many areas surveyed as possible. In 2015 we had 96 volunteers in 35 groups participate in the program: a total of 4,162 volunteer hours donated. Volunteer training was held on four Wednesdays in the months of August and September. In addition, several NPS staff helped out by surveying in hard to reach places. Following training, surveyors spent from 1-8 days in a variety of areas of the Park and Forest, ranging from the front-country on Hurricane Hill to deep in the park on Skyline Ridge. Surveyors in all regions traversed high-elevation meadows and rock fields looking for and documenting sign of marmots and marmot burrows. In 2015 the Olympics experienced an unprecedented drought; the late season snowpack was nonexistent and consequently access was not limited by snowfields. Volunteers surveyed for marmots in 319 survey units located in 61 habitat clusters. Surveyors were able to completely survey 299 units and partially survey 20 others (Figure 2).

NPS 
Of the units that were completely surveyed in the core clusters in the Park (45 clusters that we try to survey every year), 47% were found to be occupied by marmots, 27.5% were abandoned (surveyors saw past but not recent sign of marmot use) and 25.5% had no sign of marmots.The rate of occupancy has varied between 53 and 47 % during the 6 years of the survey (Figure 3).When all units were combined, the overall marmot occupancy rate in the park was 46% (Fig 2) USFS Sites: In 2015 we were not able to survey in the Mt. Townsend and Silver Lakes areas, but we did get complete coverage of the Buckhorn, Marmot Pass and Copper Creek area. Volunteers were able to completely survey 13 units and partially survey 3. Of the 13 units that were completely surveyed in 2015, only 2 (15%) were definitely occupied by marmots (Fig 4), but 2 of the incomplete surveys indicated that marmots may have been present.
Acknowledgements

Olympic Marmots
Learn more about the Olympic Marmot. 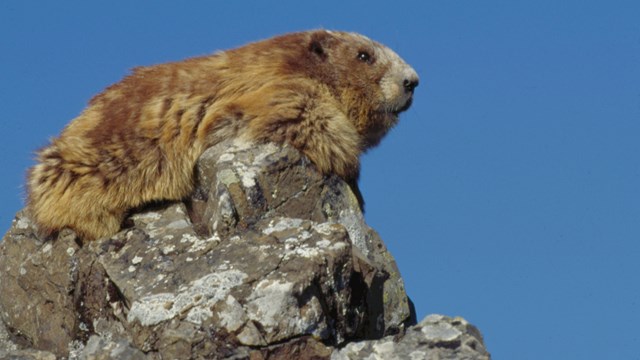
Marmot Monitoring Volunteers
Teams of volunteers hike to locations within Olympic National Park to record up-to-date information about the Olympic Marmot. 
Marmot Research, Reports, and Links
Learn more about the research on Olympic Marmots. |
Last updated: July 18, 2024