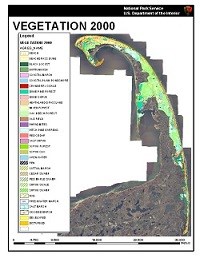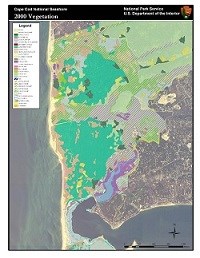
One of the goals of the National Park Service's Inventory and Monitoring Program is to provide the information and expertise needed by park managers for effective, long-term management of the natural resources held in trust. Understanding the vegetation communities found in a park provides an important baseline for sound natural resource stewardship and management. 2008 marked the completion of a vegetation map created for Cape Cod National Seashore from photo interpretation of 2000 aerial photography. Areas of relatively homogeneous plant species composition and structure that occur in a uniform habitat were grouped together as communities. Field surveys were carried out to determine accuracy of these interpretations. In the final vegetation map, twelve plant community classes are mapped individually and fifty-eight communities are aggregated into seventeen additional classes. Some of the classes were aggregated to improve the accuracy of the final product. There are also several non-vegetative cover classes. The completed vegetation map consists of twenty-eight classes. A table listing all classes and showing their total area (in hectares) and total percent cover is provided below.

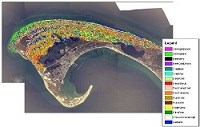
The project was carried out in partnership with NatureServe, a non-profit organization specializing in assisting science-led conservation efforts. The US National Vegetation Classification (USNVC) system was used to establish a standardized and compatible approach to identifying plant communities for this project. Subtle differences in soil, elevation, and hydrology affect what plant community will occur in a given area. The checkered but intensive land use history of the Outer Cape is another factor that plays a significant role in the distribution of community types. Fourteen vegetation associations occurring within Cape Cod National Seashore are considered globally rare by USNVC standards, highlighting the conservation value of lands within the park. The completed vegetation map serves as a powerful tool for scientists and resource managers. The map will serve as baseline information giving those charged with land stewardship a greater understanding of how the Seashore's vegetation communities are changing over time. This is an important factor in ensuring the obtainment of management goals related to native and non-native species composition, disturbance (for example deer browse and fire), and issues related to succession. Also, by identifying the distribution of plant communities across the landscape, one can harness a better understanding of the association of other organisms (for example wildlife) across the same landscape. In addition to the 2000 park-wide vegetation map, researchers from the University of Massachusetts, Amherst have developed a fine-scale remote sensing map of an area of the Seashore known as the Province Lands. The Province Lands represent the post-glacial extent of the Outer Cape consisting of predominantly sand and gravel surficial geology. The maritime dune communities that persist in this region of the park are home to a number of species of conservation concern. Using satellite imagery as its data source, the map cues into the unique spectral signal reflected by different plant species and species assemblages. By programming a range of spectral values for the different assemblages found in this landscape, researchers can identify and assign cover classes to an entire imagery data set at a very fine resolution. In some cases the cover classes can be assigned to the species level with a very high degree of accuracy. The development of the map represents the next step forward in vegetation mapping technology. Currently, the Seashore is considering the development of similar maps for regions outside of the Province Lands. 

|
Last updated: May 24, 2018
