Last updated: May 7, 2018
Article
Water Quality Monitoring in the San Francisco Bay Area

NPS / Mason Cummings

Why Is Water Quality Important?
Freshwater quality affects people’s enjoyment of San Francisco Bay Area national park resources, and plays a direct role in the health of aquatic habitats. It also affects the plants and animals that depend on these habitats, including threatened and endangered species like California freshwater shrimp, coho salmon, steelhead trout, and the California red-legged frog.
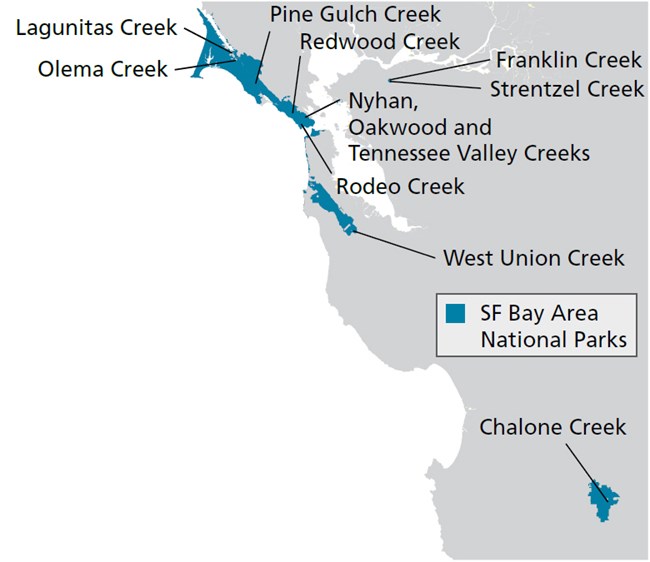
In 2006, the National Park Service began monitoring freshwater quality under a long-term monitoring plan developed for the Golden Gate National Recreation Area, John Muir National Historic Site, Muir Woods National Monument, Pinnacles National Park, and Point Reyes National Seashore.
Why Do We Monitor Water Quality?
- To determine the range, variability, and trends in water quality parameters (water temperature, pH, conductivity, dissolved oxygen, turbidity, nitrate, total Kjeldahl nitrogen, and pathogenic indicator bacteria) for priority streams
- To learn the extent to which priority bodies of water in the parks meet federal and state water quality standards
How Do We Use the Monitoring Data?
- To establish a baseline to use when detecting and assessing the effects of specific instances of contamination or erosion
- To guide and evaluate projects to improve water resources, such as the restoration of Redwood Creek

NPS / Katie Wallitner
What Have We Learned?
For More Information:
Water Quality Specialist
Katie Wallitner
Links
San Francisco Bay Area Inventory & Monitoring Network
Pacific Coast Science & Learning Center
Summary by Katie Wallitner and Jessica Weinberg McClosky, September 2014.
Download PDF from the NPS Data Store
