Last updated: May 7, 2020
Article
Monitoring Seismic Activity
Department of Earth and Atmospheric Science, Purdue University, West Lafayette, Indiana 47907-2051, USA
Braile, L.W., 2009, Seismic monitoring, in Young, R., and Norby, L., Geological Monitoring: Boulder, Colorado, Geological Society of America, p. 229–244, doi: 10.1130/2009.monitoring(10). For permission to copy, contact editing@geosociety.org. ©2009 The Geological Society of America. All rights reserved.
Introduction to Seismic Monitoring
Relevance and Rationale for Monitoring
Although earthquakes happen frequently in many parts of the world, any occurrence of a moderate to large event is sudden and unexpected. Thus, the earthquake process can be interesting and even frightening to people. Most earthquakes are associated with natural, dynamic processes that shape Earth’s landscape. The vast majority of earthquakes are caused by sudden slip along faults, resulting in seismic waves that shake the ground, often with sufficient force to damage structures or trigger other events, such as landslides. When significant earthquakes occur anywhere in the world, such as the December 2004 tsunami-generating event in Indonesia that killed more than 200,000 people, or the October 2005 earthquake in Pakistan that killed more than 70,000 people, emergency response and relief efforts come from around the globe, and there is renewed interest in understanding the causes and in mitigating the devastating effects of earthquakes.
Earthquakes can be significant hazards, as evidenced by occasional damaging and deadly events. Individuals, governments, and organizations can respond to the hazard by understanding the probability and the likely effects of significant events; preparing emergency response plans; enhancing public knowledge about what to do in case of an earthquake; and taking specific steps (such as reinforcing critical or weak structures) to reduce the risk of earthquakes.
Earthquakes and Seismic Monitoring
Earthquakes are often defined as ground vibrations related to a release of elastic energy, or as the sudden slip of a section of a fault plane, releasing stored elastic energy; the latter is the most common source of significant ground vibrations. The release of elastic energy associated with earthquakes generates seismic waves that propagate through the Earth and along the Earth’s surface across large distances. Most earthquakes are the result of plate tectonic processes. The Earth’s plates are moving at speeds of centimeters per year, which produces deformation at plate boundaries. Due to friction on fault surfaces, faults that make up the plate boundaries generally do not slip continuously. As the plates move, rocks are progressively deformed (strained) along the plate boundaries (often over many years or decades), thus storing elastic energy. When the resulting stress on a segment of a fault plane increases beyond a critical threshold, the fault segment slips, creating an earthquake from the release of stored elastic energy. This process is called elastic rebound and was discovered after the 1906 San Francisco earthquake by H.F. Reid (1910) a half century before the development of plate tectonic theory.
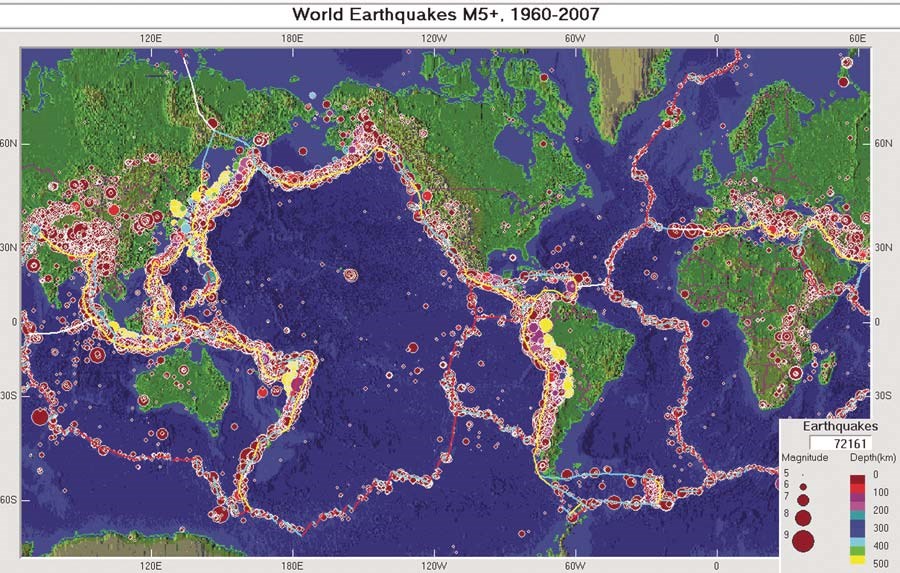
The vast majority of earthquakes occur along plate boundaries (Fig. 1) as explained above; this process is best explained by the theory of plate tectonics (Kearey and Vine, 1996). Some earthquakes occur in plate boundary or intraplate regions associated with other dynamic geologic processes such as volcanic and hydrothermal activity, reactivation of ancient faults, or crustal loading (e.g., topographic loads on the crust such as mountain ranges, water loading due to filling of a reservoir). Some earthquakes are caused by human activity related to filling of reservoirs, detonation of explosions, or injection of fluids into the ground. The dynamic geologic processes that result in earthquakes also create topographic relief and interesting and beautiful landscapes. Many national parks are located in geologically interesting areas that include earthquakes or previous plate tectonic activity.
Many visitors to our national parks are interested in how the features within the park came to be. Thus, the geologic and seismic attractions of the park present an opportunity for public involvement, education, and outreach. Geologic and earthquake displays, brochures, and other information can be used to effectively communicate interesting and important facts and concepts to park visitors. A computer monitor displaying local or relevant earthquake activity and one or more educational seismographs increase interest and enhance the effectiveness of the education and outreach effort. If there is sufficient interest or need because of significant hazard, a more extensive seismic monitoring effort involving a local network of research-quality seismographs may be justified.
CAUSES OF EARTHQUAKES AND TIME VARIATIONS IN EARTHQUAKE ACTIVITY
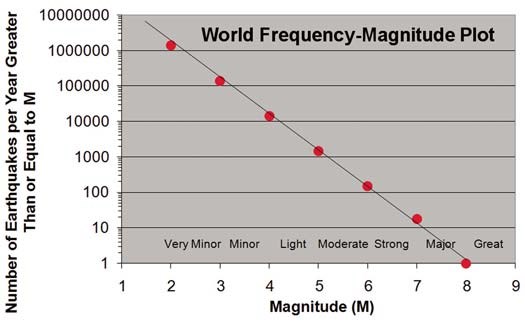
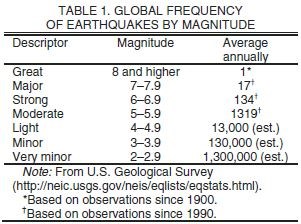
In any given seismic source area, earthquake activity often consists of relatively well-defined “sequences,” such as mainshock/aftershocks; foreshock/mainshock/aftershocks; pairs or triplets of significant events; swarms; or long-term, random time distributions that can result in two or more closely spaced significant events, with long periods between such events. Despite some successes and considerable interest and efforts in earthquake prediction, there currently is no consistently reliable method for predicting earthquakes, so significant events occur suddenly and without warning. However, areas of potentially significant earthquake activity are well known, and statistical analysis of past events, including the frequency-magnitude relation, provides valuable estimates of future activity and earthquake hazards.
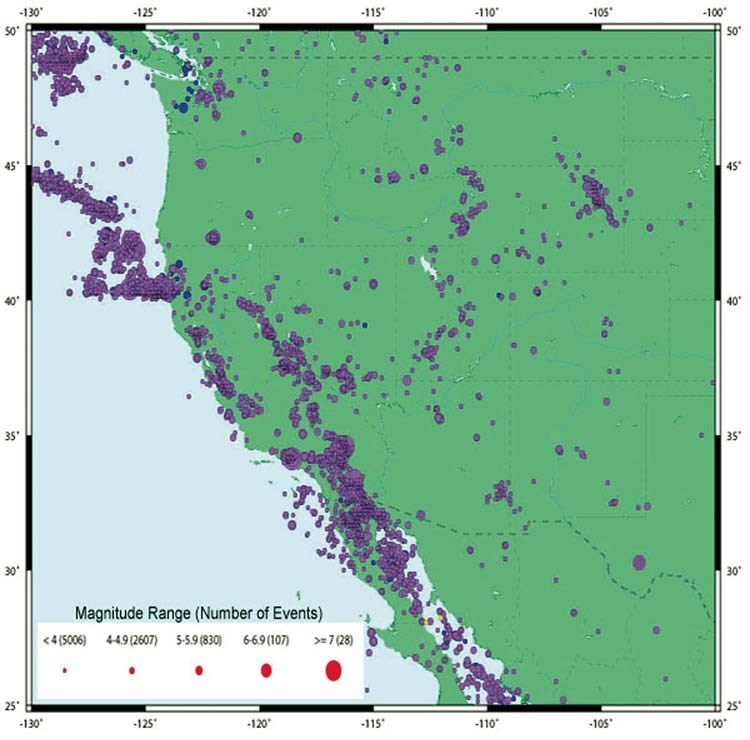
Seismic monitoring utilizes sensitive seismographs to record the ground motion from seismic waves created by earthquakes or other sources. Seismograms from seismic monitoring stations can be used to determine the location, origin time, and magnitude (as well as other characteristics) of earthquakes. The detection ability of a seismograph or network of seismographs is dependent upon the type of instruments, the availability of accurate timing, the number and locations of stations relative to the earthquake location, the size of the earthquake, and the ambient ground vibration noise level.
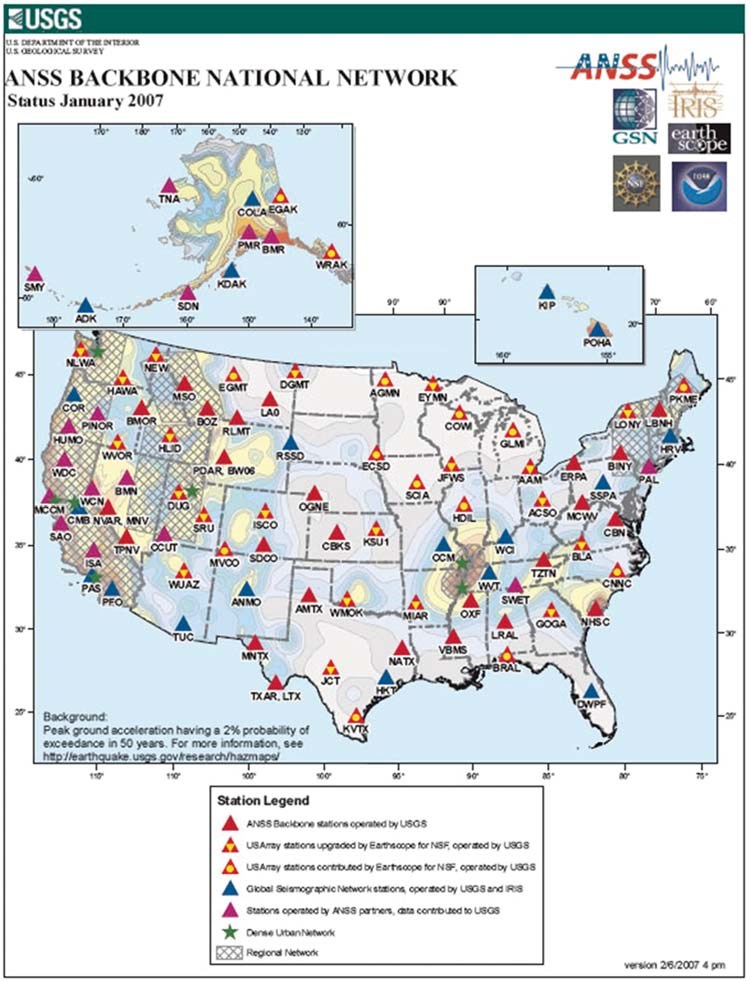
An excellent description of seismic monitoring is contained in the U.S. Geological Survey Circular 1188 (1999), available at http://pubs.usgs.gov/circ/1999/c1188/circular.pdf. Circular 1188 describes the basic concepts of seismic monitoring (section 2), outlines plans for a modern national seismograph network, the Advanced National Seismic System (ANSS), and describes the major benefits and uses of seismic monitoring. These benefits and uses include: earthquake emergency management, warnings of volcanic eruptions, warnings of earthquake-generated tsunamis, seismic hazard assessment, earthquake engineering, seismology research, public information, and education. Seismic monitoring is also described in Earthquake Monitoring: Then and Now, available at http://earthquake.usgs.gov/learning/eqmonitoring/eq-mon-6.php, and in Ansell and Taber (1996), Stein and Wysession (2003), and Bolt (2004). Further information on seismology, earthquakes and earthquake hazards can be found in Abbott (2006), Bolt (1993, 2004), Bolt et al. (1977), Bryant (1992), Hough (2002), Keller and Blodgett (2006), Kovach (1995), Shearer (1999), Stein and Wysession (2003), and Yeats et al. (1997).
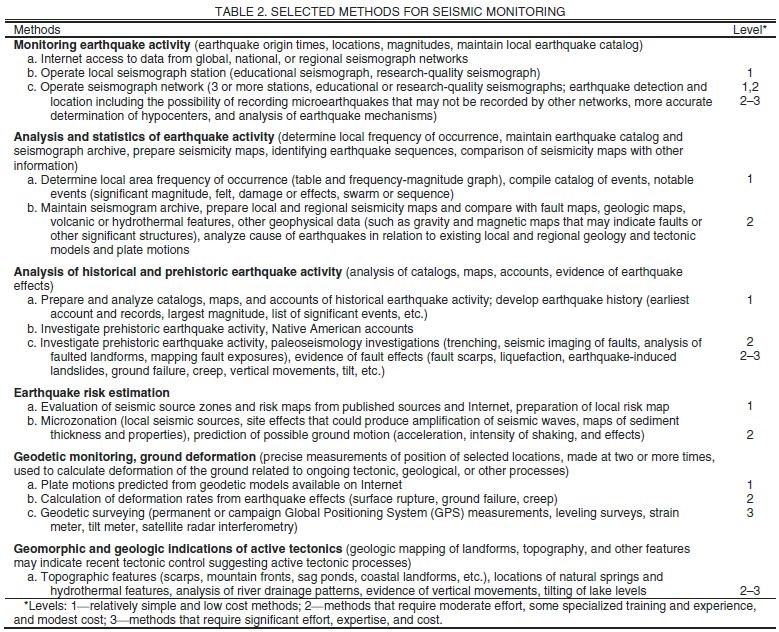
Two vital signs related to seismic monitoring are earthquake activity and deformation and active tectonics. Earthquake activity can be monitored using seismographs; historical data can be used to identify fault zones and other likely sources of future events, and to assess earthquake hazards. Deformation and active tectonics is related to earthquake activity and generally involves mapping and surveying fault scarps or other geomorphic features, and measuring long-term ground deformation using very accurate but traditional survey techniques or GPS (Global Positioning System) monitoring. Selected methods for seismic monitoring of these vital signs are listed in Table 2. This section briefly describes each of these methods, shows some examples of their use, and provides some references for further information or examples of each.
Earthquake Activity
Monitoring Earthquake Activity
Earthquakes are recorded by seismographs. Because many seismograph stations operate around the world and automatically send their data to central locations for routine analysis, a large amount of information about earthquake activity is rapidly available online. The IRIS Seismic Monitor (http://www.iris.edu/seismon/) and the USGS earthquake site (http://earthquake.usgs.gov) are convenient sources of current earthquake lists and maps for global and regional areas. These sites also link to others with near-real-time seismograms. For more local areas, data from regional networks (accessible from http://earthquake.usgs.gov and http://earthquake.usgs.gov/regional/) are also available. Earthquake information from these locations can be easily compiled into local earthquake catalogs, maps for statistical and spatial analysis, or other purposes. Regional and local maps can be created online from the USGS earthquake catalog using the IRIS Event Search and USGS Catalog Search tools. Earthquake information for local to global areas can also be viewed and analyzed using the Seismic/Eruption software (http://bingweb.binghamton.edu/~ajones/) that includes an extensive earthquake catalog. Specialized earthquake data sets can also be imported into the Seismic/Eruption software, as illustrated in Figure 6.
For relatively little cost and effort, one can now install and operate a seismograph at any location to record small (or large) local and regional events, as well as large earthquakes from anywhere in the world. The real-time seismograph display can be linked to additional earthquake information such as a list of significant earthquakes in the area, earthquake history, seismicity maps, and other information online. The seismograph display also provides an excellent opportunity for an education and outreach program in earthquakes, seismology, tectonics and related earth science. An inexpensive and easy-to-operate seismograph for this purpose is the AS-1 seismograph (http://web.ics.purdue.edu/~braile/indexlinks/as1.htm), which is usually described as an educational seismograph, but can very effectively record earthquakes. Another excellent option is the PEPP-V seismograph (http://www.indiana.edu/~pepp/). Other commercial seismographs can also be utilized for a local seismograph station. A guide to installing a seismograph can be found at http://pubs.usgs.gov/of/2002/ofr-02-0144/ofr-02-0144.pdf. A local college or university or geological survey office may be available to provide assistance with seismograph installation or data distribution.
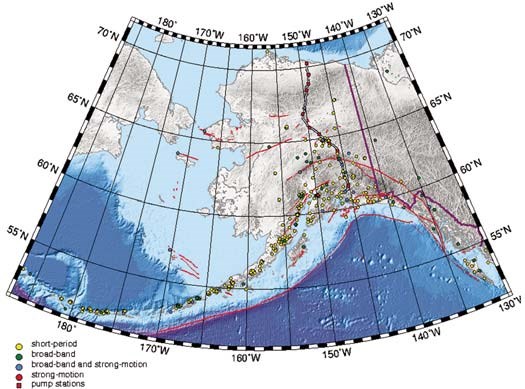
If three or more seismographs are installed in a local area, or a more extensive seismic network established, earthquake locations for local events can be determined from these local stations. These hypocenter determinations are potentially more accurate (depending on the characteristics of the local network and the proximity to stations in established networks) and it may be possible to detect more and smaller events that can be used to better delineate seismic source zones. Earthquake seismograms can also be used to determine principal stress directions and infer the type of faulting (normal, reverse or thrust, strike-slip). For a description of techniques for determining earthquake mechanisms (sometimes referred to as fault plane solutions), see Stein and Wysession, (2003, chapter 4). Earthquake mechanism studies have been very important in tectonic interpretations.

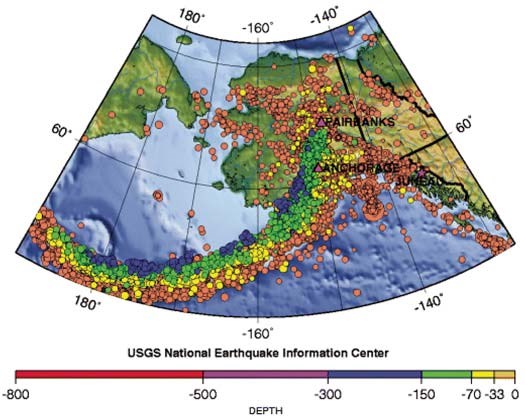
The M7.9 mainshock epicenter (large dot) and the 23 October 2002 M6.7 foreshock epicenter (smaller dot to the west of the mainshock epicenter) have been highlighted in this view. Most of the other epicenters visible on the map are aftershocks.
Analysis and Statistics of Earthquake Activity
Earthquake data for a local area from a local seismograph network, or online data from regional or global networks can be analyzed at very low cost and effort. Analysis can determine frequency of occurrences, including a frequency-magnitude diagram, an earthquake catalog, and a list of notable earthquakes.
If a local seismograph or network is available, one can also maintain a catalog of recorded events and an archive of seismograms. With a little extra effort, seismicity maps of the local area can be prepared (see method 1, above) and compared with fault maps and other geological and geophysical maps for tectonic interpretation. An online tool for accessing Quaternary fault maps for many areas of the United States is available at http://earthquake.usgs.gov/regional/qfaults/. The earthquake activity and tectonic interpretations for local areas can be compared with predicted plate motions from global plate motion models at http://sps.unavco.org/crustal_motion/dxdt/nnrcalc/.
Analysis of Historical and Prehistoric Earthquake Activity
Historical earthquake activity is an interesting characteristic of many areas that can be used to assess future earthquake probabilities and hazards, and to relate to local geological features. In some cases, prehistoric earthquake records may be accessible, which can extend the record of earthquake activity.
For most areas, it is relatively easy to compile a record of historical earthquake activity online. Earthquake catalog searches (described above) can be used to obtain hypocenter, origin time, and magnitude information for any local area. These data are reasonably complete and accurate back to 1973, and generally good even back to 1960. There are also global data files of significant events for the past 2000 or more years. The older earthquake information is much less complete, relies on non-instrumental estimates of magnitude (using felt reports, where available), and usually includes only larger events. Several historically significant publications on U.S. earthquakes and earthquake histories of each state can also be found on the USGS earthquake site. Several, older significant events (such as the 1811–1812 New Madrid earthquakes, the 1906 San Francisco earthquake, the 1959 Hebgen Lake earthquake, and the 1964 Alaska earthquake) have one or more publications in journals that focus on the specific event and previous earthquake history. Maps of historical earthquake data can be produced using the online tools in the USGS catalog search and using the Seismic/Eruption software (or other available mapping programs, such as geographic information system [GIS] software or Google Earth); the data is imported into the program with the desired area and time window. Instructions for using the Seismic/Eruption program for such purposes are available in the program help files and online at http://web.ics.purdue.edu/~braile/edumod/svintro/svintro.htm.
Prehistoric earthquake information can often be obtained from specific geological studies of earthquake effects. These include studies of fault scarps, trenching fault exposures to reveal ancient fault offsets that can sometimes be dated, using leveling or other survey techniques to identify deformed surfaces or landforms that may have been produced by earthquake movements, and using geophysical studies of a fault zone to determine
its rupture history. These studies are often called paleoseismology and usually require extensive and very detailed field studies by experienced personnel. However, paleoseismology offers the potential to identify the most significant events in the recent past and therefore signifi cantly improve the earthquake record, particularly the frequency of occurrence of the largest events in a local area. Further information on paleoseismology and the methods mentioned here are in Yeats et al. (1997) and Keller and Pinter (2002).
Earthquake Risk Estimation
Earthquake risk is usually evaluated using the historical seismicity record that provides information on the probability of occurrence (such as the frequency-magnitude relation for the area) of earthquakes of various magnitudes, and sometimes, an estimate of the maximum magnitude earthquake that is likely to occur. Estimates of maximum magnitude can also utilize the prehistoric record and an evaluation of the faults in the area, especially the length and depth extent of relatively continuous faults. When detailed information about near-surface geology is available, the risk estimation may also include estimations of ground motion and of anticipated effects on buildings, roads, and other structures.
Detailed earthquake hazard maps have been prepared for the United States and most of the world. The USGS has a very useful site (http://earthquake.usgs.gov/research/hazmaps/) that has links to these maps and other information about earthquake hazards. This site also contains an earthquake hazard mapping tool. A latitude and longitude range (within the United States) can be entered, and the tool will prepare a hazard map for that area. The hazard maps are usually displayed as contour diagrams with the Peak Ground Acceleration (PGA) and the probability of its being exceeded in a specified time period (usually 50 years). With this tool, it is very easy to produce an earthquake risk map of any area in the United States.
If a more detailed and complete analysis of earthquake risk is desired for a specific area, it is possible to perform a hazard assessment involving analysis of local and regional seismicity (locations of seismic source zones, probabilities of occurrence of various magnitude events, estimation of the maximum likely magnitude, and detailed mapping of near-surface materials). However, a detailed risk assessment involves considerable effort and should be performed by experienced persons. Some local areas of the United States have already been specifically studied for earthquake risk; detailed maps for these areas are available at the USGS Web site listed above.
Deformation and Active Tectonics
Geodetic Monitoring, Ground Deformation
Geodetic monitoring is often performed to determine plate motions and current (active tectonic) ground deformation for a given area. There are a number of methods available for this purpose, including precise leveling and surveying, strain and tilt meter recording, detailed geologic mapping of active tectonic features, GPS (Global Positioning System) monitoring, and satellite techniques such as satellite laser ranging and satellite radar interferometry. Recently, GPS and satellite techniques have become very popular due to improved technology and computer processing capabilities. Effective application of these methods generally requires multiple observations over fairly long periods of time. A useful summary of these techniques and examples of applications can be found in Keller and Pinter (2002).
Information about potential ground deformation related to plate motions is available online at http://sps.unavco.org/crustal_motion/dxdt/nnrcalc/. This tool allows one to determine a crustal motion (velocity) estimate for any location; velocity is calculated from derived global or regional plate velocity models. Maps of global and regional GPS results can also be generated at the Jules Verne Voyager site at http://jules.unavco.org/Voyager/Earth.
Detailed mapping of fault offsets and other earthquake effects can be used to determine average deformation rates if accurate dating of events can be determined. However, such features may not be present, or it may not be possible to date the movements. Detailed mapping for determination of ground deformation involves significant effort and experienced persons. Additional information on these techniques and examples of their application can be found in Yeats et al. (1997) and Keller and Pinter (2002).
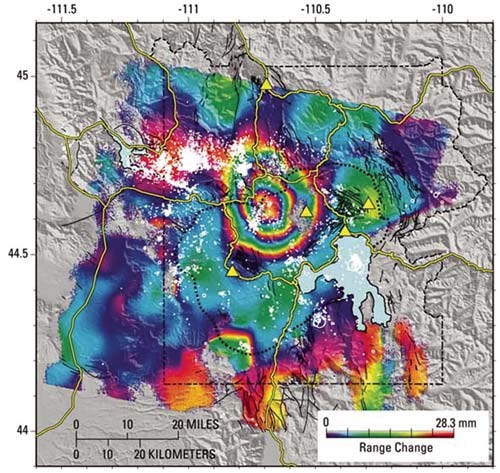
Geomorphic and Geologic Indications of Active Tectonics
Many geologic processes and landforms are affected by earthquakes and fault activity. Active faults often are visible as fault scarps, topographic breaks, and alignment of springs, lakes or sag ponds, and hydrothermal features. Faults also cause topography, such as in fault-bounded valleys, and produce uplift, subsidence and tilt, and control drainage patterns. Most of these features can be effectively identified and interpreted by detailed geological mapping. If the features are prominent, mapping and associated studies can be relatively straightforward. More subtle or complex effects require extensive study and a multidisciplinary approach, often involving geological interpretation, precise topographic surveying and leveling, collection and interpretation of geophysical data, and age dating. A useful summary of geomorphic and geological methods for study of fault zones, active tectonics, and related earthquake features is provided by Keller and Pinter (2002).
Summary and Recommendations for Seismic Monitoring
Seismic monitoring in and around national parks is used for earthquake, tectonic, and geological research, earthquake hazard assessment, and public education. With only a small effort, one can investigate the earthquake history and hazards of a national park and surrounding areas. In both active and inactive areas, an educational seismograph can be used to monitor local, regional, and global earthquake activity. An operating seismograph is always an attraction for park visitors. More extensive seismic monitoring and analysis of earthquake effects, tectonic activity and earthquake risk requires significant effort, costs and expertise, and may require installation of a seismograph network and other instrumentation.
A few national parks (Yellowstone, Grand Teton, Mount Rainier, Mount St. Helens, and Hawaii Volcano) have seismograph networks or are part of regional seismograph monitoring
networks. Parks in California, Nevada, Utah, Washington, Oregon, Alaska, and Puerto Rico are monitored by state and regional seismograph networks. A listing of regional seismograph operators and cooperators is available at http://earthquake.usgs.gov/research/topics.php?areaID=12, with additional information
about seismic monitoring and the earthquake activity in these regions. Seismographs operating in national parks in low seismicity areas are generally installed for educational purposes and can generate public interest from recording regional or global earthquake activity. Finally, a list of seismic monitoring methods not discussed in this chapter is given in Table 3.

In considering a plan for seismic monitoring of a national park (or other local area), the specific or unique features of the park, the level of the local earthquake and tectonic activity, and the goals should be evaluated. For example, some areas are very seismically active (or are adjacent to seismically active areas) and have prominent features (such as fault-related topography, volcanic activity, or springs and hydrothermal activity) related to earthquakes and active tectonics. In these areas, one should also consider the earthquake hazard and emergency management response objectives of seismic monitoring. Scientific research designed to better understand the earthquake activity and geological evolution of the area may also be important. Assistance in seismic monitoring design and objectives may be obtained from the USGS and academic researchers already in cooperation with a specific park. Additional geology and tectonic information on national parks can be found in Harris et al. (2004) and Lillie (2005).
Some areas may not display significant local earthquake activity but may still be selected for seismic monitoring because of visitor interest and educational objectives. As mentioned previously, seismic monitoring and a visible seismograph display can be very effective in generating visitor interest in park features and in the geology of the area, and can be used as a key element of an education program. In both seismically active and relatively inactive areas, at least one educational seismograph for earthquake monitoring and display is a very cost-effective approach to beginning (or augmenting) a seismic monitoring program.
Plans for a local seismic monitoring program must also include consideration of the cost of the program, and the resources and personnel available to be devoted to the effort. Several cost effective methods for seismic monitoring studies that do not require substantial personnel or experts to conduct the studies are listed in Table 2 and described above. Of course, more extensive and sophisticated seismic monitoring studies will require greater resources and usually will need to be performed by experienced persons or experts in the particular method selected.
The EarthScope program presents a unique opportunity for parks and other resources and organizations to be involved in earthquake and earth science education and research. Currently, EarthScope has deployed a large array of seismographs over a region in the western United States. The array will be progressively shifted to the east to provide coverage of the entire contiguous United States. The deployment is aimed at investigating the structure and evolution of the continent. The current status of the instrumentation deployment can be viewed at: http://www.earthscope.org/current_status/. In addition, an extensive array of GPS instruments is also being deployed, primarily in the western United States, to study the tectonics and deformation associated with the plate boundaries of that area. Temporary, portable arrays are also being utilized in research projects focused on specific geological features or areas. Data and results from these programs are available and can be used in association with local seismic monitoring and other geological and geophysical studies to enhance our knowledge of these areas and better educate the public. In some cases, it has been possible to deploy EarthScope instruments in national parks and to design specific experiments related to the earth science features in parks. Additional opportunities will exist as additional instruments are deployed and the seismograph array progresses across the United States. Further information on the EarthScope can be found at the EarthScope program Web site (http://www.earthscope.org/) and in Meltzer et al. (1999) and Meltzer (2003).

The data were then imported into the Seismic/Eruption program and displayed on the software's topographic relief map (topo30) using the "make your own map" tool.
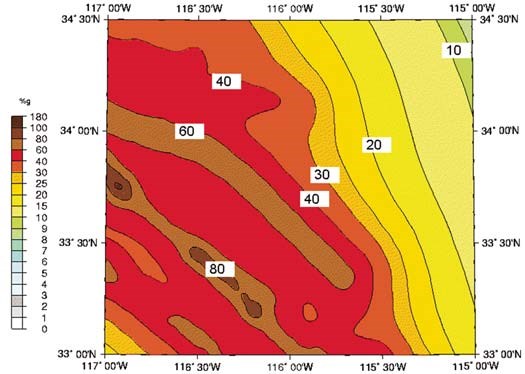
Map generated with the USGS custom map tool on the earthquake hazard map site http://earthquake.usgs.gov/hazmaps/interactive/.
As an example of seismic monitoring in a national park, this section describes a study and monitoring program focused on the Joshua Tree National Park area; this study mostly uses data available online. Because Joshua Tree National Park is near a very seismically active area of southern California, earthquakes within or near the park present a significant seismic hazard. Strong ground shaking within the park could damage structures or trigger landslides or rock fall. To view the earthquake activity in and near the park, we used a catalog search and the Seismic/Eruption software to produce a map of seismicity from 1990 to 2004 (Fig. 10). Most of the epicenters are outside of the park, associated with the San Andreas and related faults to the west; nevertheless, large earthquakes on these faults can cause significant shaking within the park (Fig. 11).
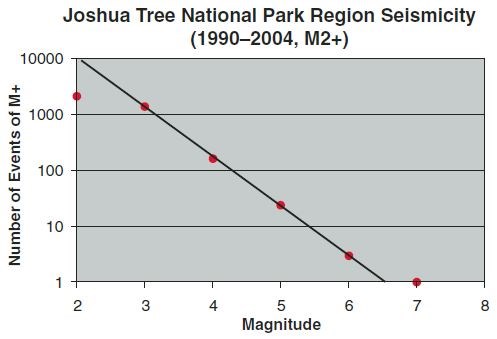
A simple and useful statistical analysis of earthquake activity near Joshua Tree National Park can be completed by preparing a frequency-magnitude plot using the earthquake data shown in Figure 10. To obtain the data for the frequency-magnitude plot, one can sort the earthquake catalog by magnitude for the geographical area and time period selected, and then count the events within each magnitude range. The sorting and counting can easily be accomplished in a spreadsheet program such as Excel. Alternatively, if the data are imported into the Seismic/Eruption program, the counter within the software can be used to sequentially count the number of events above a specified magnitude cutoff.
The results of the frequency-magnitude analysis for the Joshua Tree National Park and surrounding area are shown in Figure 12. A straight line has been fitted to the central data points illustrating that the frequency-magnitude relation for this area is approximately linear, similar to that shown for the worldwide earthquakes in Figure 4. The observed number of earthquakes for magnitudes of 2 and above is low because not all small earthquakes
are well recorded (or their magnitudes determined) by the available seismographs in the area. Also, the data point for M+ = 7 does not fall on the line, probably because the time period selected (15 years) was not long enough to accurately determine the rate of earthquake activity for large, relatively rare events. For example, an M7+ event occurred within the selected time period, but if we had chosen a 30-year time period, it is likely that all of the other data points (numbers of events) would be approximately twice as large (and the M7+ data point might still be equal to 1).
The frequency-magnitude relation can be used to estimate the recurrence interval for a given magnitude earthquake. For example, for a magnitude 6 or above event, the number in 15 years is 3, and this data point falls on the linear portion of the frequency-magnitude relation. This suggests that the resulting recurrence interval should be reasonably reliable. Because there were three M6+ earthquakes in 15 years (in the area shown in Fig. 10), the frequency of occurrence for M6+ earthquakes for the selected area averages about one event every five years.
Additional statistical analysis, compilation of a fairly complete catalog and list of notable events, analysis of historical and prehistoric earthquake records, and an earthquake history could be easily developed for Joshua Tree National Park and the surrounding area. Further, earthquake recording (and selected additional studies listed in Table 2) within the park using available seismograph data from the ANSS or California state network (several seismograph stations operate in or very near the park; see http://www.data.scec.org/stationinfo.html for a station map), or from an educational seismograph station installed in Joshua Tree National Park, could be initiated to enhance seismic monitoring in the area.
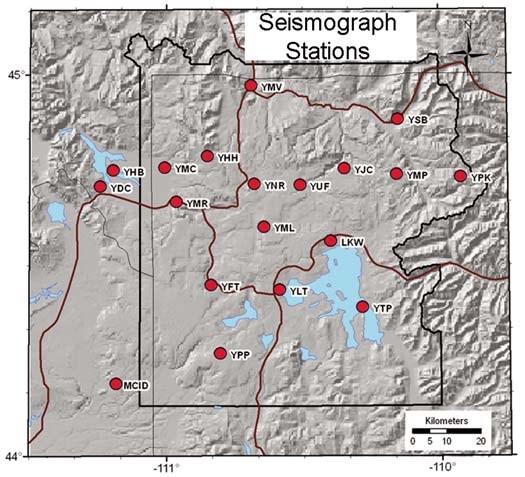
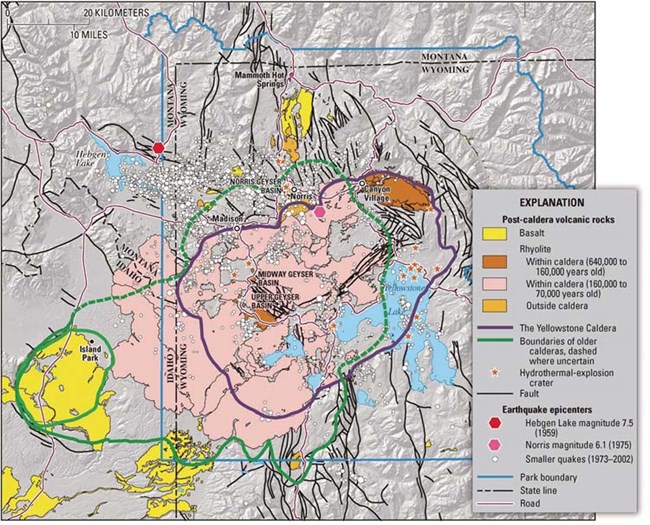
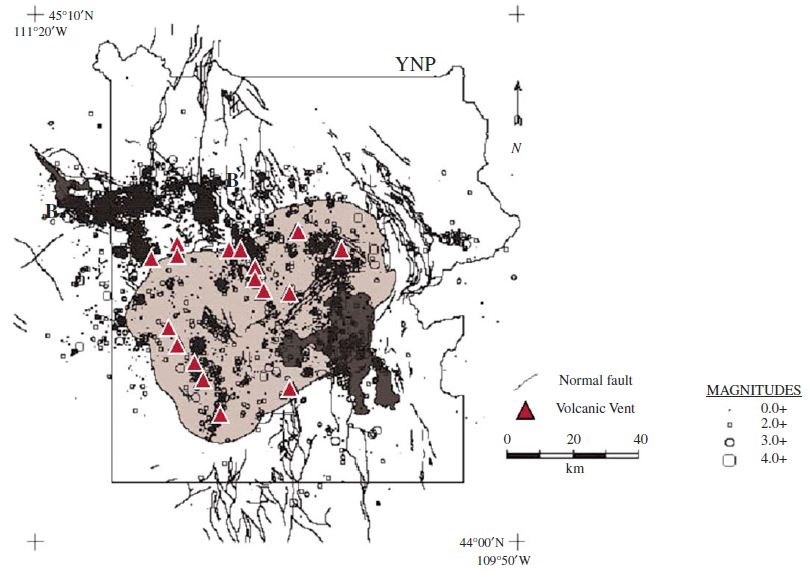
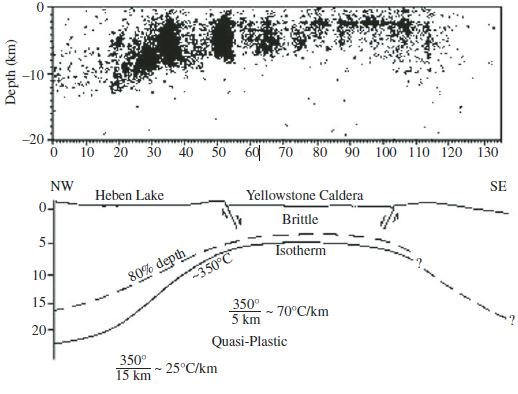
From: http://www.uusatrg.utah.edu/RBSMITH/public_html/IMAGES/19-36ysxs.jpg.
For additional information on the earthquakes, volcanic and tectonic activity of the Yellowstone area, see Smith and Arabasz (1991), Smith and Braile (1994), Smith and Siegel (2000), and the USGS fact sheet 2005-3024 (2005) “Steam Explosions, Earthquakes, Volcanic Eruptions: What’s in Yellowstone’s Future?” available at http://pubs.usgs.gov/fs/2005/3024/.
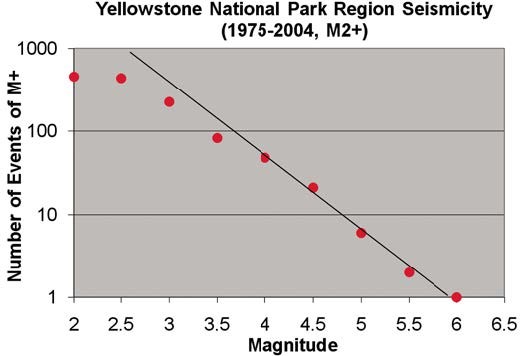
Seismic monitoring can provide extremely useful and interesting data about the dynamic Earth. Local and regional earthquake activity can be analyzed using data available online from regional, national, and global networks. Local seismic monitoring can also be augmented by installation of local seismographs. These data can be used for many purposes, including determining the frequency of occurrence of earthquake activity, evaluating earthquake risk, interpreting the geological and tectonic activity of the area, and providing an effective vehicle for public information and education.
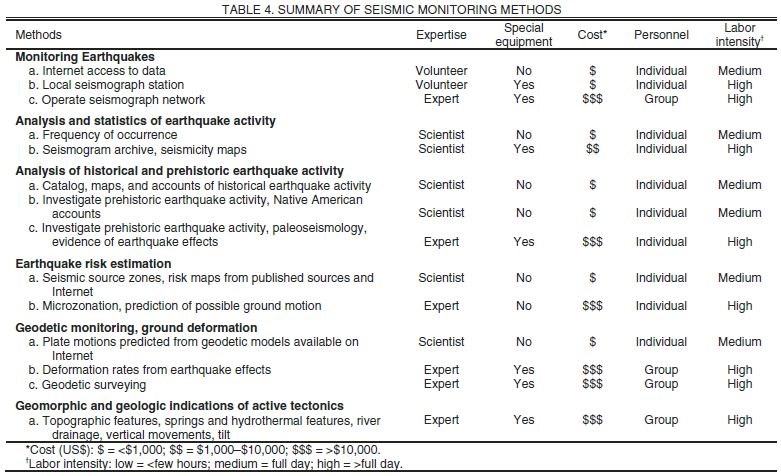
A comparison of the seismic monitoring methods discussed here is given in Table 4. In this Table, the relative expertise, technology and instrumentation, cost, and personnel requirements for implementing the various monitoring methods are listed.
REFERENCES CITED
Abbott, P.L., 2006, Natural Disasters, fi fth edition: Boston, McGraw-Hill, 512 p.
Ansell, R., and Taber, J., 1996, Caught in the Crunch: Earthquakes and Volcanoes in New Zealand: New Zealand, HarperCollins, 188 p.
Bolt, B.A., 1993, Earthquakes and Geological Discovery: New York, W.H. Freeman, 230 p.
Bolt, B.A., 2004, Earthquakes, fi fth edition: New York, W.H. Freeman, 378 p.
Bolt, B.A., Horn, W.L., Macdonald, G.A., and Scott, R.F., 1977, Geological Hazards: Earthquakes-Tsunamis-Volcanoes-Avalanches-Landslides-Floods, second edition: New York, Springer-Verlag, 330 p.
Bryant, E.A., 1992, Natural Hazards: Cambridge, Cambridge University Press, 294 p.
Harris, A., Tuttle, E., and Tuttle, S.D., 2004, Geology of National Parks, sixth edition: Dubuque, Iowa, Kendall Hunt Publishing, 896 p.
Hough, S.E., 2002, Earthshaking Science: What We Know (and Don’t Know) About Earthquakes: Princeton, Princeton University Press, 238 p.
Kearey, P., and Vine, F.J., 1996, Global Tectonics, second edition: Oxford, Blackwell Publishing, 338 p.
Keller, E.A., and Blodgett, R.H., 2006, Natural Hazards: Earth’s Processes as Hazards, Disasters, and Catastrophes: Upper Saddle River, New Jersey, Prentice Hall, 395 p.
Keller, E.A., and Pinter, N., 2002, Active Tectonics: Earthquakes, Uplift, and Landscape, second edition: Upper Saddle River, New Jersey, Prentice Hall, 362 p.
Kovach, R.L., 1995, Earth’s Fury: An Introduction to Natural Hazards and Disasters: Englewood Cliffs, New Jersey, Prentice Hall, 214 p.
Lillie, R.J., 2005, Parks and Plates: The Geology of Our National Parks, Monuments, and Seashores: New York, W.W. Norton, 298 p.
Meertens, C.M., and Smith, R.B., 1991, Crustal deformation of the Yellowstone caldera from first GPS measurements: 1987–1989: Geophysical Research Letters, v. 18, p. 1763–1766, doi: 10.1029/91GL01470.
Meltzer, A.S., Rudnick, R., Zeitler, P., Levander, A., Humphreys, G., Karlstrom, K., Ekström, G., Carlson, R., Dixon, T., Gurnis, M., Shearer, P., and van der Hilst, R., 1999, US Array initiative: GSA Today, v. 9, no. 11, p. 8–10.
Meltzer, A.S., 2003, EarthScope: opportunities and challenges for earthscience research and education: Tulsa, Oklahoma, Leading Edge, v. 22, p. 268–271.
Reid, H.F., 1910, The Mechanics of the Earthquake: The California Earthquake of April 18, 1906, Report of the State Investigation Commission, Vol.2: Washington, D.C., Carnegie Institution of Washington.
Shearer, P.M., 1999, Introduction to Seismology: Cambridge, UK, Cambridge University Press, 260 p.
Smith, R.B., and Arabasz, W.J., 1991, Seismicity of the Intermountain Seismic Belt, in Slemmons, D.B., Engdahl, E.R., Zoback, M.L., and Blackwell, D.D., eds., Neotectonics of North America: Geological Society of America, SMV V-1, Decade Map v. 1, p.185–228.
Smith, R.B., and Braile, L.W., 1994, The Yellowstone Hotspot: Journal of Volcanology and Geothermal Research, v. 61, p. 121–188, doi: 10.1016/0377-0273(94)90002-7.
Smith, R.B., and Siegel, L., 2000, Windows into the Earth: The Geologic Story of Yellowstone and Grand Teton National Parks: New York, Oxford University Press, 247 p.
Stein, S., and Wysession, M., 2003, An Introduction to Seismology, Earthquakes and Earth Structure: Malden, Massachusetts, Blackwell, 498 p.
Waite, G.R., and Smith, R.B., 2002, Seismic evidence for fluid migration accompanying subsidence of the Yellowstone Caldera: Journal of Geophysical Research, v. 107, no. B9, p. 2177, doi: 10.1029/2001JB000586.
Yeats, R.S., Sieh, K., and Allen, C.R., 1997, The Geology of Earthquakes: New York, Oxford University Press, 568 p.
