Part of a series of articles titled History and Archeology of the District of Columbia Monumental Core.
Previous: The 17th Street Wharf
Article
by Charles LeeDecker
Catastrophic floods have occurred throughout the city’s history, and efforts to provide flood protection also have a long history. The increasing severity of floods during the 19th century can be traced to deforestation of the Potomac River Basin that resulted from the rapid growth of agriculture, logging, mining, and urban development. The reduction of ground cover led to higher levels of surface water runoff that contributed to the occurrence of extreme flood events. The loss of ground cover also accelerated sheet erosion, which led to vastly greater amounts of sediment in the Potomac and its tributaries. Following a principle known as the Universal Soil Loss Equation (USLE), the amount of sediment in the Potomac and its tributaries increased sharply during the 19th century, peaking around 1902. The model that expresses this trend is based on the amount of cleared land as reported in the agricultural census for counties in the Maryland Piedmont (Jacobson and Coleman 1986). The perfectly smooth curve generated by the USLE is clearly idealized, and the amount of sediment that actually reached the tidewater at Georgetown is a more complicated question, as runoff sediment would follow a long path down the tributaries to the main stem of the Potomac and over the dams built by the C&O Canal.
Once sediment enters a river system, the river’s ability to transport sediment is directly related to factors such as the river’s slope or gradient and form of its channel. Rivers gain energy as their slope increases and lose energy as their slope decreases, a factor that determines the movement and deposition of sediment. One of the pioneers of North American archeology, Joffre Coe, understood this process well, and he studied the profiles of rivers in the North Carolina Piedmont to identify locations where deeply stratified sites formed by the build-up of sediment. Based on the principle that rivers lose the capacity to carry sediment with the loss of energy, Coe found that deeply stratified sites formed near inflection points where a river’s profile decreased, or became less steep. Another factor in a river’s ability to carry sediment is channel morphology, especially channel width. As channel width widens, current velocity decreases, and the loss of current velocity lowers a river’s ability to move sediment.

NPS

NPS
In the Washington, D.C. area, two important features of the Potomac River led to an extraordinarily large amount of sediment deposition below Georgetown. Within the roughly 180-mile reach from Cumberland, Maryland, to Georgetown, the river drops an average 3.3 feet per mile, but as the river leaves the Piedmont, it gains a huge amount of energy as it passes through the Falls. In this reach, the river drops 10 feet per mile; then when it reaches tidewater at Georgetown, the gradient essentially “flatlines,” resulting in a loss of energy and capacity to transport sediment. The second factor is the width of the channel; around Washington, the channel expands from less than 500 feet above Georgetown to more than 2000 feet below Mason’s Island. When the factors of river gradient and channel morphology were amplified by the effect of deforestation, the result was a huge increase in the amount of sediment reaching Georgetown and the west end of Washington in the 19th century, especially during flood events. Georgetown was not the only colonial port that faced this type of eco-catastrophe. Many other towns in this region such as Bladensburg, Colchester, Port Tobacco, Occoquan, and Dumfries suffered when their shipping channels were blocked by silt deposits.

NPS
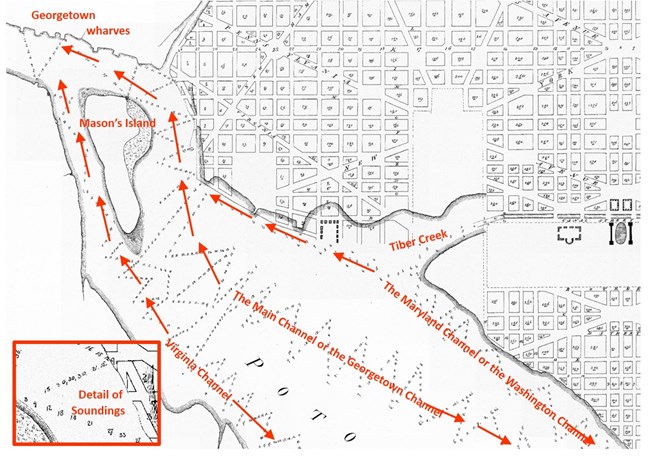
West Potomac Park was built on land that was reclaimed from 1870 to 1901, having its primary impetus in the need to maintain the shipping channels of the Potomac River below Georgetown. The ancestral channel of the Potomac River is still readily visible in bathymetric mapping. Rising sea levels that have occurred since the last Ice Age drowned the Potomac River valley below the Fall Line, creating broad tidal creeks such as the lower Tiber. Below Georgetown, the Potomac flowed through a complex of intertwined or braided channels that have served as the primary shipping lanes since Colonial times. Below Georgetown, the main channel split into (a) the Virginia channel, which ran along the Virginia shoreline south of Mason’s Island (now known as Theodore Roosevelt Island) and (b) the Georgetown Channel, which ran to the north of Mason’s Island. The two channels converged below Mason’s Island. A third channel, the Maryland Channel or later the Washington Channel, split from the Georgetown Channel near Easby’s Point and ran along the north shoreline of the Potomac River. All three channels were fairly clear when Nicholas King mapped the city in 1803.
One of the first efforts to maintain access to the Georgetown wharves was construction of a dam or causeway across the Virginia channel to Mason’s Island in 1805. The idea was that by blocking the Virginia channel, more current would be forced through the Georgetown channel to produce a flushing effect. Although the causeway altered the river dynamics, flood-borne sediments continued to clog the Georgetown Channel, as there was not enough current to move the increasing amounts of sediment that came down stream in the 19th century.
Jacobson, Robert B., and Derrick J. Coleman. 1986. Stratigraphy and Recent Evolution of Maryland Piedmont Flood Plains. American Journal of Science 286: 617-637.
King, Nicholas. 1803. Plats of the city of Washington. Record Group 42,Records of the Office of Public Buildings and Public Parks of the National Capital, Entry 61, Rough or Working Plats and Drawings. U.S. National Archives and Records Administration, Cartographic Records, College Park, Maryland.
Part of a series of articles titled History and Archeology of the District of Columbia Monumental Core.
Previous: The 17th Street Wharf
Last updated: April 17, 2020