Last updated: January 25, 2018
Article
Monitoring Marine Geologic Features and Processes
Marine features and processes
David M. Bush
Department of Geosciences, University of West Georgia, 1601 Maple Street, Carrollton, Georgia 30118, USA
Bush, D.M., 2009, Marine features and processes in Young, R., and Norby, L., eds., Geological Monitoring: Boulder, Colorado, Geological Society of America, p. 163–188, doi: 10.1130/2009.monitoring(07). For permission to copy, contact editing@geosociety.org. ©2009 The Geological Society of America. All rights reserved.
Introduction
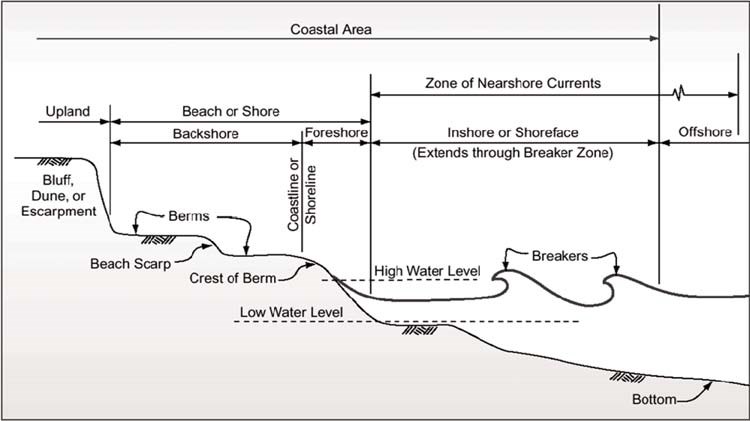
Marine environments include anything seaward of the shoreline, the dividing line between land and water. All environments can be considered as either terrestrial (on land), marine (under water), or transitional (transitional between land and water). The transition zone between terrestrial and marine environments includes such environments as tidal flats, estuaries, dunes, and beaches and barrier islands. Beach features and processes are covered in another chapter of this volume (Bush and Young, this volume). Part of the beach system also belongs to the nearshore zone, so it is impossible to completely disassociate the beach/ transitional zone from the nearshore marine system. Standard beach terminology delineating the environmental zones of the nearshore system is shown in Figure 1.
To define the limits of the beach and the limits of the nearshore marine system, begin with the above water part of the beach, the part landward of the shoreline. This is known as the backshore, but is also often referred to as the dry beach, the recreational beach, or the subaerial beach. Looking seaward, the shallowest part of the beach is the intertidal zone, the portion between high tide and low tide. This is also known as the foreshore. Seaward of the foreshore is the inshore, commonly called the shoreface, the deeper water extent of the beach system. The shoreface is the zone where waves approaching land first start to interact with the seafloor. Another way to look at it is that the shoreface is the seaward extent of sediment movement caused by waves. Because the beach is actually defined by the movement of sand, the shoreface, then, is the seaward extent of the beach. The shoreface typically extends seaward to a water depth of 30 feet, though the depth is variable depending on the local wave heights. The seaward extent of the shoreface may be found within a few hundred yards or many miles of the shoreline, depending on the steepness of the seafloor.
For the purposes of this chapter, marine features and processes will be considered seaward from the low tide line—that is, beginning with the shoreface. The marine environments seaward of the foreshore (below the low tide line) can collectively be referred to as the subtidal environment (literally, below the tides). The subtidal environments may be dominated by calcareous sediments (calcium carbonate) if the water is warm and clear enough (Wilson, 1975). If the setting is not tropical, or is dominated by fine sediment input from land, then the environment will be dominated by sediments derived from land sources, or siliciclastic sediment.
More than just waves, the nearshore zone is also acted upon by tides, ocean currents, sea level changes, sediment supply, and biologic effects. Oftentimes it is easy to disregard the nearshore, or submarine, landscape and to forget that it is part of the larger dune/beach/nearshore single system. Indeed, the nearshore is intimately tied to the onshore. Sediment moves alongshore as well as onshore and offshore, depending on wave energy and the passage of storms. Nearshore topography exerts a major control on the magnitude of storm surge and coastal flooding that will be caused by the passage of a hurricane or winter storm. Offshore hardgrounds may actually protect portions of the coast from erosion. Nearshore sand bars and their movement can have great effects on natural beach rebuilding following storms. Engineering structures along the shoreline or offshore may exert a major influence on nearshore topography. For example, although jetties may be necessary to provide safe harbor entrances, they protrude so far out into the nearshore sediment transport system that they can essentially block all the sediment from being transported along the coast, causing “sand starvation” on the downdrift side. The resulting shoreline erosion can be spectacular. The impacts may be manifested on the subaerial portion of the system, but major changes are occurring in the submarine portion.
Another way to classify the nearshore system is by dominant bottom types. It may be sandy or rocky (see discussion of substrate later in this chapter). Tropical locales may have reef growth if conditions allow (see discussion of reefs later in this chapter). A good general reference for nearshore processes is the second edition of Beach Processes and Sedimentation (Komar, 1997). The Encyclopedia of Coastal Science (Schwartz, 2005) is a lengthy and expensive book, but it is comprehensive and contains a wealth of information on nearshore processes and sampling/monitoring techniques. A series of articles published in the Journal of Coastal Research (Gorman et al., 1998; Larson et al., 1997; Morang et al., 1997a, 1997b) give a good overview of the various aspects of nearshore processes and monitoring from an engineering perspective.
Limits of the Nearshore Zone
The marine nearshore zone stretches from the beach seaward to a water depth where average waves begin to interact with the sea bottom. That water depth will vary from place to place depending on the wave climate, but typically is around 30 feet. One can see that the distance from shore to a water depth of 30 feet will vary depending on the slope of the seafloor. In gently sloping environments, such as off Cumberland Island, Georgia, and the Cumberland Island National Seashore, the distance to 30 feet water depth is approximately five miles.
Alternatively, a water depth of 30 feet can be reached relatively quickly in less than one-half mile, off the northern coast of St. Croix, U.S. Virgin Islands, near the Buck Island Reef National Monument.
This chapter addresses issues related to the shallow water systems of continental or insular shelves. Without question, the nearshore marine environment is tied to the onshore portion of the coastal zone. The beach, for example, includes not only the dry, recreational beach, but also the underwater volume of sand that is moved by waves and nearshore currents. The subaerial portion of the coastal zone is covered in another chapter. It is certainly beyond the scope of any manager to be able to, or to need to, monitor every aspect of the nearshore zone. Some important aspects, though, that can be easily observed and monitored include bathymetry of the nearshore, hydrography (waves and tides and perhaps currents), reefs (if applicable), other offshore barriers (sand bars, for example), substrate, water column turbidity, and water column chemistry and quality.
STRESSORS/POSSIBLE CHANGE TO THE MARINE NEARSHORE SYSTEM
Change in any natural system is the result of stimulus and response. The principal agents of geologic change are wind, water, ice, gravity, and biologic. The nearshore marine system can be subdivided into the water column and the seafl oor. Shorelines and shoreline change are addressed in another chapter. The water column can further be broken down into the material suspended in it, material dissolved in it, and energy or motion supported by it (waves and currents).
One of the most important coastal marine vital signs to monitor is water depth and water depth changes. Such changes can give insight into processes acting on long or short time scales. The longest time scales are changes in sea level. See Wilgus et al. (1988), Fletcher and Wehmiller (1992), or the National Oceanic and Atmospheric Administration (NOAA) Web site (www.noaa.gov) for a synopsis of sea level changes. Douglas et al. (2001) considers not only the physical driving forces or sea-level rise, but also the societal impacts. Monitoring this vital sign does not address short-term depth changes resulting from tidal fluctuations or storm surge, but rather tracks long-term bathymetric changes caused by subsidence of the seafloor or global sea-level change. The monitoring of water depth is largely addressed by NOAA; and as a result, local or regional tide gauge data can be easily obtained at NOAA’s Web site (www.noaa.gov). Within this site, see the links to bathymetric data and other sources.
Waves and currents are another important aspect of energy flux in the water column. The speed, power, and direction of currents vary constantly. Though a little dated, Bascom (1980) gives a thorough introduction to the subject. Regional-scale conditions are also monitored by NOAA, and that information is also available online. In many cases, however, detailed local information may be lacking. For example, a manager of a coastal marine environment may wish to monitor the current flow in a sensitive tidal creek, or understand the differential in wave energy between the windward and leeward sides of a reef, or during the passage of a storm.
Offshore barriers, such as reefs and sand shoals, provide critical protection to the sandy shorelines and can act as sensitive indicators of local and global environmental change; therefore, it is critical to measure and monitor the vitality and spatial extents of these important resources. Many reefs around the world are being negatively impacted by rising water temperatures, dust input, and human action, including ecotourism associated with diving and boat anchoring. In addition, protective offshore barriers may be much smaller in scale than reefs and also may be nonbiogenic. For example, sand bars, rock outcrops, and shoals may offer relative protection for portions of the shoreline or submerged resources.
Seabottom composition, known as substrate, may consist of one or more of the following materials: mud, sand, gravel, or rock. In addition, portions of the seabottom may be covered by sea grass. The sea grasses provide habitat and protection for juvenile species of fin fish and shellfish, while also acting as a sediment stabilizer. Intertidal marsh grass or mangroves in low latitudes can serve similar purposes.
Summaries of nearshore and shelf hydrodynamics and bottom composition, as well as evolutionary changes through time can be found in a number of texts. Particularly thorough and well organized are Davis (1985), Carter (1988), and Carter and Woodroffe (1994).
Finally, the quality of the water itself is important and can be monitored. Changes in suspended sediment in the water column may be an indicator of seasonal or event-related influx of sediment or degrading conditions caused by increased runoff from land over time. Material dissolved in the water may influence the health and vitality of plants and animals living in the water. This chapter will address suspended sediments only. All dissolved substances (nutrients, solids, and gases) plus any pollutants, toxins, and flora and fauna, are considered part of the biological realm and beyond the scope of this discussion.
SELECTED METHODS FOR MONITORING MARINE FEATURES AND PROCESSES
Monitoring vital signs of physical aspects of park ecosystems helps give insight not only into the general state of systems but also into changes in the systems or system vitality. The vital sign concept is very similar to the geoindicators approach to monitoring environments. The International Union of Geological Sciences (IUGS) defines geoindicators as “measures of surface or near-surface geological processes and phenomena that vary significantly over periods of less than 100 years and that provide information that is meaningful for environmental assessment” (Berger, 1996). They are applied to a wide variety of environments (Berger, 1997). Geoindicators have a variety of management applications including environmental auditing and monitoring. Berger (1997) notes that the geoindicators approach identifies a minimum set of parameters that describe short-term environmental dynamics, and that are proxies representing all the parameters on which the processes depend.
Vital signs of marine features and processes will be addressed as follows: (1) the general setting of the environment, of which water depth is the primary indicator; (2) the energy of the environment, waves, and currents; (3) barriers including reefs and other offshore barriers, which block energy; (4) seafloor composition, or substrate; and (5) water column turbidity. As previously mentioned, the biology of the water column is beyond the scope of consideration of this chapter, though an introduction is given. Table 1, at the end of this chapter, summarizes the monitoring techniques discussed below.
There is an infinite number of monitoring techniques and equipment available for monitoring the component environments of the nearshore marine system. The following are selected in order to give a range of methods from low-cost and low level of expertise needed, to high- cost and higher level of expertise needed. Expertise needed may refer to either the expertise needed to use the equipment or the expertise needed to interpret the data, or both.
Vital Sign 1: Bathymetry of the Nearshore
Definition. Bathymetry is the study of water depth of any body of water. The study may include simply collecting data on the water depth, or any analysis of such data including changes over time, at any time scale.
Significance. Of particular importance may be water depth changes caused by single events (storms) and subsequent postevent recovery. Also, seasonal changes may be of note, as well as long-term changes. Changes in water depth may be indicators of conditions of sediment movement, such as sand shoals migrating by marine currents. Such movements may be in one direction if unidirectional currents dominate, or they may be bidirectional on a daily (tidal) or seasonal basis. Understanding of water depth changes on that time scale will best be understood with respect to the hydrographic regime of the area in question. Water depth changes may also be due to much longer-term phenomena such as crustal subsidence or uplift, or sea-level rise. Water depth changes on a long temporal scale are beyond the scope of this chapter.
Most nearshore marine areas have existing bathymetric data either from NOAA, the U.S. Geological Survey (USGS), academic studies, or perhaps even their own in-house research. This information may be adequate baseline data, but systematic monitoring is recommended in dynamic settings where sea bottom and water depth changes are expected. It is very likely that available bathymetric surveys will not be very detailed, so if detail is needed over a small area it will be necessary to do your own monitoring.
Long-term changes in water depth caused by sea level change or land subsidence or uplift are beyond the monitoring scope of this report. For such long-term change consult the USGS or NOAA. Regardless, the data from nearby tide gauges should be consulted for overall long-term changes. Long-term bathymetric changes may indicate global sea-level change, or subsidence or uplift of the seafloor. On shorter time scales, bathymetric changes may indicate changes in sediment bedforms on the seafloor or growth or destruction of biogenic structures such as reefs.
Any measurement of water depth is called a sounding. For any bathymetric survey, the two important pieces of data to be collected are the water depth itself and the geographic location of the depth measurement. One is useless without the other. Measuring water depth can be as simple as using a pole or rope, but geographic location data may be slightly more difficult to obtain.
Level 1: Manual Surveys
Methods of monitoring bathymetry can be done very simply by testing the water depth with poles for shallowest areas or rope or cable (wire rope) for deeper areas. The simplest techniques are rarely used nowadays, because low-cost fathometers are readily available. But for an inexpensive and hands-on approach, and perhaps for training of students with boat and diving abilities, these can be great learning exercises, and fun as well. As mentioned above, obtaining the exact geographic location of each water depth measurement is critical. In a truly manual, very low-cost survey, locating the data point would likely be done by what is known as dead reckoning. This means estimating your position by carefully moving from a known position, using such factors as course and speed. Dead reckoning requires a great deal of experience and should only be used in extenuating circumstances.
Equipment required. The only equipment needed is a long sounding pole or a rope or cable (wire rope) to measure the depths. To record location data, a chart or topographic quadrangle map are good bases to use for beginning from a known starting point. Assuming the observers are in a boat or skiff, they will use a compass for heading and binoculars for keeping focused on known points. Again, this method gives very low-quality precision and accuracy but is a good training exercise. With experience, and considering studies over small areas, it may be possible to accurately locate within 100 m. It can be used especially for reoccupying specific features or study sites where one only needs to get in the vicinity of the feature in order to orient oneself.
Methodology. Map locations can be made by dead reckoning on topographic quadrangles, estimating distances from known points or features onshore or offshore, or from buoys or other permanent markers. This type of effort is not the best for detailed studies, but can certainly be used to monitor individual spots of interest. And again, for students, these can be great exercises for learning to estimate distances and to get a real hands-on feel for the environment.
Timing. Timing should be as necessary, depending on the dynamics of the system. For example, if the feature to be monitored is a reef or other hard or biogenic structure, once a year is sufficient. If the feature is a sand shoal or bar in a strong current area, it should be monitored monthly or quarterly. And if storms are predicted, event capture should be considered, where the feature is surveyed immediately before and after the storm and then subsequently at regular intervals to monitor change induced by the storm and recovery.
Level 2: Fathometer Traces
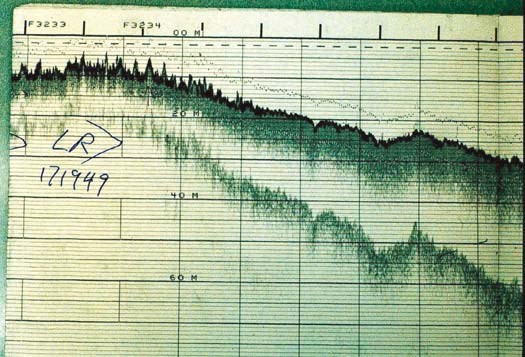
A larger area can be covered with a simple fathometer from a small boat (Gorman et al., 1998). Track lines can be plotted from locations gathered using a handheld or boat-mounted Global Positioning System (GPS). Printouts of bathymetry (Fig. 2) are still utilized, though digital recording is now commonplace.
Equipment required. Fathometers with printout and/or digital recording can be obtained at any marine supply store. A simple handheld GPS unit can be used for spot locations of track lines. If available, a differential GPS gives the best location data, with accuracy to within a meter. For differential GPS, a second, stationary receiver is needed. It continually records its known location, so any drift or error can be corrected using post-processing.
Methodology. If surveying a relatively unknown area, or if making a baseline survey, it is best to run a series of straight north-south and east-west grid lines over the area of interest. After assessment of any directional trends of important features to be monitored (or if such trends are already known), directions of track lines can be adjusted to give the best longitudinal versus transverse coverage. Additionally, if time and resources permit, track lines in even more directions will give the most detailed data. From all the track line data, contour maps of bathymetry can be drawn.
Timing. As above, surveying should be done as needed, with event-capture if possible.
Complexity. This level of surveying and monitoring can certainly done by students and trainees with some supervision. Gathering the raw data, the fathometer traces, requires supervision to make sure track lines are properly located and that the data are consistent. Plotting and contouring the data requires a good deal of skill and experience.
Cost. The cost of this method is moderate. Perhaps fathometers and GPS units can be borrowed or shared, though they are not terribly expensive. Boats should be available and maintained by any park with marine features.
Level 3: Computerized and Integrated GPS and Fathometer
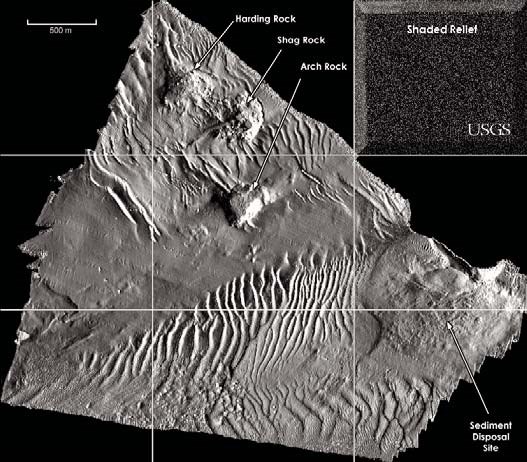
For the most detailed survey, a computerized and integrated GPS and side-scan sonar plus fathometer, digitally recorded and processed, will give the most accurate and precise data and allow for digital manipulation and three-dimensional display of results. In addition, the sonar will give information about the composition of the substrate (see Vital Sign 5 on substrate, below). The U.S. Geological Survey is a good place to go for information on seafloor mapping. The USGS Web page, http://woodshole.er.usgs.gov/operations/sfmapping/interp.htm, is well illustrated. A shaded relief image of a portion of the seafloor southwest and south of Alcatraz Island reveals several identifiable features (Fig. 3). For large seafloor features, towed arrays such as sidescan sonar can cover wide swaths and be digitally integrated with bathymetric data for three-dimensional viewing (Gorman et al., 1998; Larson et al., 1997; Morang et al., 1997a; 1997b). See also Barnhardt et al. (1998) for a discussion of the application of these techniques in areas of complex seafloors.
Equipment required. Complex multibeam arrays, digital recorders, processing computers, and display and printing equipment are needed for this highest level technique. Cooperation
with experts at the USGS or NOAA is recommended.
Methodology. Methodology is similar to running fathometer track lines as above, but usually at this level an array of sound sources and receivers is towed behind a ship instead of the signal being sent from the ship or boat. This allows wider coverage of the seafloor. Also, raw data is recorded digitally for later processing. Side-scan sonar data gives a record of the acoustic properties of the seafloor. Such data can be confused with photographs because they are so detailed. Here, instead of recording light reflections for a photograph, it is sound reflections that are being recorded, and thus interpretation is necessary. See Gardner et al. (1996) for discussion of techniques and results from deepwater surveys, and McMullen et al. (2005) or Poppe et al. (2004) for recent shallow water studies. Integration of bathymetric data with the sidescan sonar acoustic data can give realistic images of the seafloor in three dimensions.
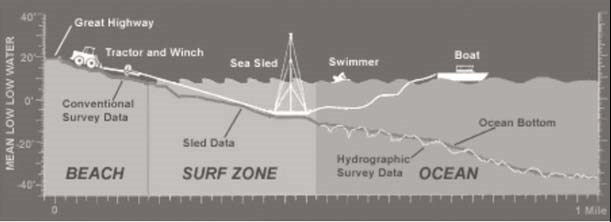
A tethered sled array can be used to measure bathymetry and other seafloor attributes in waters with strong currents and high surf. Sea Surveyor, Inc., has developed a heavy sled system with a mast with reflector prisms for surveying location (Fig. 4). The sled is towed out to sea by a boat, and towed back in by a tractor and/or winch. At equidistant stops along the inward tow, a surveyor on land can determine the elevation of the seafloor. Profiles are mapped, and data contoured.
Timing. As with the other surveys, timing should be on a regular interval and as needed for event capture.
Complexity. This type of survey is highly complex, and outside assistance will be needed. The USGS has a great deal of experience with these techniques and would be good partners. Discussion of a USGS multi-beam project can be seen online at http://ccma.nos.noaa.gov/products/biogeography/usvi_nps/overview.html.
Cost. The cost of digital surveys is high. The equipment will likely be beyond the limits of most offices. Partnering with an organization that owns the required equipment, such as the USGS or NOAA, will probably be necessary.
Vital Sign 2: Hydrography
Definition. Hydrography refers to any type of wave and current climate, including tides, storm waves, average wave heights, rip currents, etc. It is the physical oceanographic setting of a particular study area—the movement of energy through a water column.
Significance. Because currents and waves are the dominant agents of sediment movement in the nearshore, it is important to understand and monitor the hydrography of a body of water for complete understanding. Sediment movement is important to monitor because it may lead to burial of important natural or cultural resources. Additionally, loss of sediment (erosion) from public lands may be a concern.
Oceanic currents transport water, sediment, and storm debris both parallel to and perpendicular to the shoreline. By far the greatest volume of water moved is in an alongshore direction, because waves approaching the shore at an angle set up a current—called the longshore current—in the general direction of wave travel (Komar, 1997).
Because storm waves are so large, they begin to break much farther from shore than normal or fairweather waves. The net effect is a widening of the surf zone. The longshore current described above is a surf-zone phenomenon, so merely by enlarging the width of the surf zone, more water is moved parallel to shore. This current can move sediment out of one local area and into another, resulting in a loss of sediment from one portion of the coast. The loss of sediment is not necessarily permanent. Sometimes it a seasonal change in the direction of approach of waves that causes sediment to be alternately moved out of, and back into, a study area.
Storms are also responsible for bottom currents which move at high angles, sometimes perpendicular, to the shoreline. Such currents are known as downwelling pressure gradient currents and are set up because of the local rise in sea level caused by the storm surge. The storm surge sets up a sea surface tilted away from land, generating a gravity-driven flow back out to sea. Rip currents are an example of pressure gradient current on a small scale, which weakens seaward and dissipates at the seaward limit of the surf zone.
Similar in generation, but at a larger scale, are currents created during storms that, even with extreme turbulence created by breaking storm waves, have an overall net flow seaward (Allen, 1982). These seaward-flowing currents are not very strong, and they move a much smaller volume of water than longshore currents, but they can move great quantities of sediment away from the beach and into deeper water (Hayes, 1967). They are efficient at moving sediment because they are accompanied, and even partly created, by large storm waves. Storm wave scour and turbulence resuspend sediment. Once sediment is resuspended, only the slightest current is needed to carry the sediment away. Seaward-flowing currents can actually carry sediment many miles offshore, often so far that the sand is lost from the beach system. This loss is true erosion of the shoreline—a permanent net loss of sediment from the beach and dunes.
In some cases, when storm surge flows back to sea, either by the force of gravity alone or when driven by offshore-blowing winds, an erosive ebb current can be generated. This type of current is different from the ones described above because it occurs while the storm is moving out of the area or diminishing. Stormsurge ebb can cause an existing inlet to change shape; it can create a new inlet, such as on Pawleys Island, South Carolina, during Hurricane Hugo (1989); it can scour channels across beaches and the shoreface; and it can cause permanent removal of sand from the beach/dune system to the deeper offshore. After Hurricane Hugo, the shoreface in front of Myrtle Beach, South Carolina, was covered with deep scour tracks, perpendicular to the shoreline. These were formed by the storm-surge ebb. Similar cross-shelf channels and evidence of sediment transport were reported from off the northern coast of Puerto Rico by Schwab et al. (1996).
Tides and tidal currents may also be important, especially in areas of high tidal range or where their currents are funneled through narrow channels. See, for example, the discussion of tidal current funneling in the Vieques Passage off the eastern coast of Puerto Rico and its effect on a large sand deposit (Rodríguez et al., 1994). Data on timing and range of tides is available from NOAA (see “Tides Online” at http://tidesonline.nos.noaa.gov/). A local tide gauge is a must for marine park workers making their own observations.
Local short-term currents can be set into motion by the wind. These currents are strongest at the sea surface and decrease with depth. Currents can be measured with a wide variety of sensing equipment, from mechanical to electronic to acoustic. Current meters typically have a data logger, which must be retrieved and the data downloaded, or they may be attached to a transmitter to continually transmit data. The latter is more sophisticated and more expensive.
NOAA maintains an Offi ce of Coast Survey within the National Ocean Service. The Coast Survey is the oldest scientific organization in the United States, dating from around 1807. Visit their hydrography home page at http://chartmaker.noaa.gov/hsd/hydrog.htm for everything from nautical charts to information on hydrographic surveys.
Level 1: Observations from Shore/Drogue Study
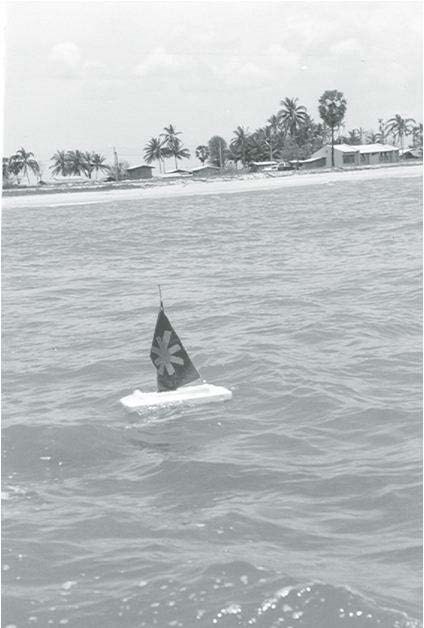
Timing wave periods, heights, and angle of approach can actually give some very good information on local hydrography. It may seem like an overly simplified method, but if observations are recorded in a log book, with photographic documentation, over time a good set of data can be collected. Observations should be made at the same time each day and from the same location, and before, during (if possible), and after storms. Even weekly or monthly observations will be worthwhile, especially if augmented with event capture records. Nearshore currents can be observed and measured with drift cards or drogues (Fig. 5) which are timed and their locations plotted on a map.
Equipment required. For waves, a log book with a standardized format for making repetitive observations of wave heights and periods from shore is required.
Methodology. Wave heights are estimated either against a graduated pole or by pure estimation. For currents, drift markers need to be dropped from a known location at a recorded time. As markers are collected, time and location are recorded on a map. Current direction and speed are then revealed.
Timing. This should be done as needed.
Complexity. This method is very simple.
Cost. There is essentially no cost, other than for maps and drift cards.
Level 2: Mechanical Current Meters, Short Time Period Observations
A handheld current meter can be obtained very cheaply and used to make spot measurements of currents. By lowering the device to different water depths, a vertical series of measurements can be made to observe current velocity and direction changes with depth. These types of measurements are time consuming and can be somewhat tedious, but for students they are a good way to gain intimate knowledge of the physical system, and they are a great learning tool.
Equipment required. A simple handheld, direct reading current meter and a small boat or Zodiac are required.
Methodology. Using either dead reckoning or GPS for locations, the current meter is lowered to the desired depth or series of depths. Measurements are taken and recorded.
Timing. Use this method as needed.
Complexity. This method is fairly simple, and can be done by unsupervised students with boating experience.
Cost. The cost of this method is low.
Level 3: Monitoring of Waves and Currents by Deployed Meters
Both waves and currents can be measured using an equipment array combining pressure transducers to measure wave height and period, and a current meter to measure current direction.
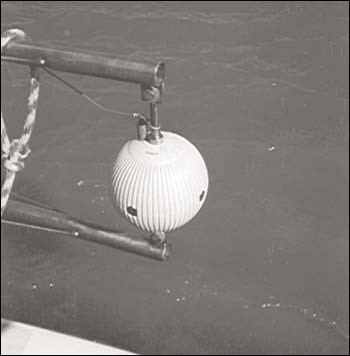
Equipment required. Some sort of deployed current meter system which will give measurements of not only currents, but pressure (for water levels including wave heights and tides), water temperature, salinity, light transmission, etc. (See Fig. 6).
Methodology. These systems are usually deployed for a set amount of time—typically several months. They are then recovered and the data downloaded; the array is serviced and redeployed.
Timing. These types of systems are recording continually.
Complexity. This method can be highly complex because of the need for deployment and retrieval of equipment, plus downloading and processing data.
Cost. The cost of this method is high.
Vital Sign 3: Reefs
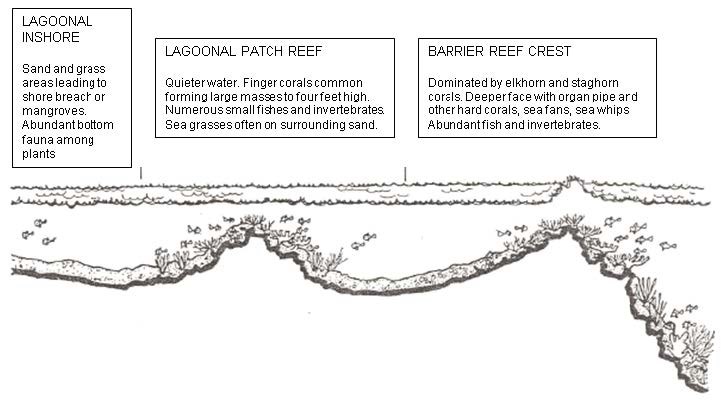
Definition. The word reef is sometimes used for any submerged feature that provides a barrier to waves. Even shipwrecks and unconsolidated material can be considered reefs by some. Dunham (1970), however, defines a reef as a wave-resistant framework constructed in part by organisms. Reefs can be either classified as barrier types that have open marine water behind them (a lagoon), fringing types that are built directly out from the coast, or patch reefs that are more or less circular and are often behind a barrier reef. A simplified diagram of U.S. Virgin Island reef setting is shown in Figure 7. The Buck Island Reef National Monument just offshore of St. Croix, U.S. Virgin Islands, is a fully marine protected area within the National Park System. More information on the reef park is given in the case study later in this chapter.
Coral reefs are largely restricted to tropical oceans because they need warm water to flourish (Goreau et al., 1979). Coral reefs need sunlight to grow because they have a single-celled algae called zooxanthellae living symbiotically in the cellular lining. Zooxanthellae are necessary for reef building because they allow the corals to grow and reproduce quickly by supplying food to the corals. The corals provide protection for the zooxanthellae. Thus corals are restricted to the shallow water (less than 100 m deep). Reefs also need relatively high wave energy to supply food, nutrients, and oxygen, and to prevent deposition of sediment from covering the reef structure.
Much is known about reef growth, reef vitality, and reef stressors. An important aspect of reefs is the control of sedimentation on reef development (Hubbard, 1986) and subsequent responses (Rogers, 1990). There has been a general decline in Caribbean corals owing to various stressors including water temperature increases, dust, and pollution (Gardner et al., 2003).
Significance. Reefs exert some measure of control on their local environment. Physically, barrier reefs block waves and create a lower energy marine setting behind them. Ecologically, reefs support many types of flora and fauna, and are among the most productive environments on Earth. Reef vitality is a key indicator of health of the environment. Reefs may be stressed by high or low temperatures, turbidity, pollutants, physical damage from ships and anchors, or deleterious impacts by humans.
Coral reefs are excellent indicators of overall health of the local marine ecosystem. Two main stressors on reef vitality are pollution from land and overfishing. The U.S. Coral Reef Task Force (USCRTF) was formed in 1998 to improve government actions to preserve and protect coral reefs (http://www.coralreef.gov). USCRTF recommends assessing reef health, monitoring water quality, reducing pollution sources on land, and improving education (U.S. Coral Reef Task Force, 2000). See especially the report on the USCRTF Web site by Jameson et al. (1998), Development of Biological Criteria for Coral Reef Ecosystem Assessment. The techniques applied by Mehrtens et al. (2001) to monitor reefs in Roatán, Honduras, were very simple, involved students, and produced high quality data. See also USGS (2001) for a report about the impacts of Hurricane Mitch (1998) on the reefs of Honduras, and see U.S. Department of the Interior Web page, Protecting the Nation’s Coral Reefs, at http://coralreef.gov/.
Because offshore barriers offer protection to sandy shorelines behind them, and because reefs are both a barrier and a resource, it is critical to measure reef extent and vitality. Reefs are included as a separate item because where they exist, they are profoundly valuable natural resources.
Level 1: Direct Observations by Snorkelers or Divers
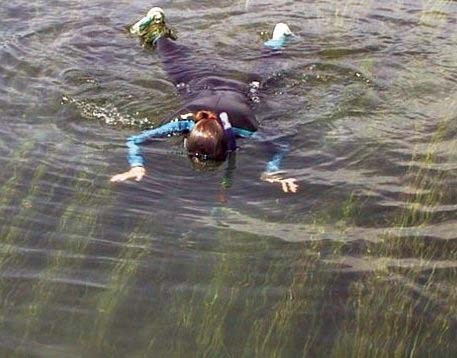
During the observational dives (Fig. 8), photographs are taken, and immediately after the dive a geoindicators-type assessment of key reef/barrier characteristics is done. This would include a checklist of various indicators of reef vitality.
Equipment required. Cameras, notebooks, and a measuring stick for scale in photographs are needed.
Methodology. At known locations of importance, reoccupation of sites should be done at regular intervals to monitor key aspects of reef health. This may also extend to an event capture where more frequent visits would be made after a major storm to monitor reef damage and subsequent repair and growth.
Timing. This should be done at regular intervals, yearly at least, and event capture if possible. It is especially important to make observations after major storms and floods to determine impact of the event on the reef. Influx of sediment or pollution from runoff from land should be monitored.
Complexity. This method is fairly simple, but diving/snorkeling and boat handling abilities are required.
Cost. This method is inexpensive, other than for diving equipment and boats.
Level 2: Abiotic Monitoring of Reefs
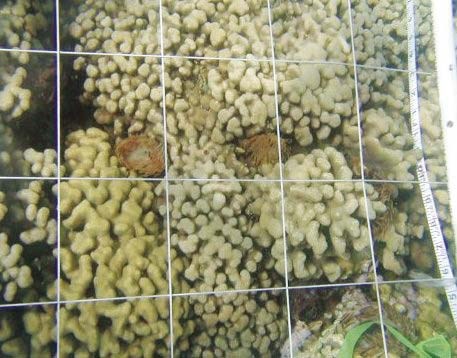
This is a more detailed, quantitative, and rigorous monitoring program than Level 1. Transects are identified and marked with rods embedded in the sea bottom. A camera array mounted on a 1-m-square bottom frame is placed on or as close to the reef as possible. Photographs can be automatically digitized to measure live versus dead reef coverage (Fig. 9).
Equipment required. Diving equipment, underwater camera, and an array are required. The array can be made from PVC pipe, and need not be expensive.
Methodology. The techniques applied by Mehrtens et al. (2001) are very simple, involved students, and produced high quality data. See also the online USGS Open File Report 2001-113 (USGS, 2001) for a study of the impacts of Hurricane Mitch on the coral reefs of Honduras.
Timing. Timing is usually yearly, and after major storms.
Complexity. The complexity of this method is moderate.
Cost. The cost of this method is moderate.
Level 3: Remote Sensing
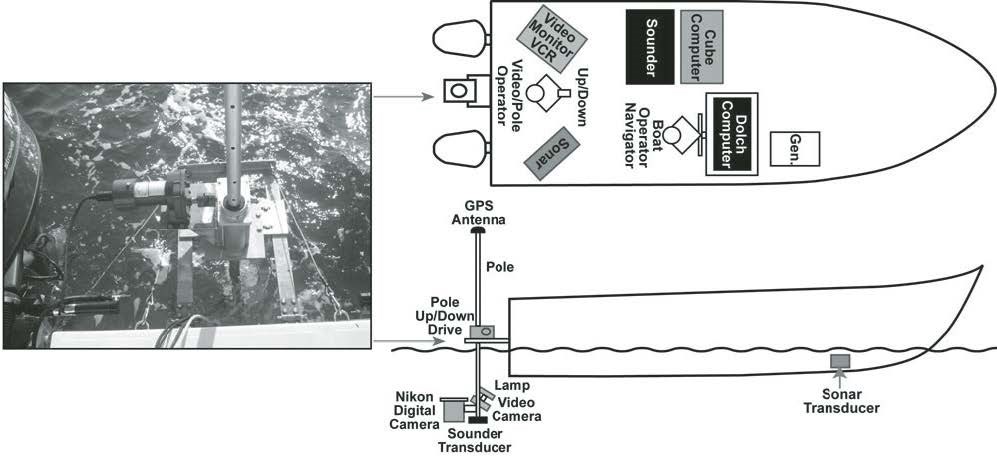
Newly developed techniques allow for the study of reefs from satellite imagery in some situations. Instead of having to dive and take many measurements and observations, a readily available satellite image can be obtained (Lubin et al., 2001). Ground truthing must still be done, but this offers exciting possibilities. The USGS Center for Coastal and Watershed Studies in St. Petersburg, Florida, has experience using the Along-Track Reef-Imaging System (ATRIS). ATRIS provides photographic and video transects of the seafloor with GPS location information (Fig. 10). LIDAR (light detection and ranging) aerial surveys can give information not only on elevations, but there is the capability to analyze multi-spectral information to map coral reef geomorphology, topography, and habitats with a resolution of two meters or less. See the USGS Center for Coastal and Watershed Studies remote sensing information page at http://coastal.er.usgs.gov/remote-sensing/.
NASA has developed a worldwide coral reef library for coral reef remote sensing data. It includes satellite images in the Millennium Coral Reefs Landsat Archive, available at http://oceancolor.gsfc.nasa.gov/cgi/landsat.pl.
Equipment required. Aerial-borne LIDAR systems, satellite images, and processing equipment are expensive, but they can often be shared by several investigators. In addition, the USGS AmericaView Program may provide imagery for educational purposes in some cases, including research at the university level (see their Web site at http://www.americaview.org/).
Methodology. The satellite imaging needs to be processed specifically for identifying unique colors in the coral. This can only be done by highly trained remote sensing specialists. A knowledge of the characteristics of the water column at the time the image was taken is also needed. Satellite images can cover large areas, though resolution is sacrificed. If a snapshot of the overall vitality of a large reef expanse is desired, this may be a good way to acquire it.
Timing. Timing should be yearly, or perhaps less often. Timing and frequency will depend on the availability of satellite images without obscuring cloud cover and with sufficient resolution.
Complexity. This method is very complex, owing to the great deal of expertise needed for processing images.
Cost. If imagery is shared or available gratis, the only real costs are for the remote sensing personnel who may be available in collaborative ventures for little or no costs, especially from universities.
Vital Sign 4: Other Offshore Barriers
Definition. Reefs are important barriers to wave energy but are not the only barriers that may be of interest for understanding the physical setting of a study area and for monitoring of changes. Non-reef types include any sediment buildups such as sand shoals, or consolidated material such as submerged or partially submerged rock or erosional remnants of rocks. Obviously, resistant rock barriers will not change over the short term. In some tropical locations, Pleistocene eolianite comprises significant nearshore barriers, both emergent and submergent. Kaye (1959) is the authoritative source for information on the shoreline features of Puerto Rico, and gives a good background on eolianite, which is a dominant coastal rock along the northern coast of Puerto Rico. Eoliante is dominated by calcareous beach sand and calcareous cement. It is not particularly resistant to wave erosion, so monitoring will reveal changes on scales of decades.
Significance. As with reefs, a barrier will at least partially control the environment, providing lower-energy settings are behind it. Rocky barriers will also serve as an anchoring site for benthic (bottom) organisms and support a hard bottom ecosystem. Unconsolidated barriers will block some wave energy, but remain mobile in response to ocean currents and storm waves.
Protective offshore barriers may be much smaller in scale than reefs and also may be nonbiogenic—sand bars, rock outcrops, and shoals, for example. Some, like rocks, will be essentially stable over long time periods. Large shoals may shift and reorganize during major storms. Offshore bars may change daily.
The shape and size of all such offshore barriers (including reefs, above) is of paramount importance. For those composed of unconsolidated sediment, however, another important attribute to be monitored is the internal (sub-seabottom) composition and stratigraphy. For the overall external shape and size, observation and monitoring techniques discussed above under bathymetry are applied. Sub-seabottom monitoring will be discussed below.
Level 1: Simple Observations by Snorkelers
Again, assuming the overall external size and shape of the feature is monitored using bathymetric techniques, above, and that one is dealing with unconsolidated sediment features, simple sampling by snorkelers or divers is a good way to look at the internal characteristics of the sediment column and to monitor any potential changes (Fig. 8). Most dramatic changes will likely occur during major storms.
Analysis of samples is an entirely separate issue from obtaining the samples. Depending on facilities, everything from simple textural analyses (grain size and sorting) to composition (identification of grains) to organic carbon content, and even radiometric age dating is possible. The USGS has loads of information on sedimentologic techniques. See, for example, USGS (2000) as an example of techniques for grain size analysis and data handling.
Equipment required. Snorkeling or diving equipment, boats, cameras, and sample bags are required. Sediment analysis equipment and supplies as needed, depending on the detail and types of studies desired.
Methodology. A detailed description of sedimentologic laboratory techniques is beyond the scope of this report. Refer to USGS (2000) or standard sedimentology lab manuals such as Lewis and McConchie (1994).
Timing. Timing should probably only be yearly or after a major storm. Bar shape and size might be monitored more frequently, at least quarterly, and definitely before and after a major storm to monitor rebuilding of the beach and bar migration.
Complexity. Laboratory analysis is more complex than obtaining samples. It is suggested that partnering with a university with an existing lab and students needing course projects would be the best way to obtain data.
Cost. Costs are low to moderate, depending on the types and number of samples needed.
Level 2: Sediment Sampling to Determine Detailed Internal Structure and Composition
This goes beyond Level 1 in that it provides high-quality, detailed stratigraphic information. This necessitates some sort of careful direct sample recovery, for example Van Veen grab samplers or short push cores. Van Veens take only shallow samples from unconsolidated sediments, maybe six inches to one foot, and the sediment will be mixed up if care is not taken. Push cores are useful up to about one meter in length. Beyond that, a mechanical coring device is needed.
Equipment required. A Van Veen or other grab sampling device (see USGS [2000] for description), or a push core is needed.
Methodology. See USGS (2000) for methodology of grab sampling devices. A push core is simply a plastic or PVC tube, one meter or shorter in length, that is physically pushed into the seafloor. A stopper or plastic cap is then applied to create suction, and the tube pulled out of the seafloor. A gravity core can be used from a boat and basically behaves like a dart (Fig. 11). It is tethered to the boat and is dropped overboard. Gravity cores can retrieve cores one to five feet long and are a very cheap and simple method of coring surficial (surface) sediments.
In the laboratory, the plastic core tube is sliced through, taking care not to disturb the sediment. The sediment is then carefully split open with a knife or spatula. The core is photographed and subsampled. Subsamples are then processed, as any sediment samples would be.
Timing. Timing should be yearly or less frequently, unless a large storm has passed.
Complexity. Retrieving samples is not overly complex. Processing and analyzing can be.
Cost. Costs are moderate to high.
Level 3: Sophisticated Assessments with Side Scan Sonar, High Resolution Seismic, Vibracoring or Piston Coring, Plus Bathymetric Mapping
This is a full-scale program to sample and monitor the seafloor and subbottom with highly sophisticated techniques. Everything has been presented previously except for vibracoring. Vibracoring is the state of the art technique of obtaining long, undisturbed cores in sandy sediments. Piston coring is the state of the art method for muddy (cohesive) sediments. The bathymetric data must be digital and of high precision in order to measure changes with time and calculate sediment volume changes over time.
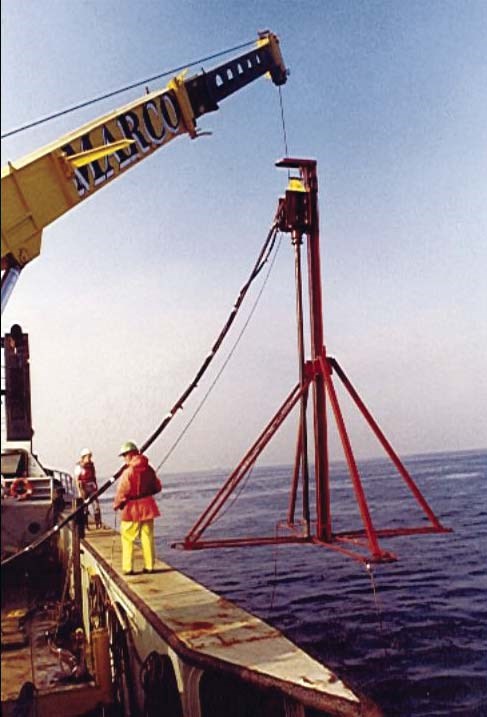
Equipment required. In addition to that previously discussed for bathymetric and sidescan sonar observations, a vibracore or piston core array is needed. This is expensive equipment and can only be used by highly trained personnel with a support team.
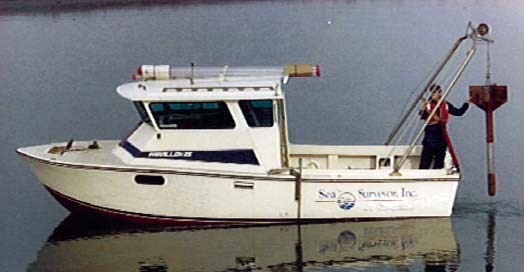
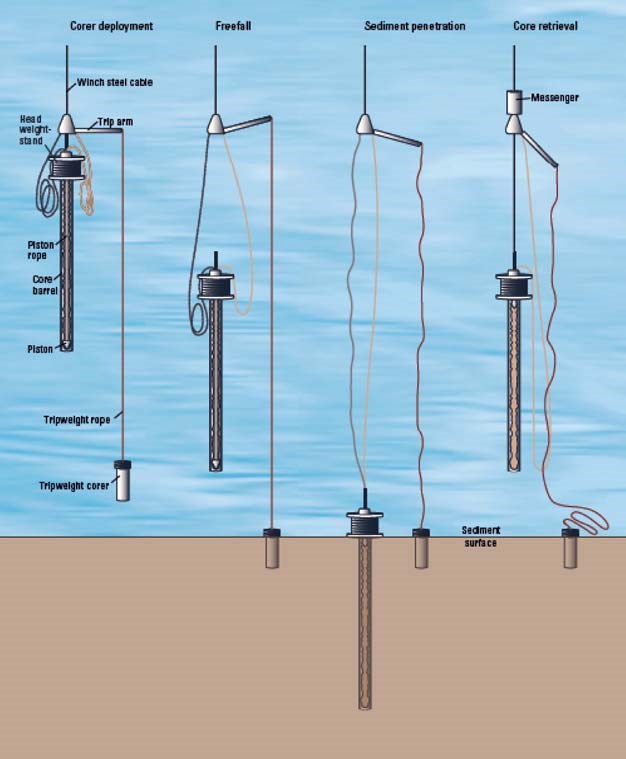
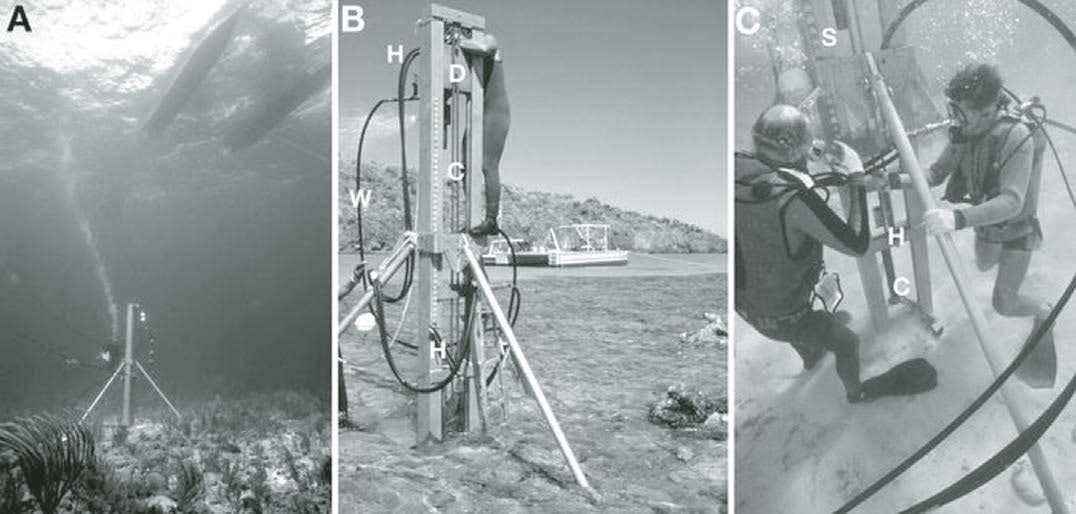
Methodology. There are several types of equipment available for coring of unconsolidated sediment from the seafloor. Vibracoring is probably the most widely used. Vibracoring rigs can be diver operated (Fig. 12), which work very well in limited water depths, usually shallower than 50 feet. For deeper water, a ship-borne vibracorer is necessary, and the Alpine Vibracoring system is the most used (Fig. 13). A mini-vibracoring system designed by Sea Surveyor (Fig. 14) is available for collecting 5′ to 15′ sediment cores from small, shallow-draft vessels. It is easy to transport to remote sites. For very muddy sediments, a piston core works best (Fig. 15). See Lanesky, et al. (1979) and Watson and Krupa (1984) for detailed background information.
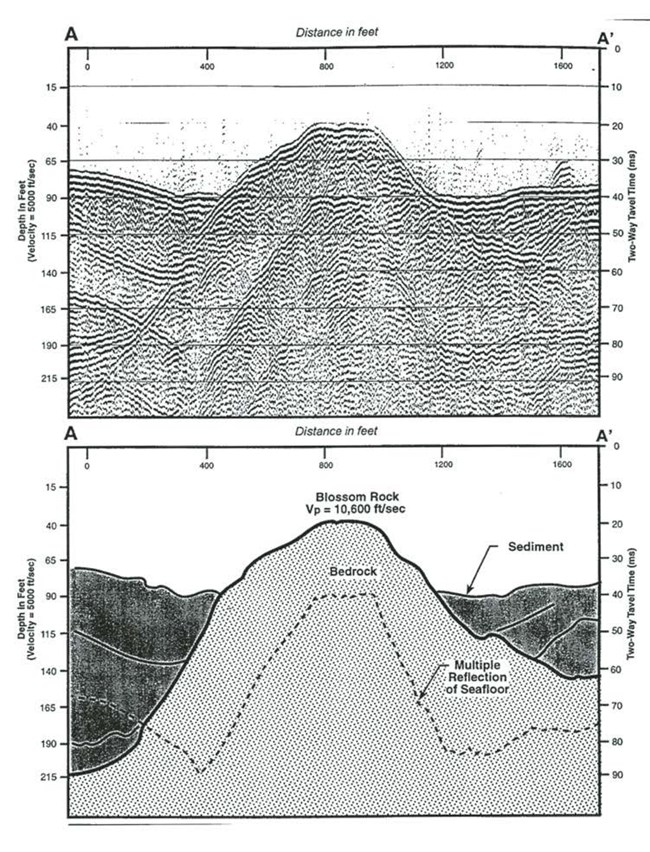
Remote sensing techniques can also be used, primarily subbottom profiling. These various seismic techniques are available in many frequencies and powers. The higher the frequency, the greater the resolution, but high resolution sound signals are subject to higher attenuation, so depth of penetration is limited. Lower frequency signals have greater penetration but decreased resolution. High power signals increase penetration but the equipment is more expensive. The tradeoffs must be decided based on the local resources. A high resolution subbottom profiler is shown in Figure 16. From a high-resolution survey and local geologic knowledge an interpretation of the subbottom can be made (see Fig. 17.)
Timing. Timing should be as needed and possibly just before and after major storms.
Complexity. Coring is very complex.
Cost. Coring is very expensive. Partnering is suggested.
Timing. Timing should be as needed and possibly just before and after major storms.
Complexity. Coring is very complex.
Cost. Coring is very expensive. Partnering is suggested.
Vital Sign 5: Substrate
Definition. Substrate is sea bottom composition. It may be mud, sand, gravel, or rock; this is the composition of the material on the seafloor itself, which may also include stratigraphy below the seafloor. Observation and analytical techniques are the same techniques discussed for unconsolidated offshore barriers above.
Significance. The seafloor may be covered by plants or animals adapted to only one substrate type. Changes in substrate, such as mud covering a sandy bottom, or sea grass flourishing on a sandy bottom being killed by pollution, may have a negative impact on marine communities.
In addition, however, a portion of the seabottom in the area of interest may be covered by sea grass. Expanses of grasses such as eel grass or turtle grass are critical habitats for juvenile fin and shell fish. Changes in extent of grasses can be caused by storms, changes in sediment input, or human activity. Monitoring of seagrass beds is high priority and can easily be done with direct observations, air photos, or even from satellite images in many cases, if the expanse of sea grass is large enough. See also the discussion of reef and other barriers above. The remote sensing techniques will be essentially the same.
Instead of soundings from a boat, another simple method of monitoring bathymetric changes plus making observations about the depth of sediment movement can be done using steel rods emplaced on a grid system or on a profile. Detailed observations made before and after a storm, or at some regular intervals (seasonally, for example) can provide adequate information on sediment dynamics at the points of study (Greenwood and Mittler, 1984). This is a very inexpensive method, but does require diving expertise. Its advantage is being able to show the immediate event effects as well as recovery and changes over time.
Many of the techniques previously discussed are also applicable to substrate sampling and monitoring. See USGS (2000) for a list of common sediment sampling devices and references to key work. The Open-File Report is available at http://pubs.usgs.gov/of/2000/of00-358/. Also, the NOAA Coastal Services Center Web site has information on benthic habitat mapping at http://www.csc.noaa.gov/benthic/, and sediment sampling at http://www.csc.noaa.gov/benthic/mapping/techniques/sampling.htm.
Level 1: Observations by Snorkelers
These simple, direct observations are the same as discussed previously.
Equipment required. Cameras, boats, and notebooks are needed.
Methodology. The method is the same as above, with simple occupation of known locations, photographic documentation, and note taking.
Timing. Timing should be quarterly or yearly at least, and after major storms.
Complexity. This method is very simple.
Cost. The cost is low.
Level 2: Map Distribution from Available Air Photos
Sea-grass beds and other types of substrate should be readily observable on low-altitude air photos, which should be available from the USGS or NOAA or other sites. For site-specific studies, consider high resolution side scan sonar surveys. Air photo approaches are discussed in the case study on Pleasant Bay, Massachusetts, later in this chapter.
Equipment required. Air photos and tracing paper are needed, and/or digitizing equipment, if available.
Methodology. The simplest method is to trace the expanse of sea-grass beds onto tracing paper. Alternately, if resources are available, air photos can be georeferenced and the expanse of sea-grass beds digitized. This is a superior method as it produces instant results of areas and makes changes easy to quantify and track.
Timing. Timing should be yearly and before and after major storms.
Complexity. This method is not overly complex. The digital approach requires knowledge of geographic information system (GIS) software.
Cost. If geospatial analysis equipment is available, cost is relatively low except for air photos, which may be available at low or no cost from collaborators.
Level 3: Distribution from Studies using Digital Remote Sensing Techniques
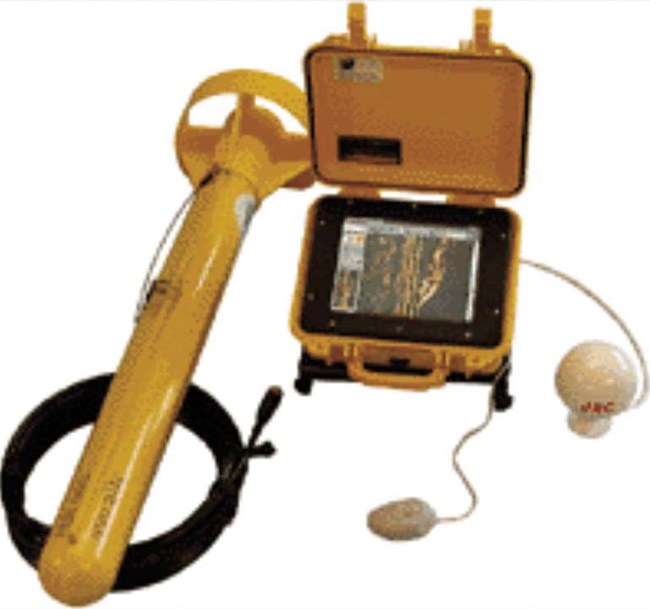
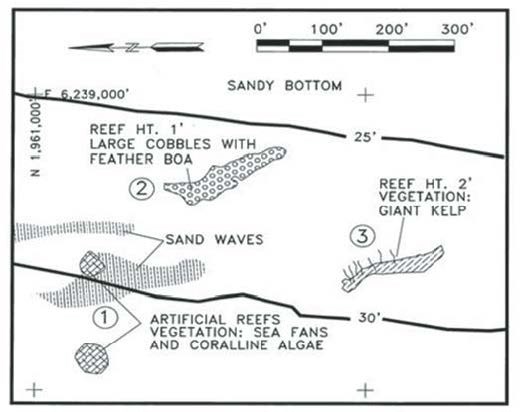
Changes of sediment and other substrate can be observed from satellite images in many cases as discussed above. For seagrass changes, if the expanse of beds to be studied is larger than the resolution of readily available satellite images (30 m), then this is a reliable method to monitor changes. This is especially true if satellite imagery is available for free from collaborators or from the USGS AmericaView Program, or if it already has been obtained for other uses. High-resolution side-scan sonar equipment (Fig. 18) can produce highly accurate charts showing the spatial distribution and density of different species of marine vegetation, as well as water depth, sediment type, and size and shape of reefs (Fig. 19).
Equipment required. Satellite imagery is needed instead of air photos. Side-scan sonar and ancillary equipment, if available, are also required.
Methodology. Processing of satellite images as discussed previously requires a great deal of expertise in order to make sure the sea grasses can be observed in the greatest detail possible.
Timing. Timing should be yearly and/or before and after major storms.
Complexity. Processing of satellite imagery and GIS manipulation of data is highly complex.
Cost. The cost of geospatial analysis and equipment is high.
Vital Sign 6: Water Column Turbidity
Definition. Water column turbidity is solid particles suspended in the water. These particles may be inorganic (fine sediment, ash, dust) or organic (plankton, etc.).
Significance. Increased turbidity, if caused by sediment, may be an indicator of event-related resuspension of sediment, or influx of sediment, or degrading conditions caused by increased runoff from land over time. If caused by plankton, it may be a sign of algal blooms or even red tides.
It is possible to make observations of water turbidity from satellite data. A USGS study of resuspension of sediment by storms and the subsequent changes of water clarity in Florida Bay is available as part of the South Florida Information Access (SOFIA) project at http://sofi a.usgs.gov/projects/sed_turbidity/.
Level 1: Secchi Disks to Measure Water Clarity
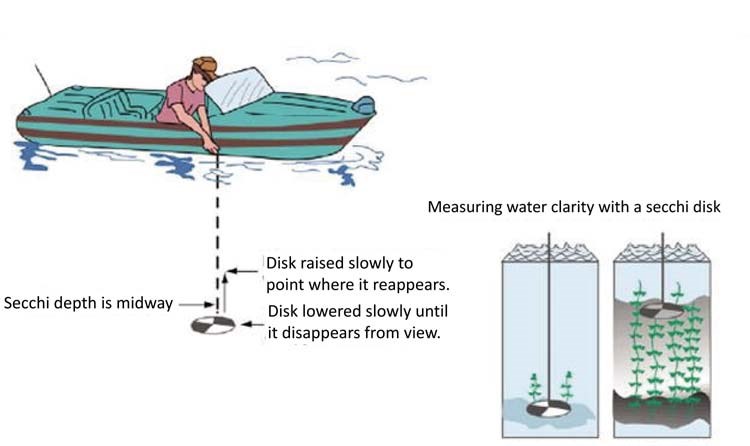
This is a very simple approach, wherein the limit of the disk’s visibility is recorded in a log book. The U.S. Environmental Protection Agency has a factsheet about Secchi Disks. The Secchi Disk was developed by P.A. Secchi in 1865 for a Vatican-financed Mediterranean oceanographic expedition and is still in use. It is a weighted circular disk with alternating black and white painted quadrants. The disk is lowered into the water until it is no longer visible and that depth is read from a graduated rope (Fig. 20). Secchi disks are easy to make and use, and can involve students and community volunteers. See http://www.epa.gov/owow/lakes/month/pdf/dip_factsheet.pdf for more information.
The U.S. Environmental Protection Agency has information on the technique and also on a nationwide volunteer program to record Secchi depths. See http://www.epa.gov/volunteer/.
Equipment required. A boat, Secchi disk, and a log book are needed.
Complexity. This method is very simple.
Cost. The cost is very low. The disk can be made instead of purchased.
Level 2: Handheld Turbidity Meters
Handheld turbidity meters can be used in a variety of applications. Some models will also sample salinity and other water quality characteristics.
Equipment required. A meter and snorkeling/diving gear are needed.
Methodology. The method involves simple metering and recording.
Timing. This should be performed as needed.
Complexity. This method is very simple.
Cost. The cost is moderate, as meters can be around $1,000.
Level 3: Permanently Installed and Continuously Recording Turbidity Meters
If turbidity needs to be continuously monitored, some sort of permanently installed, heavy-duty equipment is needed. This will rarely be the case, but if so, an array that also measures water temperatures, currents, pressure, suspended sediment, etc., as mentioned above, would be useful.
Equipment required. A bottom tripod array, or some variation, is needed.
Methodology. The device is deployed, monitored, and serviced as necessary.
Timing. The device will be recording continuously.
Complexity. This method is not overly complex, except for equipment maintenance.
Cost. The cost of this method is high.
Vital Sign 7: Water Column Chemistry and Quality
Definition. Water column chemistry and quality involves the dissolved solids and gases in the water.
Significance. This measurement is significant because the dissolved chemicals may influence the health and vitality of plants and animals living in the water. This is bordering on the edge of being outside the realm of geologic studies. A good comprehensive overview of techniques is given by the U.S. Geological Survey’s National Field Manual for the Collection of Water-Quality Data, which can be viewed online at http://water.usgs.gov/owq/FieldManual/. The techniques are the same as for turbidity (see above), except with slightly different equipment for measuring other attributes. Typically, however, the same or similar meters or devices can be used.
Level 1: Water Samples Taken by Hand
Basic qualities are measured with a pH meter, electrode (probe), and thermometer, and are recorded on a data sheet. Samples are taken by snorkelers or divers by hand. Samples could also be coupled with sediment sample retrieval, as described above. As many different types of sampling as possible that can be done simultaneously will give the greatest benefit for the lowest cost and time.
Equipment required. A low-cost multi-parameter meter is needed.
Methodology. Measurements should be taken in situ and recorded on a log sheet or in a workbook.
Timing. Timing should be as needed or as possible.
Complexity. The complexity level is low.
Cost. Initial investment for meter(s) may be moderate to high, but then this method is low cost.
Level 2: Meters with Digital Readouts, Recorded on a Data Sheet
Everything as described immediately above applies, but this method uses a more sophisticated meter, or set of meters. Equipment required. A low-cost multi-parameter meter and log sheets are needed.
Methodology. Measurements should be taken in situ and recorded on a log sheet or in a workbook.
Timing. Timing should be as needed or as possible.
Complexity. The complexity level is low.
Cost. Initial investment for meter(s) may be moderate to high, but then this method is low cost.
Level 3: Sophisticated Measurements with Automatic Recording Devices, Data Loggers
Automatic recording and downloading of digital data makes long-term monitoring much easier. It is also much easier to share data and use it for research.
Equipment required. High-quality recording equipment with data logging capability.
Methodology. The method is the same as discussed above; only the quality of the equipment is different.
Timing. Timing should be as needed or as possible.
Complexity. This is moderately complex, owing to the need for database creation and data downloading abilities.
Cost. The cost is moderate to high, depending on the type of meters and computer facilities.
CASE STUDIES
Two case studies are presented here: one carbonate and tropical, one siliciclastic and temperate. Buck Island reef is part of the Buck Island Reef National Monument in St. Croix, U.S. Virgin Islands. Pleasant Bay sits just west of Nauset Spit, on the southeastern part of the Cape Cod National Seashore, Massachusetts. The stressors on each setting will be different, as will the sampling and monitoring techniques.
Case Study: Buck Island Reef, U.S. Virgin Islands
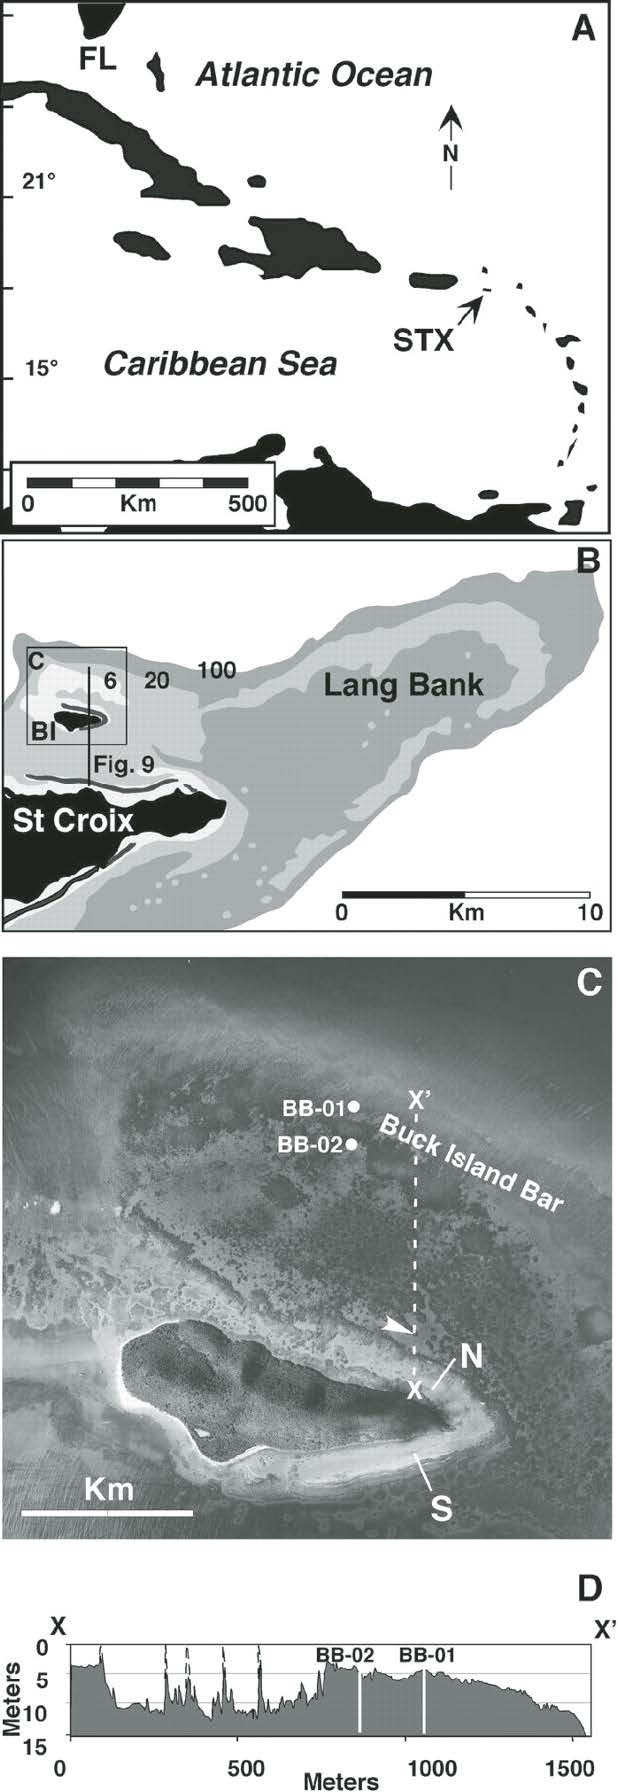
Buck Island Reef National Monument, U.S. Virgin Islands, lies Buck Island, is located ~1.5 miles north of St. Croix. The park was established in 1961 and expanded in 2001. It is one of only a few fully marine protected areas in the National Park System. The reef began developing on a preexisting ridge during lower sea level almost 10,000 years ago (Hubbard et al., 2005). The modern reef is dominated by elkhorn coral, Acropora palmata (Bythell et al., 1989). Many of the corals are degraded by White Band disease, an affliction that causes loss of tissue creating a line or band of bare white coral skeleton (Gladfelter, 1982). The corals still do grow rapidly, however, and produce large amounts of carbonate sediment which surround the reef (Gladfelter and Gladfelter, 1979).
Buck Island Reef National Monument is a jewel of the National Park System owing to its beauty and accessibility. Accessibility, however, is a double-edged sword, as human impacts have degraded the reef. A National Park Service Geologic Resource Management Issues Scoping Survey (Hall, 2005) identified four significant geologic issues at the park:
1. Coastal and Marine Features and Processes
a. Sediment Characteristics
b. Boating Hazards
c. Oceanographic Variables
d. Benthic Habitat Mapping
2. Recreational Impacts
3. Windblown Features and Processes
4. Seismic Activity
The U.S. Geological Survey monitors seismic activity in the Caribbean, including the U.S. Virgin Islands. The remainder of the geologic issues have been evaluated by various researchers over the years (see, for example, Gladfelter et al., 1977, 1978; Gladfelter and Gladfelter, 1979; Hubbard 1986; Bythell et al., 1989; Hubbard, 1992; Hubbard et al., 2005).
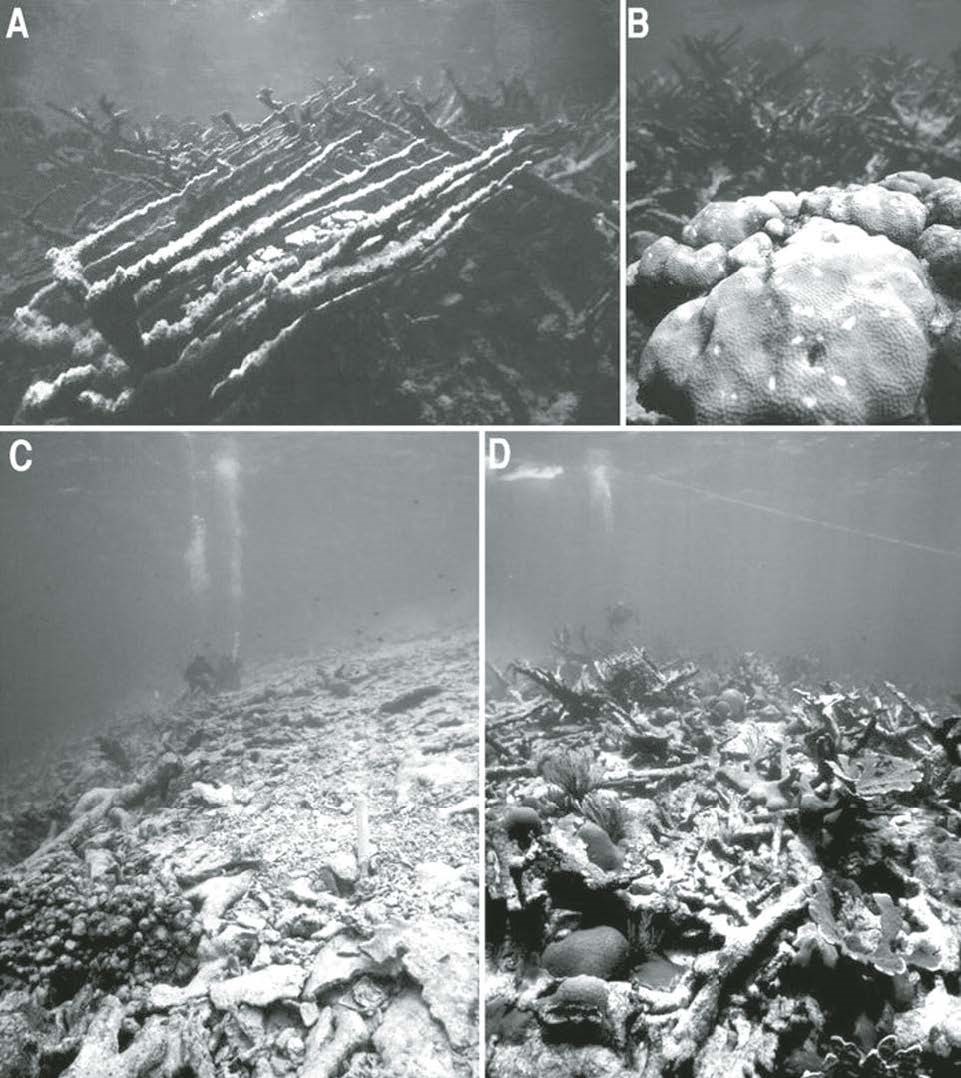
Holocene reef development of the Buck Island reef is reported by Hubbard et al. (2005). Study area location, bathymetry, and aerial photograph of the reef are shown in Figure 21. That study reports on several sampling techniques appropriate for monitoring modern reef vitality, especially coring and photography of the reef surface. Coring was done using the SCARID drilling system (Fig. 22). Core locations were done in early work using triangulation by sextant, shore ranges, and direct measurements from features identifiable on topographic maps. Recent locating was done using GPS. Water depth, substrate mapping,
and bottom features were identifi ed along regular intervals along two cross-reef transects to identify benthic community boundaries. The character of the substrate (sand, pavement, or mixed) and the major coral types (branching or dominant species or genera) were identified (see Hubbard et al., 2005, their fig. 2). Photo documentation of coral types and reef setting is shown in Figure 23.
Reef Check Foundation
An organization worth looking into is the international nonprofit Reef Check Foundation. Founded in 1996, its goal is to aid conservation of tropical coral reefs and California rocky reefs. Their offices are in Los Angeles, and they have volunteer teams in over 80 countries. Reef Check’s goals include focusing on public education on the importance of reef and current marine stressors, training volunteers in scientific monitoring methods, building public and private partnerships, and stimulating action.
In just a little over a decade, Reef Check has been successful in helping fishermen in St. Lucia increase local fish stocks, guiding the Hong Kong government in monitoring coral reef health, and collaborating with the Global Coral Reef Monitoring Network in scientific publication of its findings. The Reef Check Web site is http://www.reefcheck.org/default.php.
While their monitoring focuses more on biologic impacts, as noted previously reef biology and geology are intertwined. The Reef Check monitoring protocol is available at http://www.reefcheck.org/rcca/monitoring_protocol.php. Also, a global assessment of human effects on coral reefs is available at http://www.reefcheck.org/about_RC_Reef/publications/mpb.pdf. See also Hodgson (1999). The Reef Check California Monitoring Protocol (Shuman, 2007) is available at http://www.reefcheck.org/PDFs/2007_RC_CA_Protocol.pdf. The monitoring protocol for Hawaii (Hodgson and Stepath) is available at http://www.reefcheck.org/about_RC_Reef/publications/monitoring2.pdf.
Case Study: Pleasant Bay, Massachusetts
R. Jude Wilber, president of Capella Consulting Group, a marine environmental science and engineering firm in Falmouth, Massachusetts, devised a sampling program for Pleasant Bay that is precisely the sort that could be of great use to monitoring nearshore environments in many other settings. The Pleasant Bay discussion and documentation is provided courtesy
of Dr. Wilber.
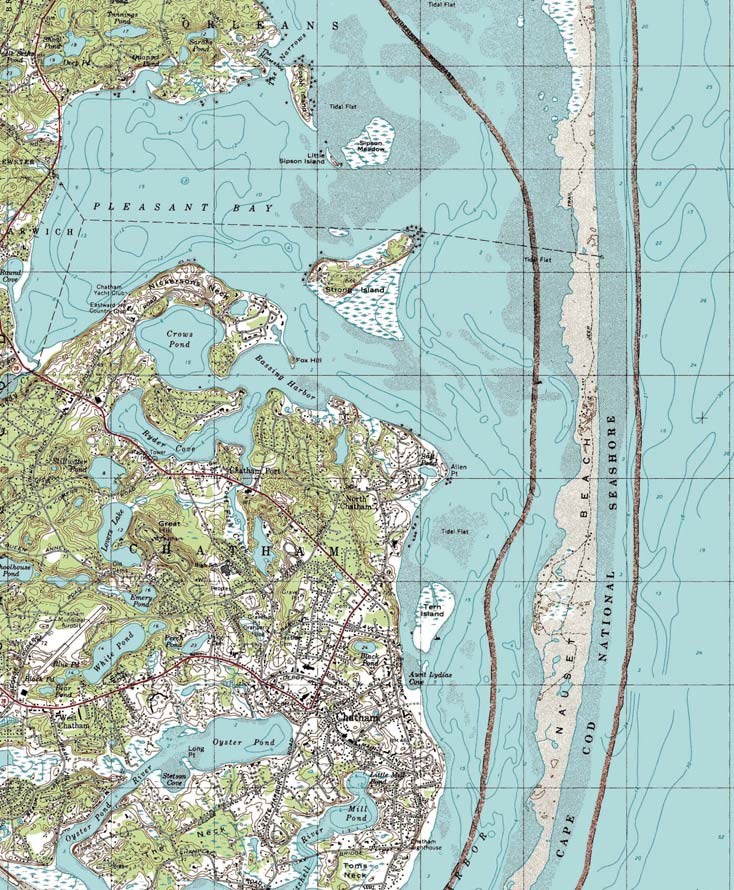
Pleasant Bay is a small, tidally influenced estuary in eastern Massachusetts. It is bounded on the east by Nauset Spit, which is part of the Cape Cod National Seashore. Nauset Spit separates Pleasant Bay from the Atlantic Ocean (Fig. 24). It is a siliciclastic temperate system. Nauset Spit builds to the south, controlled by longshore transport of sediment. As the spit builds, the tidal channel connection to Pleasant Bay from the Atlantic Ocean moves southward. Occasionally, storm processes breach the spit, relocating the tidal inlet back toward the north, thus again changing the location of the focus of tidally dominated sediment movement in the bay. In addition to an interesting and varied sedimentological history, the bay also has a diverse fauna. It is dominated by eel grass beds which are nursery grounds for juvenile and adult fin fish and shellfish, as well many other types of organisms. A particularly noteworthy relationship between extent of eel grass beds and bioturbation by horseshoe crabs has been observed and documented. A decrease in the extent of eel grass beds, both by biological bulldozing by horseshoe crabs and demise owing to pollution, reduces the vitality of the estuary and its natural nursery ground effectiveness.
A simple monitoring and documentation approach was used in Pleasant Bay, just landward of the Cape Cod National Seashore in Massachusetts, in a study for the Pleasant Bay Alliance. First, a reconnaissance study was done from aerial photographs, followed by field sampling and surveying. Field observations were compared back to the original photograph survey. Any questions or inconsistencies that arose were checked with another field survey. The process continued back and forth between photos and field until all questions were answered. This approach works well only when the field area is readily accessible, and the project can be broken down into lab/field segments.
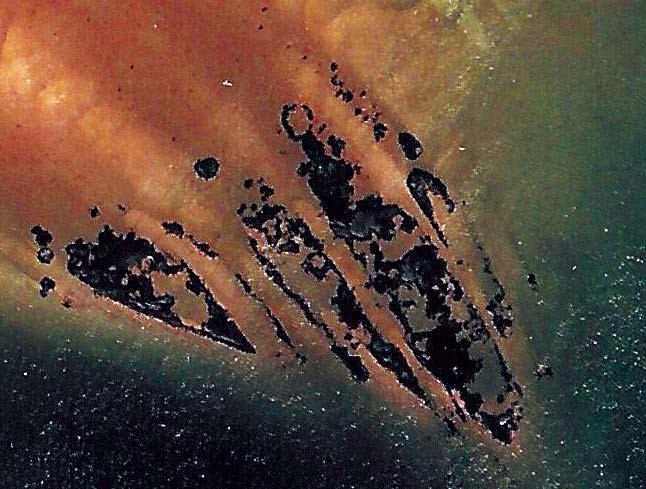
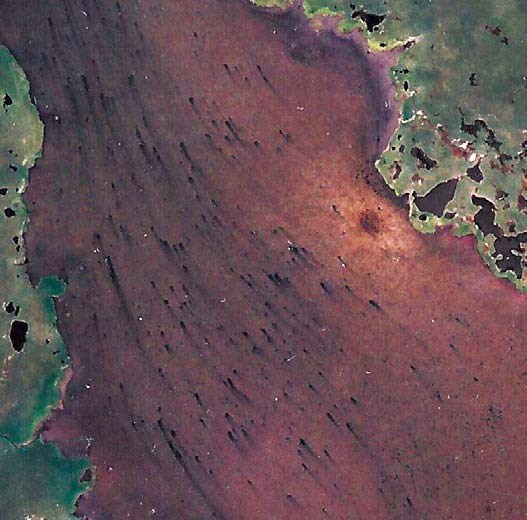
The method approach described above was used to map horseshoe crab density as well as ebb tidal flow patterns and sediment characteristics in Pleasant Bay. A gathering of horseshoe crabs is clearly visible in Figure 25. The elongated black spots are individual horseshoe crabs in action bulldozing their way through the surficial sediment. The photo was taken on an ebb tide and as the water drops, the crabs burrow into the substrate for protection. In this case the upper sediment is buff-colored, indicating an oxic environment. Sediment sampling reveals that a few centimeters below the surface the sediment becomes black in color, indicating anoxic conditions. Thus each dot represents a crab pit, and the “tails” are the stirred-up anoxic sediments being transported by the ebb tide; each is like a little flow vector. (Photo and description courtesy of R. Jude Wilber.) Figure 25 is just a tiny fraction (~1/100th of the original photo in area) of a highaltitude vertical aerial photograph. Just that tiny fraction of this one image provides a lot of information on sediment oxidation state, distribution and behavior of horseshoe crabs, and ebb-tidal flow field.
The air photo survey/field evaluation cycle was used to interpret the biocultivation impact of horseshoe crabs in Pleasant Bay. From the aerials an unusual site lacking any small bedforms was identified. The bay bottom had a distinct brown coloration not found anywhere else. A field investigation revealed hundreds of horseshoe crabs in intertidal setting. The area was sampled through a low tide interval. It was found that the crabs (Fig. 26) burrow into the substrate and bioturbated the sediments, which are anoxic. In so doing, the sediments are oxidized, allowing a hundred-fold increase in infaunal organisms—mostly polycheates and other worms. Worms are a major food source for crabs. Thus, the burrowing (as protection from dessication) leads to bio-cultivation (farming) of food source. This interesting monitoring story illustrates the need to protect this particular acreage.
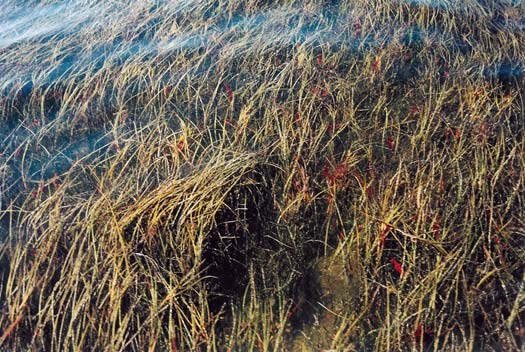
Another important component of the floor cover of Pleasant Bay is eelgrass. Marine eelgrass (genus Zostera) is common in shallow bays and estuaries in temperate environments. As with most plants in such settings, eelgrass is an important environment for juvenile and adult forms of many shell fish and fin fish. Decrease in eelgrass bed area is a serious problem along the U. S. Atlantic coast and can be attributed to pollution, human activities, and even destruction by biocultivation by organisms sharing the habitat. Such is the case for eelgrass beds in Pleasant Bay where biocultivation by horseshoe crabs is responsible, at least in part, for the demise of the beds.
As above, an unusual seafloor pattern was first observed in air photos. After field investigation it was determined that eelgrass bed degradation was the result of two mechanisms. The dark patches in Figure 27 are the Zostera. The bed had been dissected (linear cuts) due to flood tidal jetting of sediment from bottom to top, and possible ebb-tidal action as well. In addition, there was “ring rot” happening here. The eelgrass was dying back from the inside out, leaving circular holes and, in the extreme, isolated rings of grass. Using a baseline image like this one can proceed to monitoring in the field for timing and processes as this patch wastes away.
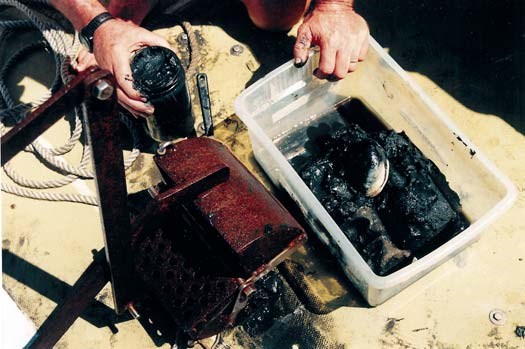
A very simple sediment sampling device for grabbing a sample from a small boat can be made by nailing a bucket to a length of 2 × 4 lumber. Dubbed “WiBSAP,” the Wilber Benthic Sampling Apparatus, it is hard to beat for the price (Fig. 28). Sediment samples from deeper water (20 feet) anoxic basins within Pleasant Bay were taken using a Van Veen grab sampler. These samples reveal an almost gelatin-like anoxic sediment (Fig. 29). The air photo/field survey cycle here addressed both flora and fauna. It was found that: (1) full-blown anoxia conditions existed from the bottom down; thus, (2) there was no infauna or anything that feeds on such (i.e., crabs); (3) Mercenaria clams (quahogs) occasionally were present since they are filter feeders and suck in the phytoplankton detritus; (4) the deep basins were sinks for the macro-flora produced in the eel grass beds and salt marshes; and (5) this was especially true of the eel grass and the deep basin where a black organic gel largely from the decomposition of Zostera was present. Also, there are large stands of healthy Zostera beds with 100% coverage (Fig. 30).
CONCLUSIONS
The nearshore marine environment is a dynamic and complex system. Extending from the low tide water level out to the edge of the continental or insular shelves, it encompasses a range of water depths from essentially zero to 120 m or more. The nearshore is acted upon by a wide range of forces, including wind, tides, gravity, waves, and biologic effects including human impact. Water temperature range is as variable as can be observed in any marine system, owing to seasonal and eventrelated impacts on the shallow water column. The nearshore is a photosynthetic-based ecosystem, so the health and vitality of its fauna is highly sensitive to land-based impacts on water quality, including turbidity and pollutants.
In order to properly manage public lands in a nearshore setting it is prudent to thoroughly monitor several vital signs. Fortunately, high-quality baseline studies and monitoring can be undertaken at modest costs and performed by relatively unskilled and/or student observers. Although highly sophisticated, high-technology monitoring and historical analysis techniques are available as a means of collecting baseline data for nearshore management and policy determinations, there are also many scientifically valid, simple tools available, both qualitative and quantitative.
A broad range of costs, expertise, and complexity of methodologies is available for use in monitoring the nearshore, based on the resources of the overseeing agency or department. Table 1 summarizes the monitoring techniques discussed in this chapter. The references cited and the bibliography of suggested reading give many more sources of information.
ACKNOWLEDGMENTS
I would like to thank R. Jude Wilber for supplying his Pleasant Bay information and photos. Thanks also to Sea Surveyor, Inc., Benicia, California, specifically to Steve Sullivan, for generously supplying photos, figures, and descriptions of their various methods and examples of hydrographic surveys, marine geophysical investigations, vibracoring, and other oceanographic sampling techniques. Dennis Hubbard kindly allowed use of his figures and photos of his Buck Island reef studies.
REFERENCES CITED
Allen, J.R.L., 1982, Sedimentary Structures, Their Character and Physical Basis: Developments in Sedimentology, 30 A and B: Amsterdam, Elsevier, A: 593 p., B: 663 p.
Barnhardt, W.A., Kelley, J.T., Dickson, S.M., and Belknap, D.F., 1998, Mapping the gulf of Maine with side-scan sonar: a new bottom-type classifi cation for complex seafloors: Journal of Coastal Research, v. 14, p. 646–659.
Bascom, W., 1980, Waves and Beaches: New York, Anchor Books, 366 p.
Berger, A.R., 1996, The geoindicator concept and its application: an introduction, in Berger, A.R., and Iams, W.J., eds., Geoindicators: Assessing Rapid Environmental Changes in Earth Systems: Rotterdamn, A.A. Balkema, p. 1–14.
Berger, A.R., 1997, Assessing Rapid Environmental Changes Using Geoindicators: Environmental Geology, v. 32, no. 1, p. 36–44, doi: 10.1007/s002540050191.
Bush, D.M., and Young, R., 2009, this volume, Coastal features and processes, in Young, R., and Norby, L., eds., Geological Monitoring: Boulder, Colorado, Geological Society of America, doi: 10.1130/2009.monitoring(03).
Bythell, J.C., Gladfelter, E.H., Gladfelter, W.B., French, K.E., and Hillis, Z., 1989, Buck Island Reef National Monument—Changes in modern reef community structure since 1976, in Hubbard, D.K., ed., Terrestrial and marine geology of St. Croix, U.S. Virgin Islands, Special Publication Number 8, West Indies Laboratory: Christiansted, St. Croix, U.S. Virgin Islands, p. 145–153.
Carter, R.W.G., 1988, Coastal Environments: An Introduction to the Physical, Ecological and Cultural Systems of Coastlines: San Diego, Academic Press, 617 p.
Carter, R.W.G., and Woodroffe, C.D., 1994, Coastal Evolution: Late Quaternary Shoreline Morphodynamics: Cambridge University Press, 517 p.
Davis, R.A., Jr., ed., 1985, Coastal sedimentary environments, Second edition, New York, Springer-Verlag, 716 p.
Douglas, B.C., Kearney, M.S., and Leatherman, S.P., 2001, Sea Level Rise: History and Consequences: San Diego, Academic Press, 232 p.
Dunham, R.J., 1970, Stratigraphic reefs versus ecologic reefs: The American Association of Petroleum Geologists Bulletin, v. 54, p. 1931–1932.
Fletcher, C.H., III, and Wehmiller, J.F., eds., 1992, Quaternary Coasts of the United States: Marine and Lacustrine Systems: SEPM (Society for Sedimentary Geology) Special Publication No. 48, 450 p.
Gardner, J.V., Field, M.E., and Twichell, D.C., eds., 1996, Geology of the United States Seafloor: The View from GLORIA: Cambridge University Press, 371 p.
Gardner, T.A., Côté, I.M., Gill, J.A., Grant, A., and Watkinson, A.R., 2003, Long-Term Region-Wide Declines in Caribbean Corals: Science, v. 301, p. 958–960, doi: 10.1126/science.1086050.
Gladfelter, W.B., 1982, White-band disease in Acropora palmata: Implications for the structure and growth of shallow reefs: Bulletin of Marine Science, v. 32, p. 639–643.
Gladfelter, W.B., and Gladfelter, E.H., 1979, Growth and total carbonate production by Acropora palmata on a windward reef, in Gladfelter, W.B., Gladfelter, E.H., Monahan, R.K., Ogden, J.C., and Dill, R.F., eds., Environmental studies of Buck Island Reef National Monument, U.S. National Park Service Rep., p. iii–8.
Gladfelter, W.B., Gladfelter, E.H., Monohan, R.K., Ogden, J.C., and Dill, R.F. 1977, Environmental studies of Buck Island Reef National Monument: National Park Service Report, 144 p.
Gladfelter, E.H., Monahan, R.K., and Gladfelter, W.B., 1978, Growth rates of five reef-building corals in the northeastern Caribbean: Bulletin of Marine Science, v. 28, no. 4, p. 728–734.
Goreau, T.F., Goreau, N.I., and Goreau, T.J., 1979, Corals and coral reefs: Scientific American, v. 241, no. 2, p. 124–125, 128–136.
Gorman, L., Morang, A., and Larson, R., 1998, Monitoring the coastal environment; Part IV: mapping, shoreline changes, and bathymetric analysis: Journal of Coastal Research, v. 14, p. 61–92.
Greenwood, B., and Mittler, P.R., 1984, Sediment fl ux and equilibrium slopes in a barred nearshore: Marine Geology, v. 60, p. 79–98, doi: 10.1016/0025-3227(84)90145-2.
Hall, K.N., 2005, Buck Island Reef National Monument: U.S. National Park Service Geologic Resource Management Issues Scoping Summary, Geologic Resource Evaluation, September 1, 2005, 9 p.
Hayes, M.O., 1967, Hurricanes as geological agents, south Texas coast: American Association of Petroleum Geologists Bulletin, v. 51, no. 6, Part 1, p. 937–942.
Hodgson, G., 1999, A Global Assessment of Human Effects on Coral Reefs: Marine Pollution Bulletin, v. 38, no. 5, p. 345–355, doi: 10.1016/S0025-326X(99)00002-8.
Hodgson, G., and Stepath, C.M., undated, Using Reef Check For Long-term Coral Reef Monitoring in Hawaii: Available at http://www.reefcheck.org/about_RC_Reef/publications/monitoring2.pdf [accessed 29 January 2009].
Hubbard, D.K., 1986, Sedimentation as a control of reef development, St. Croix, U.S. Virgin Islands: Coral Reefs, v. 5, no. 3, p. 117–125, doi: 10.1007/BF00298179.
Hubbard, D.K., 1992, Hurricane-induced sediment transport in open-shelf tropical systems: an example from St. Croix, U.S. Virgin Islands: Journal of Sedimentary Petrology, v. 62, no. 6, p. 946–960.
Hubbard, D.K., Zankl, H., Van Heerden, I., and Gill, I.P., 2005, Holocene Reef Development Along the Northeastern St. Croix Shelf, Buck Island, U.S. Virgin Islands: Journal of Sedimentary Research, v. 75, no. 1, p. 97–113, doi: 10.2110/jsr.2005.009.
Jameson, S.C., Erdmann, M.V., Gibson, G.R., Jr., and Potts, K.W., 1998. Development of biological criteria for coral reef ecosystem assessment: U.S. Environmental Protection Agency, Office of Science and Technology, Health and Ecological Criteria Division, Washington, D.C., 107 p.
Kaye, C.A., 1959, Shoreline features and quaternary shoreline changes, Puerto Rico: U.S. Geological Survey Professional Paper 317-B, p. 49–140.
Komar, P.D., 1997, Beach processes and sedimentation, second edition: Upper Saddle River, New Jersey, Prentice Hall, 544 p.
Lanesky, D.E., Logan, B.W., Brown, R.G., and Hine, A.C., 1979, A new approach to portable vibracoring underwater and on land: Journal of Sedimentary Petrology, v. 49, p. 654–657.
Larson, R., Morang, A., and Gorman, L., 1997, Monitoring the coastal environment; Part II, Sediment sampling and geotechnical methods: Journal of Coastal Research, v. 13, no. 2, p. 308–330.
Lewis, D.W., and McConchie, D.M., 1994, Practical Sedimentology, second edition: New York, Springer, 213 p.
Lubin, D., Li, W., Dustan, P., Mazel, C.H., and Stamnes, K., 2001, Spectral signatures of coral Reefs: features from space: Remote Sensing of Environment, v. 75, p. 127–137, doi: 10.1016/S0034-4257(00)00161-9.
McMullen, K.Y., Poppe, L.J., Paskevich, V.F., Doran, E.F., Moser, M.S., Christmas, E.B., and Beaver, A.L., 2005, Surficial geologic interpretation and sidescan sonar imagery of the seafloor in west-central Long Island Sound, U.S. Geological Survey Open-File Report 2005-1018, http://woodshole.er.usgs.gov/openfi le/of2005-1018/ [accessed 29 January 2009].
Mehrtens, C.J., Rosenheim, B., Modley, M., and Young, R.S., 2001, Reef morphology and sediment attributes, Roatan, Bay Islands, Honduras: Carbonates and Evaporites, v. 16, no. 2, p. 131–140.
Morang, A., Larson, R., and Gorman, L., 1997a, Monitoring the coastal environment; Part I, Waves and currents: Journal of Coastal Research, v. 13, no. 4, p. 1064–1085.
Morang, A., Larson, R., and Gorman, L., 1997b, Monitoring the coastal environment; Part III, Geophysical and research methods: Journal of Coastal Research, v. 13, no. 4, p. 111–133.
Poppe, L.J., Paskevich, V.F., Moser, M.S., DiGiacomo-Cohen, M.L., and Christman, E.B., 2004, Sidescan Sonar Imagery and Surficial Geologic Interpretation of the Sea Floor off Branford, Connecticut: U.S. Geological Survey Open-File Report 2004-1003, http://pubs.usgs.gov/of/2004/1003/, [accessed 29 January 2009].
Rodríguez, R., Webb, W., Richard, M.T., and Bush, D.M., 1994, Another look at the impact of Hurricane Hugo on the shelf and coastal resources of Puerto Rico, USA: Journal of Coastal Research, v. 10, no. 2, p. 278–296.
Rogers, C.S., 1990, Responses of coral reefs and reef organisms to sedimentation: Marine Ecology Progress Series, v. 62, p. 185–202, doi: 10.3354/meps062185.
Schwab, W.C., Rodriguez, R.W., Danforth, W.W., Gowen, M.H., Thieler, E.R., and O’Brien, T.F., 1996, High-resolution marine geologic maps showing sediment distribution on the insular shelf off Luquillo, Puerto Rico: U.S. Geological Survey Miscellaneous Field Studies Map, MF-2276, 4 sheets.
Schwartz, M., ed., 2005, Encyclopedia of coastal science, New York. Springer, 1247 p.
Shuman, C.S., 2007. Reef Check California Monitoring Protocol 2007: http://www.reefcheck.org/PDFs/2007_RC_CA_Protocol.pdf [accessed 29 January 2009].
U.S. Coral Reef Task Force, 2000, The National Action Plan to Conserve Coral Reefs, Washington, D.C., 34 p.
U.S. Army Engineer Waterways Experiment Station, 1984, Shore Protection Manual (SPM): Vicksburg, Mississippi, Coastal Engineering Research Center, fourth edition, v. I and II.
U.S. Geological Survey, 2000, USGS East-Coast sediment analysis: procedures, database, and georeferenced displays: U.S. Geological Survey Open-File Report 00-358, http://pubs.usgs.gov/of/of00-358/ [accessed 29 January 2009].
U.S. Geological Survey, 2001, Coral reefs in Honduras: status after Hurricane Mitch: USGS Open File Report 01-133, http://coastal.er.usgs.gov/publications/ofr/01-133/ [accessed 29 January 2009].
USVI (U.S. Virgin Islands), 1976, Series of DCCA Environmental Fact Sheets: Government of the Virgin Islands, Division of Fish and Wildlife, Department of Planning and Natural Resources.
Watson, I., and Krupa, S., 1984, Marine drilling exploration-technical and environmental criteria for rig selection: Litoralia, v. 1, no. 1, p. 65–82.
Wilgus, C.K., Hastings, B.S., Ross, C.A., Posamentier, H.W., Van Wagoner, J., and Kendall, C.G.St.C., eds., 1988, Sea-level changes; an integrated approach, SEPM (Society for Sedimentary Geology) Special Publication No. 48, 407 p.
Williams, S., Jeffress, P.B., and Prager, E.J., 2000, U.S. Geological Survey Coastal and Marine Geology Research—Recent Highlights and Achievements: U.S. Geological Survey circular 1199, 36 p.
Wilson, J.L., 1975, Carbonate facies in geologic history: New York, Springer-Verlag, 471 p.
FURTHER READING
Bascom, W., 1980, Waves and Beaches: New York, Anchor Books, 366 p. (A discussion of beaches and coastal processes based on research dating to World War II to assist amphibious landings. This classic may be the original coastal text. Updated periodically, it is a “must read” for beginners.)
Berger, A.R., 1996. The geoindicator concept and its application: an introduction: in Berger, A.R., and Iams, W.J. eds., Geoindicators: assessing rapid environmental changes in earth systems: Rotterdam, A.A. Balkema, p 1–14. (Presents the geoindicator approach to environmental monitoring, the concept of monitoring processes that vary significantly on a human time scale, with the goal being information that is meaningful for environmental assessment. Includes reports on glacial and permafrost terrains, groundwater systems, coasts, deserts, lakes, wetlands, soils, and coral reef environments.)
Carter, R.W.G., and Woodroffe, C.D., 1994, Coastal evolution: late quaternary shoreline morphodynamics: Cambridge University Press, 517 p. (Quite involved and lengthy, but covers all aspects of nearshore and coastal systems. For the advanced user.)
Carter, R.W.G., 1988, Coastal environments: an introduction to the physical, ecological and cultural systems of coastlines: San Diego, Academic Press, 617 p. (An excellent text for almost all aspects of the coastal zone, although management of coastal environments is its emphasis.)
Fletcher, C.H., III, and Wehmiller, J.F., eds., 1992, Quaternary coasts of the United States: marine and lacustrine Systems: SEPM (Society for Sedimentary Geology) Special Publication No. 48, 450 p. (Technical review on geologic aspects of nearshore systems. For the advanced user.)
Fox, W.T., 1983, At the sea’s edge: an introduction to coastal oceanography for the amateur naturalist: Englewood Cliffs, New Jersey, Prentice-Hall, 317 p. (An excellent nontechnical, richly-illustrated introduction to coastal processes, meteorology, environments, and ecology.)
Komar, P.D., 1997, Beach processes and sedimentation, second edition: New York, Prentice Hall, 544 p. (Highly technical, but has great detail on nearshore processes. For the advanced user).
Schwartz, M., ed., 2005, Encyclopedia of coastal science, New York, Springer, 1247 p. (The undisputed new king of the topic. Extremely lengthy and very expensive, but it covers all aspects of coastal studies including the physical sciences, engineering, and even society and impacts.)
The following four journal articles comprise a series covering all aspects of monitoring the coastal environment. Published in the Journal of Coastal Research between 1997 and 1998, these four papers give a detailed background to the subject.
Gorman, L., Morang, A., and Larson, R., 1998, Monitoring the coastal environment; Part IV: mapping, shoreline changes, and bathymetric analysis: Journal of Coastal Research, v. 14, p. 61–92.
Larson, R., Morang, A., and Gorman, L., 1997, Monitoring the coastal environment; Part II, Sediment sampling and geotechnical methods: Journal of Coastal Research, v. 13, no. 2, p. 308–330.
Morang, A., Larson, R., and Gorman, L., 1997a, Monitoring the coastal environment; Part I, Waves and currents: Journal of Coastal Research, v. 13, no. 4, p. 1064–1085.
Morang, A., Larson, R., and Gorman, L., 1997b, Monitoring the coastal environment; Part III, Geophysical and research methods: Journal of Coastal Research, v. 13, no. 4, p. 111–133.