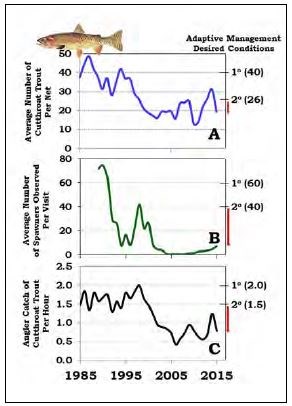
"All three lines of evidence suggest cutthroat trout abundance, although improving, remains well below recovery goals." from Arnold et al. 2017
Article
Fish Population Responses to the Suppression of Non-native Lake Trout

by Jeffrey L. Arnold, Phil D. Doepke, Brian D. Ertel, & Todd M. KoelUnprecedented actions are being taken on Yellowstone Lake to suppress lake trout, recover native cutthroat trout, and restore the natural character of the ecosystem. To understand the outcomes of these actions, long-term monitoring of the fish populations is conducted to inform an adaptive management strategy. Multiple lines of evidence are used to assess status and trends. For example, progress towards cutthroat trout recovery on Yellowstone Lake is measured annually by means of lake-wide assessments using gillnets, visual counts of spawning fish in tributary streams, and angler catch success. Each of these assessments is made annually to evaluate progress towards desired conditions for cutthroat trout. In this article, we describe the status and trends of native cutthroat trout and non-native lake trout following two decades of suppression on Yellowstone Lake.
Lake-Wide Cutthroat Trout Population Assessment
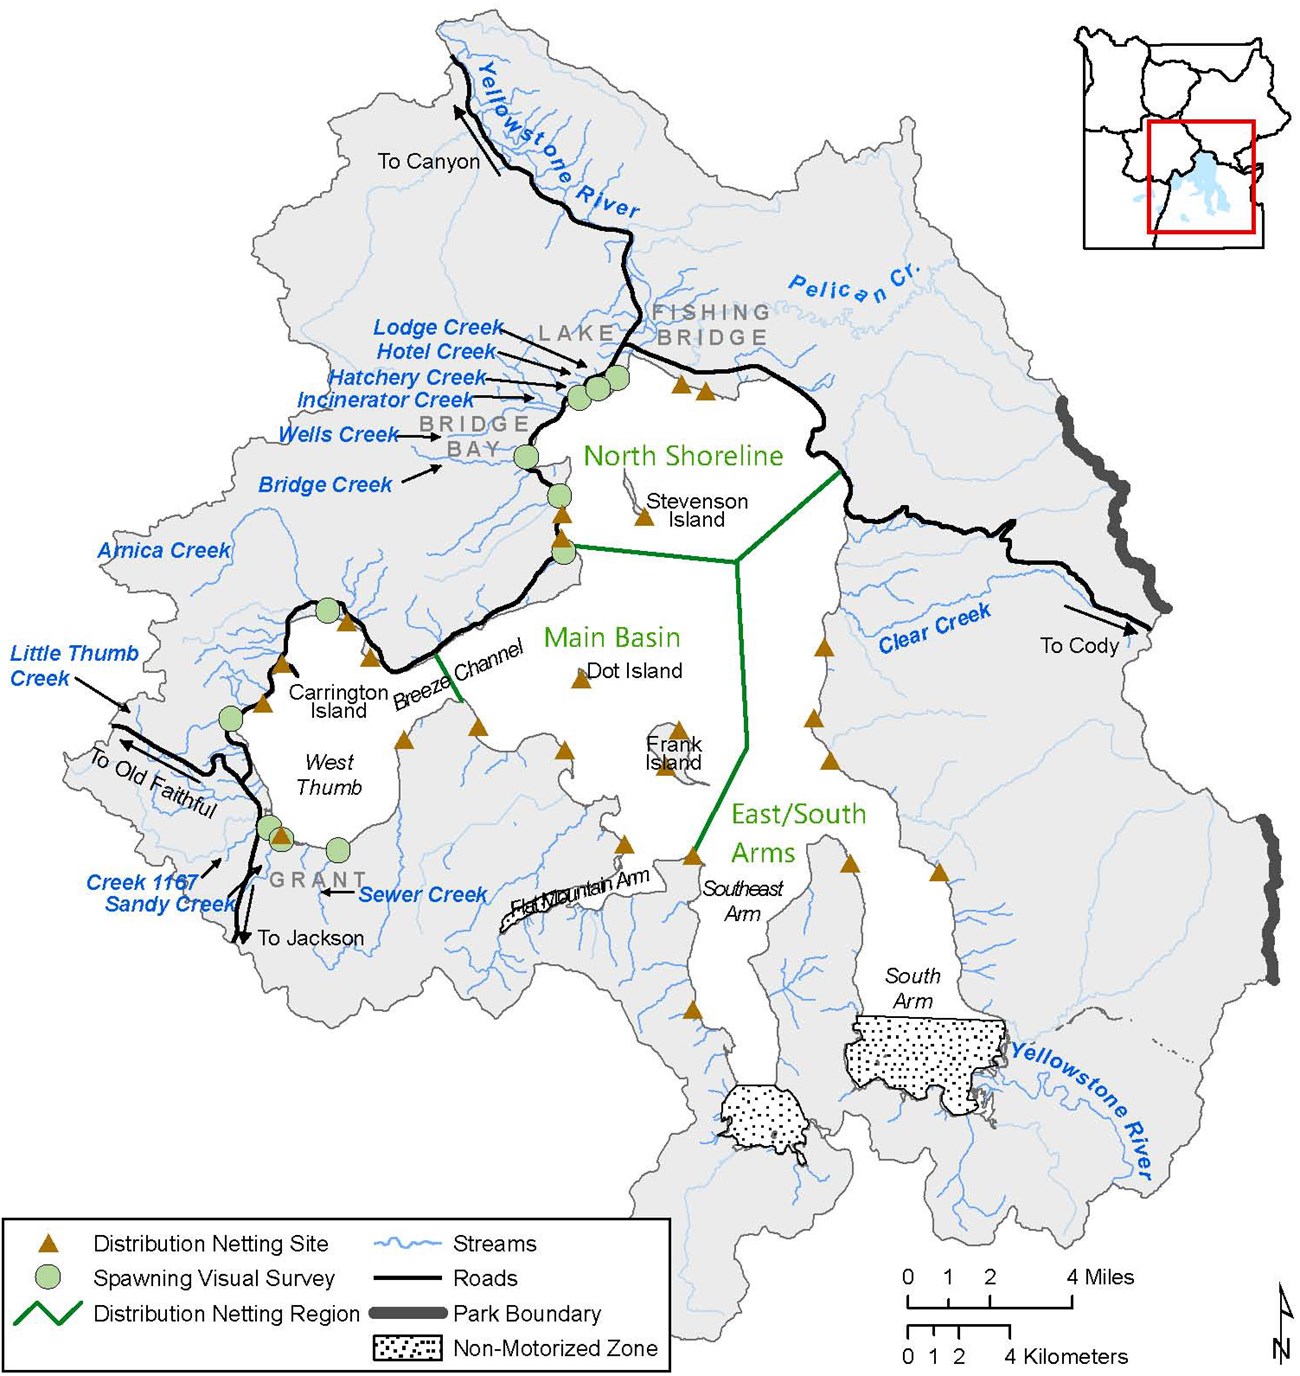
Within Yellowstone Lake, cutthroat trout population abundance and length structure are assessed by standardized gillnetting (Koel et al. 2005, Syslo et al. 2014). During the August distribution netting program, 24 sites are sampled within four regions of Yellowstone Lake, including the West Thumb, the main basin surrounding Dot and Frank islands, the northern shore and Stevenson Island, and the east shore and two southern arms (figure 1). At each sampling site, nets are set in shallow water near shore, at mid-depth (8-20 m [26-66 ft.]), and at more than 40 m (131 ft.) deep.


Lake-Wide Lake Trout Population Assessment
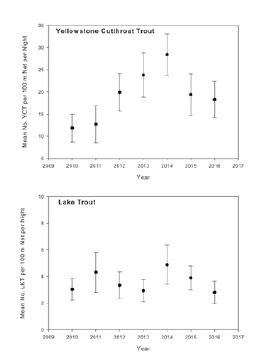
The number of lake trout caught during distribution netting remained relatively constant from 2010 to 2016, ranging from 331-575 fish annually, with a mean total length ranging from 309-330 mm (12-13 in.; figure 5). Over the past five years, we have seen a gradual decrease in the number of large lake trout measuring over 470 mm (18.5 in.), with most lake trout caught being 220- 420 mm (8.6-16.5 in.) in length and sexually immature (figure 5). Catch per unit effort for lake trout varied each year, but remained relatively consistent with no indication of a change in abundance (figure 3). In general, catches of lake trout were highest in the West Thumb region and along the east shoreline/southern arms portion of Yellowstone Lake, while the lake region with the lowest catch of lake trout was generally along the north shore (figure 4).Cutthroat Trout Tributary Spawner Assessment
Visual surveys for cutthroat trout have been conducted annually since 1989 on 9-11 tributaries located along the western side of Yellowstone Lake between Lake and Grant (Reinhart 1990; figure 1). Spawning reaches were initially delineated on each tributary, and the standardized reaches are walked in an upstream direction once each week from May through July. These surveys indicated a significant decrease in spawning-age cutthroat trout in Yellowstone Lake over the past two decades (figure 6). In the late 1980s, more than 70 cutthroat trout were typically observed during a single visit to one of the streams, compared to only 1 or 2 cutthroat trout in recent years (figure 6b). One exception is Little Thumb Creek, a tributary in the West Thumb near Grant, where more than 50 cutthroat trout were seen during a single visit in 2013, and more than 100 were seen during visits in 2014 and 2015. In 2016, the number of fish observed in Little Thumb Creek increased to 295 fish, which is appoximately 80% of the total fish counted. Although the increased number of fish observed in this stream is encouraging, counts remain far below the desired conditions of at least 40-60 spawning cutthroat trout observed per visit on average at all of the visually-assessed spawning tributaries.Cutthroat Trout and Lake Trout Caught by Anglers
Since 1979, angler effort and success have been assessed via a report card distributed to all anglers when purchasing a special use permit for fishing (Jones et al. 1980). Information on the waters fished, time spent fishing, and species and sizes of fish caught by anglers is obtained on these cards. Annually, approximately 4,000 anglers (5% of all anglers) have voluntarily completed and returned cards to the park’s fisheries program. The angler report card data estimated more than 8,000 anglers (21% of all park anglers) fished Yellowstone Lake with a catch rate of 0.8 cutthroat trout per hour during the 2015 fishing season. This is below the desired goals of 1.5 (secondary) and 2.0 (primary) cutthroat trout per hour for Yellowstone Lake, and a reduction from the 2014 catch rate of 1.2 cutthroat trout per hour. In 2016 the catch rate increased to 0.9 cutthroat trout per hour. This is the third highest catch rate over the last 11 years. Average length of cutthroat trout caught by anglers was 462 mm (18 in.) in 2016, which is similar to other recent years.An estimated 12,000 lake trout were caught by anglers in Yellowstone Lake in 2016 at a rate of 0.2 fish per hour. Many of these lake trout were large, with anglers reporting 42% were more than 462 mm (18 in). Because of the mandatory kill regulation for lake trout caught by anglers, angling accounted for an estimated 3% of the total lake trout removed from Yellowstone Lake by all methods (angling and suppression netting) in 2016.
Conclusion
The cutthroat trout population in Yellowstone Lake has experienced declines due to the introduction of lake trout, drought years that may have negatively affected successful spawning, and whirling disease that is prevalent in some tributary streams. Monitoring to assess the effectiveness of large-scale suppression of lake trout indicates improvement in the cutthroat trout population, but there remains much work to be done. The desired condition for cutthroat trout as monitored by our distribution netting program is an average catch of 26 (secondary goal) to 40 (primary goal) fish per 100 meters of net set over one night. Although recent years have detected an increasing trend in cutthroat numbers, the secondary goal has been met only once (in 2014; figure 6a). Information from our spawning stream visual surveys indicates spawning cutthroat trout numbers have remained very low over the past decade. Although there has been a slight increase in the overall number of fish observed in these streams, we are still below the desired conditions of 40 (secondary goal) to 60 (primary goal) cutthroat trout observed per stream visit across all 11 tributaries (figure 6b). Similarly, catches of cutthroat trout reported by anglers have increased, but are still below the desired conditions of 1.5 (secondary goal) and 2.0 (primary goal) cutthroat trout per hour (figure 6c).
Literature Cited
Jones, R.D., R.E. Gresswell, D.E. Jennings, S.M. Rubrecht, and J.D. Varley. 1980. Fishery and aquatic management program in Yellowstone National Park. Technical Report 1979. U.S. Fish and Wildlife Service, Yellowstone National Park, Wyoming, USA.Koel, T.M., P. Bigelow, P.D. Doepke, B.D. Ertel, and D.L. Mahony. 2005. Nonnative lake trout result in Yellowstone cutthroat trout decline and impacts to bears and anglers. Fisheries 30:10-19.
Koel, T.M., J.L. Arnold, P.E. Bigelow, and M.E. Ruhl. 2010. Native fish conservation plan. Environmental assessment, December 16, 2010. National Park Service, U.S. Department of the Interior, Yellowstone National Park, Wyoming, USA.
Reinhart, D.P. 1990. Grizzly bear habitat use on cutthroat trout spawning streams in tributaries of Yellowstone Lake. Thesis. Montana State University, Bozeman, Montana, USA.
Syslo, J.M., C.S. Guy, J.L. Arnold, T.M. Koel, and B.D. Ertel. 2014. Standard operating procedures for distribution netting in Yellowstone Lake. U.S. Geological Survey, Montana Cooperative Fishery Research Unit, Department of Ecology, Montana State University, Bozeman, Montana, USA.
Syslo, J.M. 2015. Dynamics of Yellowstone cutthroat trout and lake trout in the Yellowstone Lake ecosystem: a case study for the ecology and management of non-native fishes. Dissertation. Department of Ecology, Montana State University, Bozeman, Montana, USA.
Part of a series of articles titled Yellowstone Science - Volume 25 Issue 1: Native Fish Conservation.
Last updated: August 1, 2017
