Last updated: December 15, 2021
Article
Arctic Report Card 2021
Rapid and pronounced warming continues to drive the evolution of the Arctic environment.
Cascading disruptions, extreme events, and increasing variability throughout the Arctic impact the safety and well-being of communities within and far away from the Arctic.
As the influences of human-caused global warming continue to intensify, with the Arctic warming significantly faster than the globe overall, the 2021 Arctic Report Card (ARC2021) brings a broad view of the state of the Arctic climate and environment. The ARC2021 provides an update on seven Arctic Vital Signs, from sea ice to snow and air temperatures to tundra greenness, and checks in on three Indicator topics for updates on river discharge, ocean acidification, and observations of substantial Arctic beaver expansion. The noteworthy emerging topics in the four ARC2021 Frostbites—marine debris, marine noise, food access during the COVID-19 pandemic, and glacier and permafrost hazards—share a common link as they look at the impacts of more people and human activity in the Arctic as well as the challenges and hazards people face with the rapidly changing cryosphere. The scientific and observational story of the Arctic is a human story—of climate change, of increased shipping and industrial activity, and of communities responding to local and regional disruptions.
Following are highlights from the 2021 Arctic Report Card. View previous reports.
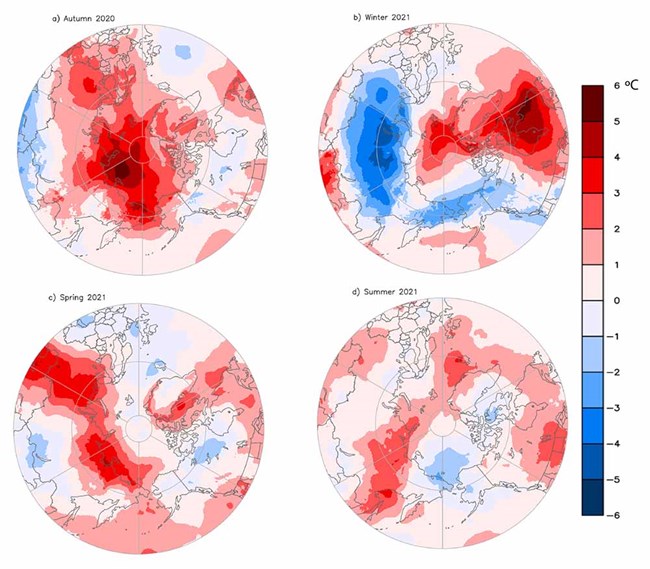
Source: ERA5 reanalysis air temperature data are obtained from the Copernicus Climate Change Service.
Surface Air Temperature
Surface air temperatures (SAT), typically measured at a height of 1.5 to 2 meters above land, ocean, or ice cover, are one of the most telling observational indicators and drivers of Arctic climate change (Box et al. 2019). Averaged SAT across Arctic lands (north of 60 °N), which have a higher density of weather observations relative to the Arctic Ocean and glaciated environments, have shown a pronounced, positive warming trend of nearly 3°C since the mid-1960s. These increased air temperatures have been associated with changes in the frequency, intensity, and duration of Arctic atmospheric and hydrological extremes (Walsh et al. 2020) with impacts on permafrost thaw, glacier melt, and sea ice decline amongst other components of the Arctic and broader Earth system (Moon et al. 2019; see essays on the Greenland Ice Sheet and Sea Ice). In this essay, we recap the annual and seasonal Arctic SAT conditions of the last year (October 2020-September 2021) and place them in context compared to recent decades. Read more.
Highlights
- This past year (October 2020-September 2021) was the seventh warmest on record over Arctic lands (beginning in 1900 with surface air temperature anomalies 1.1°C above the 1981-2010 mean).
- The warmest Pan-Arctic and Asian Arctic autumn (October-December) terrestrial air temperatures were observed in 2020.
- For the second consecutive year, much higher-than-normal air temperatures were observed over northern Eurasia, and especially the Laptev Sea, during autumn of 2020 and spring of 2021.
- Temperature extremes yielded some unprecedented impacts on the Arctic environment, including the first rainfall observed at Summit at the top of Greenland.
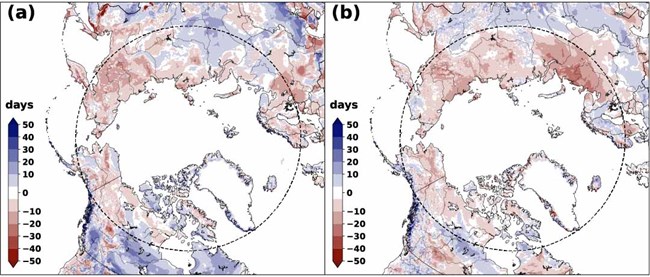
The grey circle marks the latitude 60° N; land north of this defines Arctic land areas considered in this study. Source: NOAA IMS data record.
Terrestrial Snow Cover
Many components of the Arctic land surface are directly influenced by snow cover from autumn through spring, including the surface energy budget (Flanner et al. 2011), ground thermal regime (with implications on the carbon cycle; Natali et al. 2019), permafrost (Walvoord and Kurylyk 2016), and terrestrial and freshwater ecosystems (Bokhorst et al. 2016). Even following the snow cover season, the influence of spring snow melt timing persists through impacts on river discharge timing and magnitude, surface water, soil moisture, vegetation phenology, and fire risk (Meredith et al. 2019). The assessment provided here is based on multiple datasets derived from satellite observations and snowpack models driven by atmospheric reanalyses. Collectively, this approach provides a reliable picture of Arctic snow cover variability over the last five decades. Read more.
Highlights
- Eurasian Arctic snow cover extent (SCE) anomalies were strongly negative in both May (5th lowest in the record since 1967) and June (3rd lowest) 2021. North American Arctic spring 2021 SCE anomalies were also below average (14th and 16th lowest, respectively).
- The summer 2020 snow-free period across Eurasia was the longest since at least 1999.
- Since 2006, North American June SCE has been below the long-term average every year, while Eurasian June SCE has been below the long-term average for every year but one.
Sea Surface Temperatures
Arctic Ocean sea surface temperatures (SSTs) in the summer (June-August) are driven by the amount of incoming solar radiation absorbed by the sea surface and by the flow of warm waters into the Arctic from the North Atlantic and North Pacific Oceans. Solar warming of the Arctic Ocean surface is influenced by the distribution of sea ice (with greater warming occurring in ice-free regions), cloud cover, and upper-ocean stratification. Discharge of relatively warm Arctic river waters can provide an additional source of heat to the surface of marginal seas.
Arctic SST is an essential indicator of the role of the ice-albedo feedback mechanism in any given summer sea-ice melt season. As the area of sea ice cover decreases, more incoming solar radiation is absorbed by the ocean and, in turn, the warmer ocean melts more sea ice. In addition, higher SSTs are associated with delayed autumn freeze-up and increased ocean heat storage throughout the year. Marine ecosystems are influenced by SSTs, which affect the timing and development of primary and secondary production cycles (e.g., see essay Primary Productivity for further context), as well as available habitat for upper-trophic and temperature-sensitive species. With respect to carbon cycling, warmer SSTs are associated with reduced ocean uptake of carbon dioxide from the atmosphere, and thus represent another positive feedback loop (i.e., amplifying cycle) in a changing climate. Read more.
Highlights
- August 2021 mean sea surface temperatures (SSTs) were ~1.0-3.5°C warmer than 1982-2010 August mean values in the Kara and Laptev Seas, and off the east coast of Greenland.
- Anomalously cooler August 2021 SSTs (~0.5-1.0°C cooler) were observed in the Chukchi and Northern Barents Seas and in Baffin Bay.
- Although there is considerable interannual variability in spatial SST patterns, August mean SSTs show statistically significant warming trends for 1982-2021 in most regions of the Arctic Ocean that are ice-free in August.
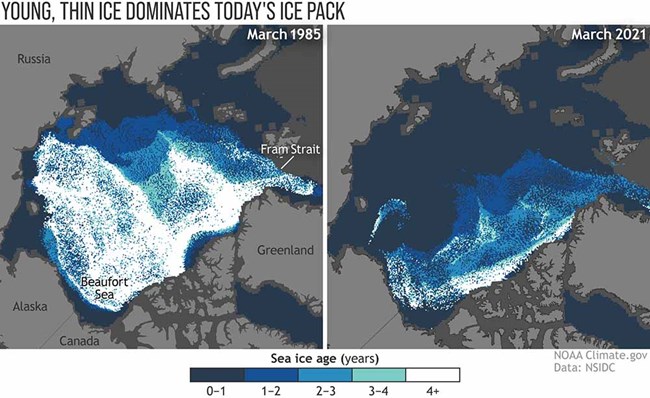
In 2021 (right), only a small strip of very old ice remained tucked up against the islands of the Canadian Arctic. More than half of the winter ice pack was less than a year old (dark blue). NOAA Climate.gov image, based on data from the NSIDC.
Sea Ice
Arctic sea ice is the frozen interface between the ocean and atmosphere in the north, limiting ocean-atmosphere exchanges of energy and moisture and playing a critical role in the earth's climate and the regional ecosystem. The high albedo (reflectivity) of sea ice and overlying snow reflects most incoming solar radiation, which inhibits summer warming. A range of marine mammals depend on the ice as a platform for mating, feeding, birthing, and other activities. The cycle of ice formation and melt influences food web dynamics and the biogeochemical balance of the upper ocean. Humans are deeply connected to the ice as well. Sea ice both facilitates and threatens human activities in the Arctic, including Indigenous hunting and transportation, marine navigation, and national security responsibilities. Overall, 2021 continued to demonstrate the profound changes underway in the Arctic sea ice system.
Arctic sea ice began 2021 catching up from record or near-record low extent and a notably late freeze-up in autumn 2020. Such low autumn ice extent can potentially influence stratospheric circulation and subsequent midlatitude cold outbreaks (see essay Surface Air Temperature). At the start of 2021, sea ice extent was lower than the 1981-2020 average in the Bering and Barents Seas, but near-average elsewhere. High pressure in January and February persisted in the Siberian sector of the Arctic, resulting in divergence from and new ice formation along the Siberian coast and strong advection of thicker, multiyear ice into the Beaufort and Chukchi Seas. It also advected icebergs that were calved from the Canadian Archipelago into the coastal region of Utqiaġvik, Alaska. This multiyear ice in the Beaufort and Chukchi Seas delayed the retreat of ice on the North American side of the Arctic. On the Siberian side, strong pressure gradients during April and May facilitated early melt onset and local ice retreat in spring, leading to a record-low extent in the Laptev Sea during May and June.
Summer 2021 was marked by general low pressure over the Arctic Ocean. This brought relatively cloudier conditions and divergent ice circulation that, along with the thicker Beaufort and Chukchi Seas ice, slowed the decline in ice extent. Summer (JJA) air temperatures at the 925 mb level ranged from 1° to 2°C above normal over the Arctic Ocean, with the exception of near-normal temperatures for the Beaufort and Chukchi Seas (see essay Surface Air Temperature). The older ice in the Beaufort and Chukchi Seas resulted in a near-normal ice edge location throughout most of the summer, breaking the regional pattern of low ice extents seen in recent years. The summer circulation also limited ice export through Fram Strait, resulting in the unusual occurrence of a nearly ice-free East Greenland Sea during much of the summer. Read more.
Highlights
- Winter maximum (March) and summer minimum (September) 2021 sea ice extents were less extreme compared to the last couple of years, but the 15 lowest minimum extents have all occurred in the last 15 years.
- An early onset of sea ice melt and retreat occurred in the Laptev Sea, leading to record-low extent in the region during May and June, while winter advection of thick, multiyear ice into the Beaufort and Chukchi Seas resulted in a late and limited spring retreat in that region.
- The amount of multiyear sea ice, based on available data since 1985, reached its second lowest level by the end of summer 2021, sea ice thickness was lower than recent years, and volume was at record low (since at least 2010) in April 2021.
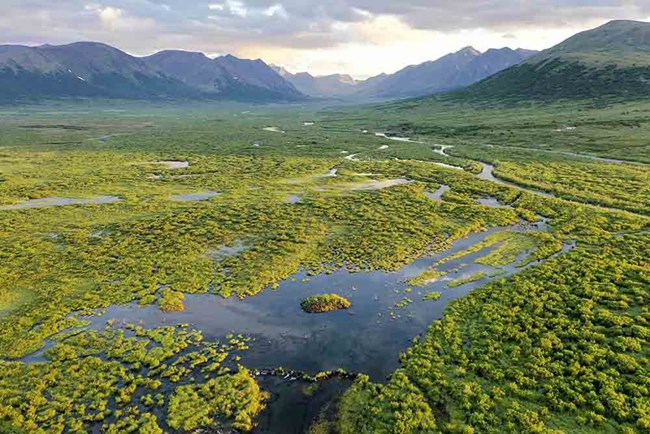
Ken Tape, Aug 2021
Beaver Engineering: Tracking a New Disturbance in the Arctic
Research on North American beaver (Castor canadensis) engineering in the Arctic has made great strides in recent years, but most of the work lies ahead. Over the last several decades, people in remote Alaska communities have observed an influx of beavers (ADF&G Reports 1965-2017). We quantified this trend by using satellite imagery to detect beaver pond formation in Alaska tundra regions, mapping approximately 12,000 beaver ponds, including a doubling in most areas during the last 20 years (Tape et al. 2021). We showed that new beavers are controlling surface water increases, which affects underlying permafrost (Jones et al. 2020). Fieldwork is underway to characterize the impacts of beaver ponds on aquatic and terrestrial Arctic ecosystems, starting with hydrology and permafrost, and continuing downstream to methane flux, fish populations, and aquatic food webs. As a result of these efforts, most of the questions surrounding beaver engineering in the Arctic are presently being examined but are unanswered. To coordinate research and action among stakeholders in the circumarctic region, the Arctic Beaver Observation Network (A-BON) was formed in 2020 and a synthesis effort is underway to identify knowledge gaps and support the integration of different approaches and perspectives. Read more.
Highlights
- Recent satellite imagery and older aerial photography show that North American beavers (Castor canadensis) are colonizing the Arctic tundra of Alaska, with over 12,000 ponds thus far counted in western Alaska, a doubling of ponds since 2000.
- In Canada, beaver pond mapping is underway, complemented by scattered observations of recent changes. Eurasian beavers (C. fiber) are rebounding in Asia but remain south of the Arctic tundra in most locations.
- The Arctic Beaver Observation Network was established in 2020 to help integrate, guide, and disseminate information concerning beaver range expansion into tundra regions and implications for ecosystems and resources.
NOAA Climate.gov image, based on data from Matt Macander.
Tundra Greenness
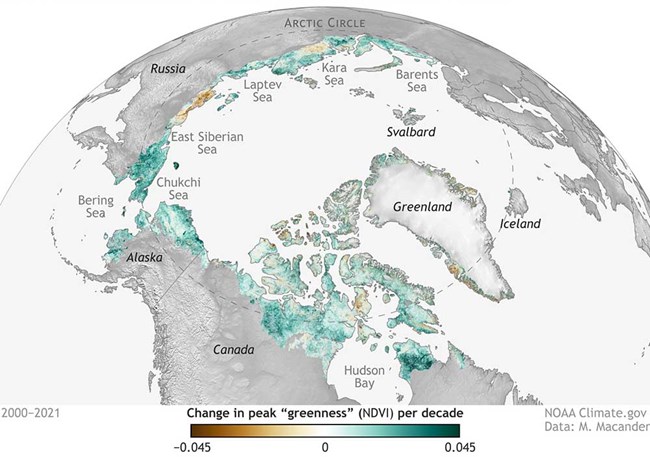
Earth's northernmost continental landmasses and island archipelagos are home to the Arctic tundra biome, a 5.1 million km2 region characterized by low-growing, treeless vegetation adapted to short, cool summers (CAVM Team 2003). The Arctic tundra biome has long been a "hotspot" of global environmental change, because vegetation and underlying permafrost soils are strongly influenced by warming air temperatures and the rapid decline of sea ice on the nearby Arctic Ocean (Bhatt et al. 2021; see essays Surface Air Temperature and Sea Ice). In the late 1990s, a pronounced increase in the productivity of tundra vegetation became evident in global satellite observations, a phenomenon that has come to be known as "the greening of the Arctic." Arctic greening is dynamically linked with Earth's changing climate, permafrost, seasonal snow, and sea-ice cover, and has continued to be a focal point of multi-disciplinary scientific research. Today, a growing constellation of spaceborne satellite sensors and emerging airborne technologies such as unoccupied aerial systems (UAS), or "drones," provide increasingly detailed observations of Arctic ecosystems. Read more.
Highlights
- 2021 continued a recent series of years with exceptionally high midsummer tundra productivity, or "greenness."
- The five highest circumpolar tundra greenness measurements in the long-term satellite record (1982-2020) have all been recorded in the last 10 years.
- Satellites provide unequivocal evidence of widespread tundra greening, but extreme events and other drivers of local-scale "browning" have also become more frequent, highlighting regional variability as an increasing component of Arctic change.
NASA Earth Observatory with Automatic Identification Signals from ships provided by Woodwell Climate Research Center
The Changing Arctic Marine Soundscape
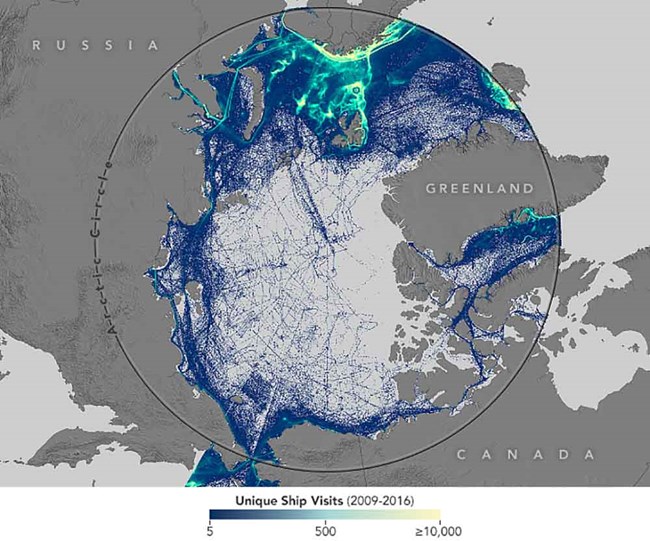
In the global ocean, the combination of naturally occurring sounds, including those from wind, waves, underwater earthquakes, and marine animals, make up the underwater 'soundscape.' Unique to polar regions is the role sea ice plays in the soundscape, both by generating noise and by dampening noise from the atmosphere. The ice-covered Arctic can experience some of the lowest ambient sound levels in the ocean due to the lack of wind-driven waves in ice-covered regions. Changes in sea ice—reduced thickness, age, extent and changing seasonality—are, however, altering the Arctic underwater acoustic environment in numerous ways. Over the past ~15 years, advances in both long-term deployable acoustic instrumentation and the ability to analyze the resulting terabytes of data, have resulted in sound recordings that provide up to multi-year soundscapes from the Pacific and Atlantic Arctic, north of the Arctic Circle. These data now allow us to understand how loud the oceans are and provide evidence of changes in the geophony (natural sounds of the earth and atmosphere), biophony (sounds produced by living organisms), and anthrophony (human-made sounds). In the Arctic, the main sources of naturally occurring sounds include waves, winds, sea ice, and marine mammals. Sources of human noise include oil and gas exploration and extraction, commercial shipping, research vessels, tugs and barges to supply villages, and local skiffs. However, as seasonal sea ice decreases and the 'open water season' lengthens, both natural and anthropogenic influences are changing the underwater soundscape of the Arctic. Read more.
Highlights
- Less sea ice and increasing storminess are making Arctic waters louder during the open water season due to increased wind and wave noise.
- Arctic marine mammals are changing their migratory patterns and subarctic visitors are heard for more of the year and further north as sea ice loss opens habitat for them.
- Arctic shipping traffic between the Pacific and Atlantic Oceans continues to increase and with it, ambient noise levels are increasing in the frequency bands used by marine mammals.
About the Arctic Report Card 2021
The Arctic Report Card (ARC) has been issued annually since 2006. It is a timely and peer-reviewed source for clear, reliable, and concise environmental information on the current state of different components of the Arctic environmental system relative to historical records. The ARC is intended for a wide audience, including scientists, teachers, students, decision-makers, and the general public.
ARC 2021 contains 14 essay contributions prepared by an international team of 111 authors from 12 different countries. As in previous years, independent peer review of ARC 2021 was organized by the Arctic Monitoring and Assessment Programme (AMAP) of the Arctic Council. ARC is classified as a NOAA Technical Report and is archived within the NOAA Library Institutional Repository.
Moon, T. A., M. L. Druckenmiller, and R. L. Thoman, Eds., 2021: Arctic Report Card 2021. Arctic Report Card 2021.
