Last updated: December 8, 2020
Article
Arctic Report Card 2020
The sustained transformation to a warmer, less frozen and biologically changed Arctic remains clear.
Extreme warm air temperatures in the Eurasian Arctic illustrate significant region-wide effects of year-to-year variability and connections across the Arctic environment.
The Arctic Report Card (ARC) provides an annual update on the state of the Arctic's climate and environment as well as highlights of Arctic science news of the past year. ARC2020 features 16 essays, 11 of which provide updates on a wide range of Arctic science topics, from the past year's air temperatures and sea ice conditions to the latest in bowhead whale research. Taken as a whole, across a variety of disciplines and viewpoints, the story is unambiguous: the transformation of the Arctic to a warmer, less frozen, and biologically changed region is well underway. Extreme high temperatures in the Eurasian Arctic in spring and summer 2020 provide a clear demonstration of the strong connections within the Arctic environment that characterize this region. Three closely connected essays examine the acquisition of observational data and their use in modeling to understand physical systems in the Arctic. ARC2020 also marks the publication's 15th anniversary.
Following are highlights from the 2020 Arctic Report Card. View previous reports.
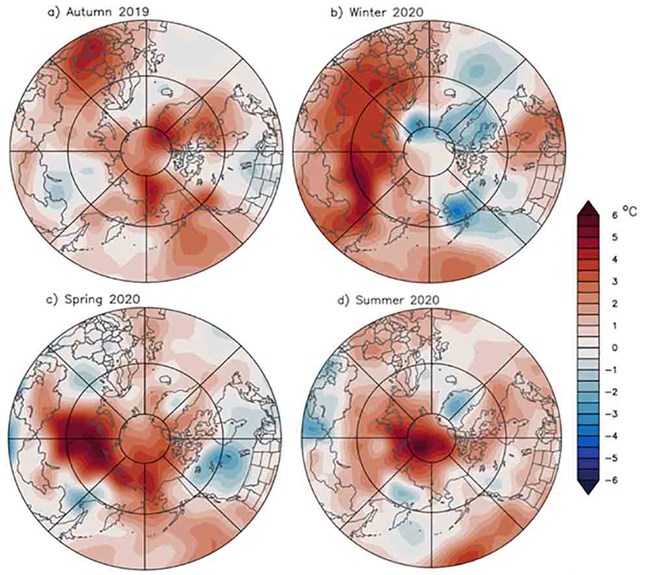
The 925 hPa layer located just above the surface is used to emphasize large spatial temperature patterns rather than local surface features. NCEP/NCAR reanalysis air temperature data (Kalnay et al. 1996) are obtained from the NOAA Physical Science Lab.
Surface Air Temperature
Changes in air temperature and sea ice (extent, volume, and seasonality) are at the root of changes across the Arctic environment. In a year of many extremes, the annual (October to September) SAT anomaly poleward of 60° N was 1.9°C above the 1981-2010 average and was the second highest on record since at least 1900. This marks the 9th of the last 10 years when SAT anomalies were at least 1°C warmer than the 1981-2010 mean. Driving this annual extreme were anomalously warm conditions across much of the Eurasian Arctic for most of the first seven months of 2020 and during the summer over the central Arctic basin. These air temperature extremes both contributed to and in part were caused by extremes in the Arctic sea ice. Sea ice loss in spring 2020 was particularly early in the East Siberian Sea and Laptev Sea regions. During June, ice extent in the Laptev Sea dropped to record low levels for that time of year. More broadly, both winter and summer sea ice extent extremes continued declining trends. In 2020, the end of winter extent was the 11th lowest in the 42-year satellite record and the end of summer extent was the second lowest, 2012 being the record minimum year. Satellite-derived sea ice thickness (available only since 2010) showed both the winter maximum and late summer minimum to be near the lowest in the decade since data collection began. Read more.
Highlights
- October 2019-September 2020 represented the second warmest 12-month period of observed surface air temperatures (SAT) over Arctic land during the last century.
- Remarkably warm Siberian SAT occurred in the first half of 2020, with near-surface air temperatures 3-5°C above average during boreal winter (JFM) and spring (AMJ).
- A persistent, strong, and zonal jet stream over the mid-to-high latitudes led to warmer than average SAT over northern Eurasia and colder than normal SAT over Alaska and Greenland in winter and spring.
Terrestrial Snow Cover
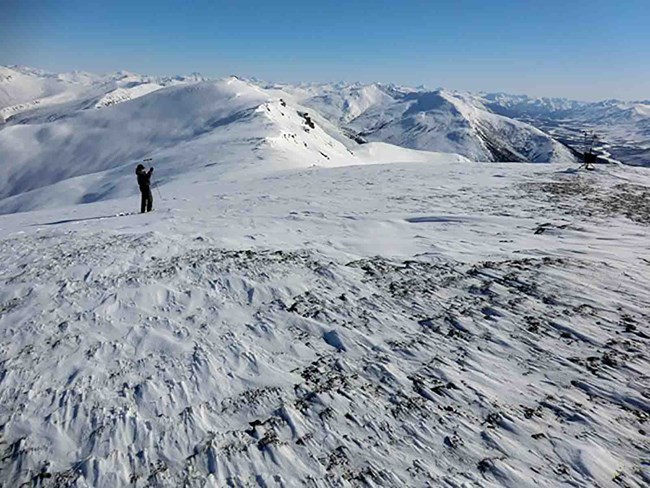
The terrestrial Arctic environment is very sensitive to air temperature at varying time scales, especially during spring and autumn. The snow cover (or lack thereof) exerts a strong control on weather and climate, as well as on the larger ecosystem, through reflection of incoming solar energy and its insulating effect on the ground's ability to gain or lose heat. Snow accumulation during the 2019/20 winter was above normal across the entire Arctic. However, the exceptional spring warmth across the Eurasian Arctic resulted in the lowest June snow cover extent in this region since the observational record began in 1967. The May Arctic snow cover extent during the 1981-2020 period is decreasing at a rate of 3.7% per decade, with a much higher rate of loss (15% per decade) for June over this same period.
Variably in the seasonality of snow cover is an important control on wildland fire activity in high northern latitudes. Arctic wildfires occur primarily, though not exclusively, in the boreal forest (Taiga), the world's largest terrestrial biome. In this region wildfires are highly variable in space and time, driven by sub-seasonal drying of fuel over weeks and controlled by climate. Increasing trends in air temperature and fuel availability over the 41-year record (1979-2019) suggest that conditions are becoming more favorable for fire growth, with more intense burning, more fire growth episodes, and greater consumption of fuels. The extreme wildfires in 2020 in Sakha Republic offer another example of the impact of the extreme warm spring and summer air temperatures in the Eurasian Arctic.
Highlights
- Extremely high spring 2020 temperatures across Siberia resulted in the lowest June snow extent across the Eurasian Arctic observed in the 54-year satellite record.
- The record Eurasian minimum spring snow extent occurred despite larger than normal winter snowpack accumulation through April.
- Long-term changes in Arctic spring snow extent show similar reductions across both North America and Eurasia. The trend in Arctic peak snow water equivalent differs over North America (negative trend) and Eurasia (little change), but the combined Arctic peak snow water equivalent total is decreasing.
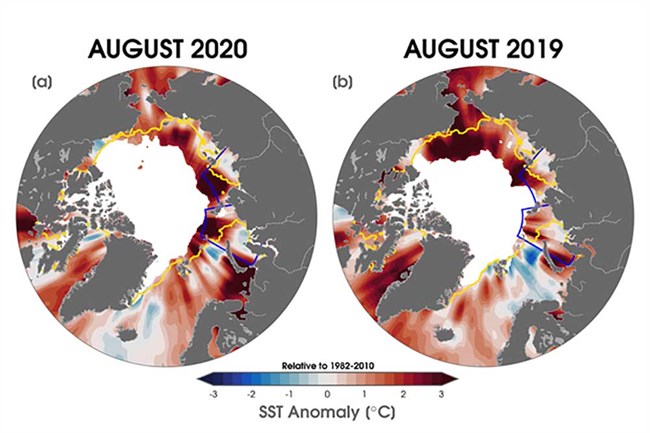
Sources: SST data are from the NOAA OISSTv2; sea-ice extent and ice-edge data are from NOAA/NSIDC Climate Data Record of Passive Microwave Sea Ice Concentration, Version 3; Peng et al., 2013; Meier et al., 2017.
Sea Surface Temperatures
Ocean surface temperatures (SSTs) in the Arctic during spring and summer are strongly tied to sea ice presence or absence as well as ocean currents and atmospheric parameters. August 2020 mean SSTs were ~1-3°C warmer than the 1982-2010 August mean over most of the Arctic Ocean. Exceptionally warm SSTs in the Laptev and Kara Seas distinguished August 2020 SSTs, coinciding with the early loss of sea ice in this region. The strong interannual variability in spatial patterns of SST bears a close relationship to early summer sea ice concentrations because the regions of low sea ice area allow more direct solar heating of the exposed surface waters. August mean SSTs show statistically significant warming trends for 1982-2020 in most regions of the Arctic Ocean that are ice-free in August. Also tied to sea ice and ocean temperature conditions is productivity at the bottom of the marine food web. During July and August 2020, a ~600 km long region in the Laptev Sea of the Eurasian Arctic showed much higher primary productivity (~2 times higher for July and ~6 times higher for August) than the same months of the 2003-2019 multiyear average.
Air temperatures, storminess, sea ice and ocean conditions are major factors in permafrost coastal erosion. Permafrost coasts in the Arctic make up more than 30% of Earth's coastlines. A high proportion of Arctic residents live in the coastal zone, where industrial, commercial, tourist, and military presences are also expanding. Since the early 2000s, erosion of permafrost coasts in the Arctic has increased at nearly all observational sites where data extending back to approximately 1960 or 1980 are available. Permafrost coasts along the US and Canadian Beaufort Sea experienced the largest increase in erosion rates, ranging from +80 to +160%, when comparing data from the 1980s and 2000s with the 2010s. Read more.
Highlights
- August mean sea surface temperatures (SSTs) in 2020 were ~1-3°C warmer than the 1982-2010 August mean over most of the Arctic Ocean.
- August mean SSTs show statistically significant warming trends for 1982-2020 in most regions of the Arctic Ocean that are ice-free in August.
- August mean SSTs in 2020 were exceptionally warm in parts of the Kara and Laptev Seas, up to ~5°C warmer than 1982-2010 August mean values, associated with early seasonal ice loss in these regions and anomalously warm surface air temperatures over northern Eurasia.
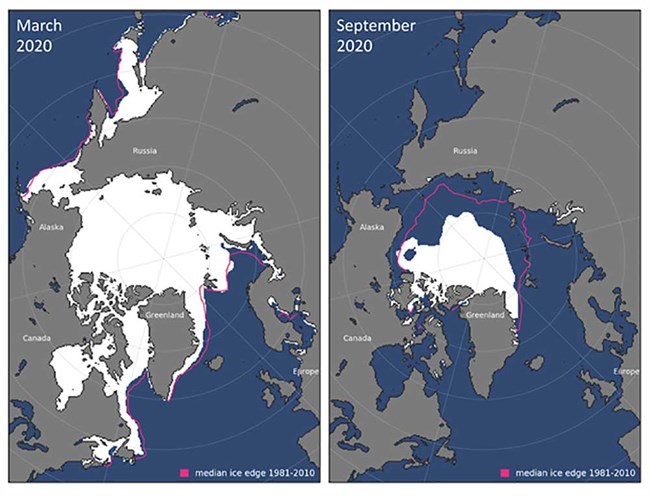
Maps are from NSIDC at http://nsidc.org/data/seaice_index/
Sea Ice
Arctic sea ice is an important part of the climate system. Its higher albedo reflects much of the incoming solar radiation during the summer, keeping the region cooler than an ice-free environment. The sea ice cover acts as a physical barrier between the ocean and the atmosphere, limiting energy and moisture exchange. Ice formation and melt substantially modify the biogeochemical balance of the upper ocean. Sea ice also acts as a platform for charismatic megafauna and other components of the ecosystem. Finally, it is both a facilitator and hazard to human activities in the Arctic. In 2020, the Arctic sea ice cover continued the declining trends in extent, thickness, and volume.
For sea ice, 2020 was marked by very warm spring conditions (see essay Surface Air Temperature), leading to early ice loss, particularly in the East Siberian and Laptev Sea regions. During June, Laptev Sea ice extent dropped to record-low levels for that time of year, which led to particularly warm sea surface temperatures later in the summer (see essay Sea Surface Temperature). Ocean warmth also led to a slow freeze-up in autumn 2019, which led to warm autumn air temperatures (see essay Surface Air Temperature) and may have helped pre-condition sea ice in the region for the early melt in spring 2020. In contrast to recent years, early season ice loss in the Beaufort and Chukchi Seas was near the 1981 to 2010 climatological average; however, those seas experienced rapid late loss and ended the summer far below average. This late-summer loss in the Pacific sector drove a faster-than-normal late-August and early September ice loss and had implications for primary productivity (see essay Ocean Primary Productivity). Read more.
Highlights
- The Arctic sea ice cover continues declining trends in the summer minimum and winter maximum extents. In 2020, end of winter extent was the 11th lowest and the end of summer extent was the 2nd lowest in the satellite record (1979-2020).
- Maximum Northern Hemisphere sea ice volume in April 2020 was 18,785 km3, approximately 1,000 km3 below the 2010-2019 average. October 2020 sea ice volume showed the lowest value (4.627 km3) in the past 10 years because of the second largest summer loss of 15.215 km3.
- Sea ice melt onset and opening was very early in the Siberian coastal region, related to very warm spring and early summer air temperatures and offshore winds.
NOAA
Bowhead Whales: Recent Insights into Their Biology, Status, and Resilience
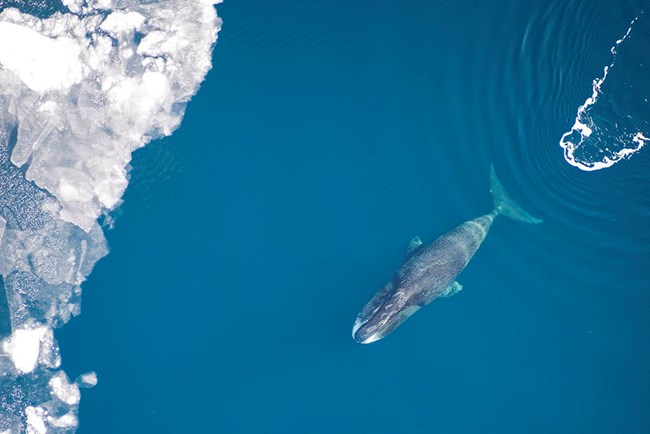
As an example of the impact of changing conditions on marine mammals, ARC2020 includes an essay on bowhead whales, one of the iconic megafauna of the Arctic and the only "true" arctic baleen species, with a range confined to icy sub-arctic and arctic waters. They have been a staple resource for coastal Indigenous peoples from the Russian Far East to Greenland for millennia. Nearly hunted to extinction by commercial whaling in the 19th and 20th centuries, populations in the Pacific Arctic and East Canada/West Greenland region are thought to have now recovered to early 19th century levels. The population size of bowheads in the Pacific Arctic has increased in the past 30 years likely due to increases in ocean primary production as well as the northward transport of the zooplankton on which they feed. Read more.
Highlights
- Bowhead whales can live over 200 years and have unique anatomical and physiological attributes. Their sequenced genome holds promise for the advance of medical knowledge related to cell senescence, bone biology, and fat metabolism in mammals including humans.
- Commercial fishing and associated gear entanglement, industrial shipping, oil and gas activities including seismic exploration, and orca predation are affecting all four bowhead populations to varying degrees. Resilience of the species to these human-induced and natural ecological shifts vary by region.
- Bowhead whales are a useful indicator species that reflect variability in arctic marine ecosystems. Population size of bowheads in the Pacific Arctic has increased in the past 30 years in part due to increases in primary production as well as transport of the zooplankton north from the Bering Strait. The East Canada-West Greenland population has also increased. Conversely, the smaller bowhead populations in the Atlantic and Okhotsk Sea have remained at low numbers and are considered vulnerable or at risk.
Tundra Greenness
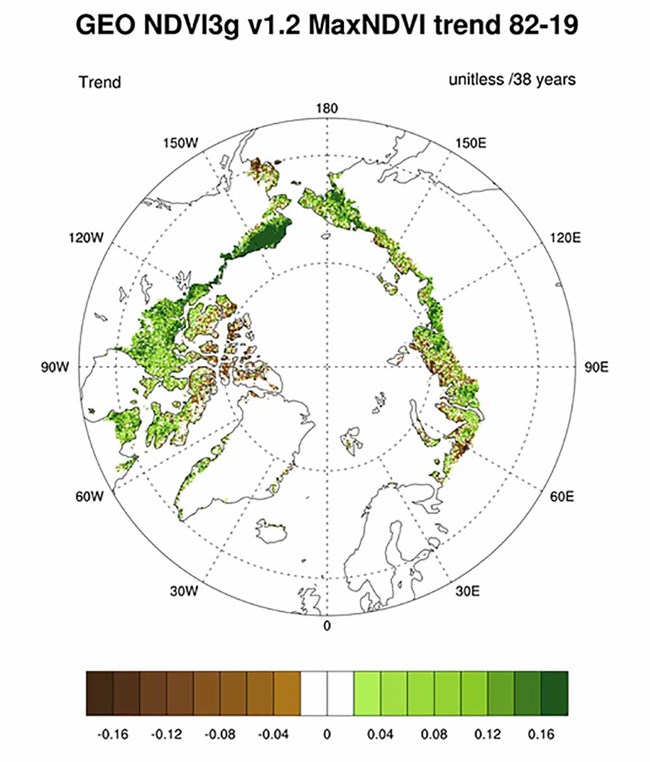
Tundra productivity (i.e., greenness) is sensitive to summer air temperature but in complex ways, with other factors playing a significant role, such as the characteristics and timing of the spring snow retreat. In North America, tundra productivity for the 2019 growing season rebounded strongly from the previous year, in tandem with record summer warmth following the cold summer of 2018. Since 2016, greenness trends have diverged strongly by continent; peak summer greenness has declined sharply in North America but has remained above the long-term mean in Eurasia. (Note that unlike other ARC Vital Signs, satellite-based tundra vegetation analysis lags a year behind other essays due to data processing constraints. Read more.
Highlights
- In North America, tundra productivity for the 2019 growing season (the most recent data available) rebounded strongly from the previous year, in tandem with record summer warmth following the cold summer of 2018.
- Since 2016, greenness trends have diverged strongly by continent; peak summer greenness has declined sharply in North America but has remained above the long-term mean in Eurasia.
- The long-term satellite record (1982-2019) indicates "greening" across most of the Arctic but some regions exhibit "browning," underscoring the dynamic linkages that exist between tundra ecosystems and other elements of a changing Arctic system.
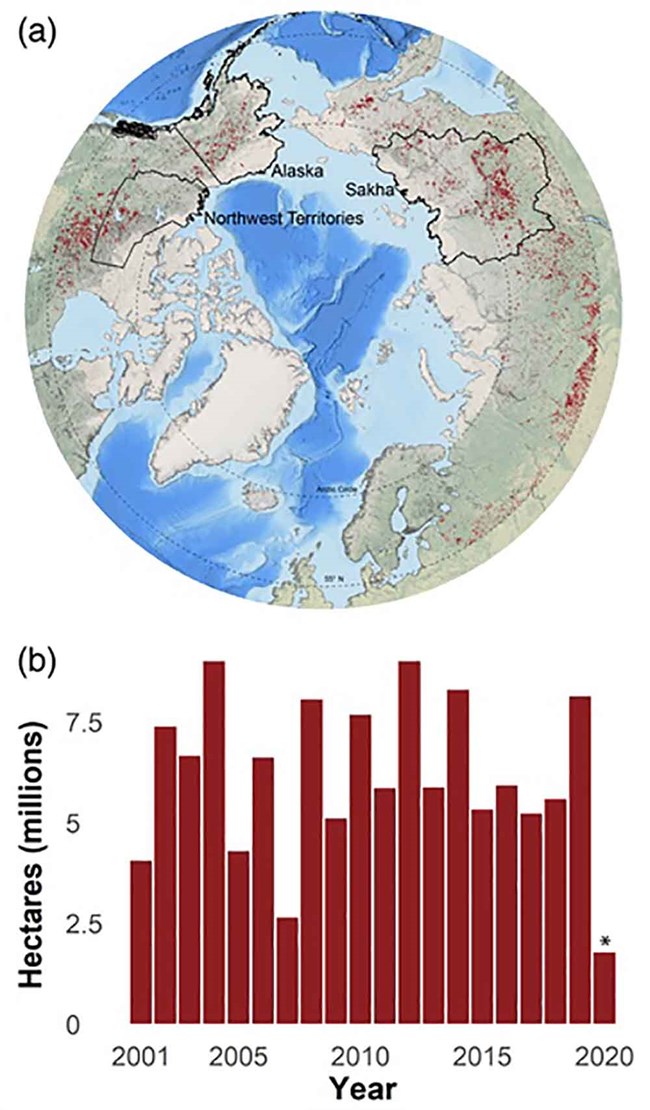
Projection is lambert azimuthal equal-area North Pole. Figure by Zav Grabinski. *MODIS data are only through June 2020, due to a delay in processing following a sensor outage.
Wildland Fire in High Northern Latitudes
Despite the low annual temperatures and short growing seasons that are characteristic of high northern latitudes (HNL), wildland fire is the dominant ecological disturbance within the region's boreal forest, the world's largest terrestrial biome. The boreal forest, also known as Taiga, is the band of mostly coniferous trees that stretches across the area north of the July 13°C isotherm in North America and Eurasia. Wildland fires also impact the tundra regions bordering the Taiga. This brief report updates our previous contribution to Arctic Report Card 2017. It summarizes evidence on variability and trends in fire disturbance in HNL, describes the fuels that characterize boreal and tundra ecosystems, and outlines how climate and subseasonal fire weather conditions in HNL influence the extent of area burned in a given year. Read more.
Highlights
- Wildland fire activity in high northern latitudes is highly variable, driven by subseasonal drying over weeks, and controlled by climate.
- Under prolonged warm, dry weather conditions, the accumulated layers of partially decomposed organic matter that characterize northern ecosystems become a ready fuel source and are key to regional fire phenomena (e.g., holdover fires), to interactions with the global carbon cycle, and to impacts on other aspects of these high latitude environments.
- Increasing trends in air temperature and fuel availability over the 41-year record (1979-2019) suggest that conditions are becoming more favorable for fire growth, with more intense burning, more fire growth episodes, and greater consumption of fuels.
About the Arctic Report Card 2019
The Arctic Report Card (ARC) has been issued annually since 2006. It is a timely and peer-reviewed source for clear, reliable, and concise environmental information on the current state of different components of the Arctic environmental system relative to historical records. The ARC is intended for a wide audience, including scientists, teachers, students, decision-makers, and the general public interested in the Arctic environment and science.
ARC 2020 contains 16 essay contributions prepared by an international team of 134 researchers from 15 different countries. As in previous years, independent peer review of ARC 2020 was organized by the Arctic Monitoring and Assessment Programme (AMAP) of the Arctic Council.
Thoman, R. L., J. Richter-Menge, and M. L. Druckenmiller, Eds., 2020: Arctic Report Card 2020. Arctic Report Card 2020.
