Part of a series of articles titled Alaska Park Science, Volume 18, Issue 1, Understanding and Preparing for Alaska's Geohazards.
Article
Coastal Dynamics in Bering Land Bridge National Preserve and Cape Krusenstern National Monument
Richard M. Buzard, Alaska Department of Natural Resources, Division of Geological and Geophysical Surveys
Daniel H. Mann, Department of Geoscience, University of Alaska Fairbanks
Benjamin M. Jones, Water and Environmental Research Center, Institute of Northern Engineering, University of Alaska Fairbanks

Photo courtesy of Louise Farquharson, University of Alaska
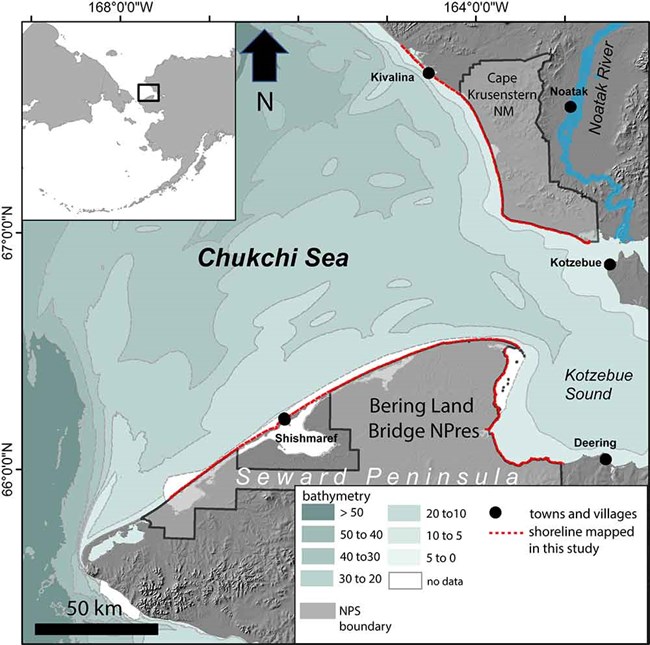
Coastal areas of Bering Land Bridge National Preserve (NPres) and Cape Krusenstern National Monument (NM) coastline (Figure 1) possess complex geomorphologies (Figure 2) where factors that shape the coastline, like waves and sediment supply, act across many different temporal and spatial scales. Sea ice, Arctic Ocean storm tracks, tides, and constantly changing wave and wind patterns impact ice-rich permafrost lowlands, deltas, lagoons, and barrier islands (Figure 2). This creates a dynamic system with a diverse morphology that is in constant flux. As ice-rich permafrost bluffs erode, the sed-iment is deposited on sand spits. Barrier island and beach ridge morphology shifts as sea levels rise and storm surges frequently redistribute large volumes of sediment. The diverse morphology and complexity of these coastal systems make accurately predicting future changes a challenge for land managers. The objective of this study was to explore how the coastlines of Bering Land Bridge NPres and Cape Krusenstern NM have changed over the past 60+ years, especially in the context of ongoing sea ice decline.
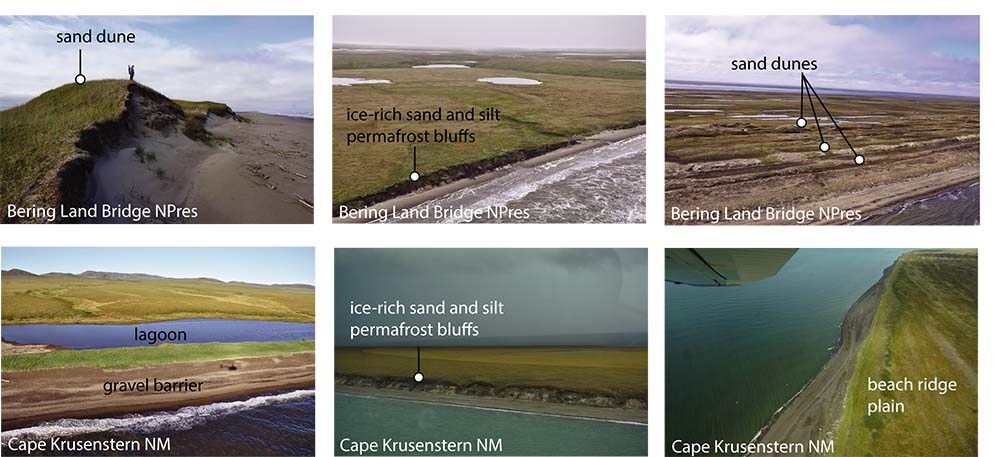
(E) ice-rich permafrost bluffs fronted by a gravel beach, (F) beach ridge plain. Modified from Farquharson et al. 2018.
Climate Change and its Potential Impact on the Coast
The coastlines in Bering Land Bridge NPres and Cape Krusenstern NM extend for over 300 miles (480 km; Figure 1). Arctic coastlines differ from those at lower latitudes because they are influenced by the presence of sea ice and permafrost (ground that stays frozen year-round). Extensive reaches of the coastline in the two parks are characterized by ice-rich permafrost bluffs (Figure 2). Permafrost in the coastal zone influences coastal processes, primarily by facilitating the presence of large volumes of ground ice that support the ground surface and bind together bluff sediment (Figure 3). When this ice melts, the surface subsides and the sediment previously cemented by ice loses strength.
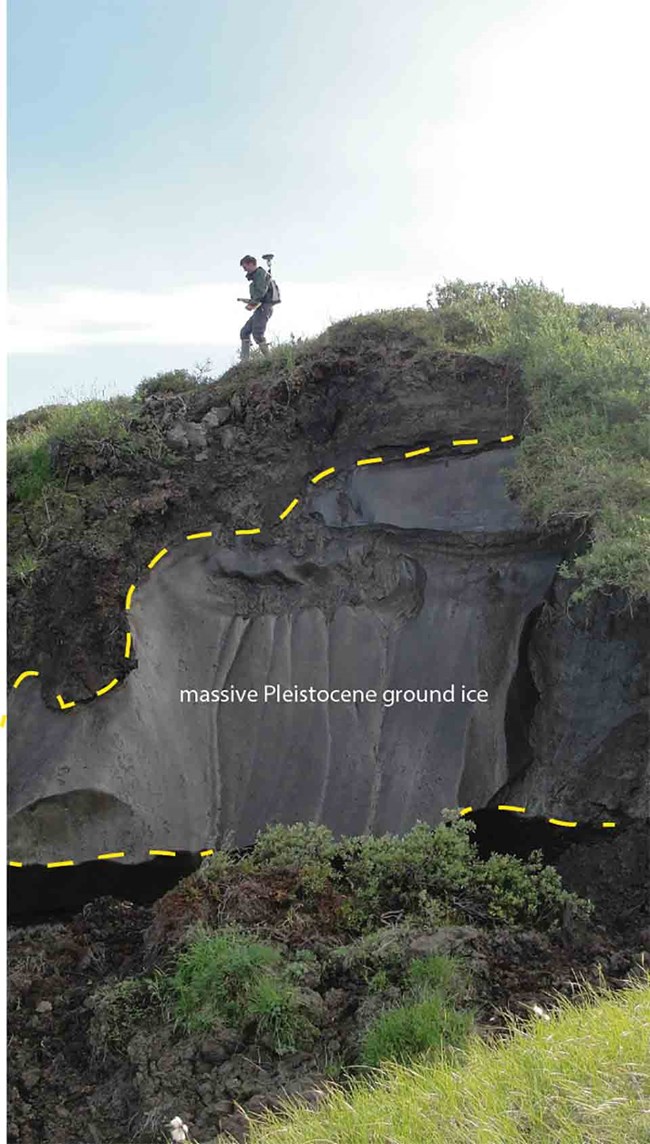
As the Arctic warms, rising air and water temperatures are causing permafrost to thaw, which is causing some Arctic coastlines to erode more rapidly (Barnhart et al. 2014, Günther et al. 2015, Jones et al. 2009). Mean annual ground temperatures in Bering Land Bridge NPres are projected to increase by up to 3°C by 2050 (Panda et al. 2016), and this is expected to cause an increase in the rate of thaw and degradation of ice-rich permafrost bluffs. Offshore warming in the ocean is also important. The surface temperature of the Chukchi Sea has risen by 0.5°C per decade since 1982 (Timmermans and Proshutinsky 2015). Warmer ocean water also increases the rate of thaw along ice-rich permafrost bluffs, a process known as thermoerosion.
The coastlines of Bering Land Bridge NPres and Cape Krusenstern NM are also closely tied to the dynamics of sea ice, which exerts a crucial control over coastal processes. When sea ice is present, it protects coastal bluffs from wave-driven erosion and inhibits sediment transport along the shore. When sea ice is absent, it leaves the coastline open to erosion and sediment transport. Climate change is now altering the sea-ice regime in the Bering and Chukchi seas quickly and radically. Arctic sea ice extent and thickness has been declining by >10 % per decade since satellite observations began in 1981 (Stroeve et al. 2012). Over the last 40 years in the southern Chukchi Sea, the period of time when ice is frozen to the shore (land-fast sea ice) has declined by approximately one week per decade (Mahoney et al. 2014). The decline of sea ice leaves shorelines exposed to waves and fall storms and increases the window of time that erosion and deposition can occur.
As the impacts of climate change are felt more and more in the Arctic, they are expected to affect numerous park resources. Bering Land Bridge NPres and Cape Krusenstern NM are rich in ecological, cultural, and geologic resources. These include unique habitats for Arctic plants and animals, as well as archaeological sites (Darwent et al. 2013, Giddings 1966) and paleoenvironmental archives that can help us unravel the mysteries of the Bering Land Bridge (Jordan and Mason 1999, Mason and Jordan 1993, Wetterich et al. 2012). The landscape also provides crucial subsistence resources for local communities.
Over the coming decades, effective management of park resources will require an understanding of the causes and rates of coastal change. One approach that can help us better assess how the coastline may change in the future is looking at historic rates of change. Using GIS-based tools (Thieler et al. 2009), aerial photographs taken in the 1950s, 1980s, and 2000s can be compared to satellite imagery acquired in the 2010s. We can then look at rates of coastal change and see how factors like sea-ice coverage may influence coastal dynamics. By understanding the behavior of the coastline over recent decades, and exploring the responses of the coastline to different environmental forcing factors, park managers and scientists can attempt to predict how these coasts are likely to change in in the future.
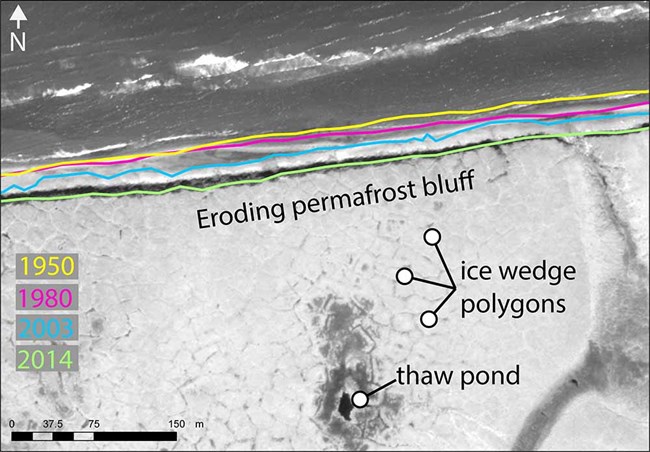
Digital Globe WorldView2 imagery provided by DigitalGlobe, Inc.
Measuring Coastal Change
To understand how they change through time, we mapped shorelines using photographs and satellite images from different observation periods (Jones et al. 2009, Manley and Lestak 2012, Radosavljevic et al. 2016; Figures 4 and 5). Historical aerial images of these parks are available from 1950, 1980, and 2003 (Manley et al. 2007a and b), and we studied these in combination with high-resolution satellite images taken in 2014, thus providing a 64-year record of change. We followed change detection methods that have been successfully applied to previous coastal change studies (Jones et al. 2009, Radosavljevic et al. 2016). We first aligned images using geospatial software and then traced the edge of coastal bluffs along the shore in each image (Figure 4). This provided a set of points that could be compared through time using the ArcMap Digital Shoreline Analysis System extension (Thieler et al. 2009) and allowed us to explore how much the coastline had changed (Figure 2). Another method used to monitor change is to compare elevation data sets from different time periods. We used high-resolution elevation data sets to measure changes in geomorphology between 2003 and 2016. To make sure the digital measurements were correct, we conducted field surveys at long-term monitoring sites in both parks. At each site, we measured the distance between the permanently installed survey markers and the edge of the permafrost bluff, beach ridge, or foredune, and reported any notable geomorphological changes, such as subsidence.

To understand coastal change in Bering Land Bridge NPres and Cape Krusenstern NM, it is important to identify when the coast is sea ice free each year because this determines how long the coast is exposed to erosion. To explore how sea ice coverage has changed in the Chukchi Sea adjacent to the parks, we compiled records of sea ice extent and duration from satellite images of sea ice by the National Snow and Ice Data Center (NSIDC). We then calculated how many days the ocean was ice free and thus exposing the coast to erosion, and how many days the wave fetch (the distance waves travel before encountering land) exceeded 50 km. Wave fetch is an important parameter for coastal change because waves gain energy as they travel over longer distances.
Changes in Sea Ice
Our analysis revealed that the ice-free seas-on along the study shores has increased by approximately 10 days per decade since satellite observations began in 1980. This is because sea ice broke up earlier in the spring and formed later in the fall. The change in sea ice duration means that the coastlines of Bering Land Bridge NPres and Cape Krusenstern NM were exposed to waves and potential storms for, on average, one extra day every year, which over the course of the study period means that more than a month has been added to the erosion season (Farquharson et al. 2018). Sea ice extent during the summer and fall storm season also declined, meaning that waves had a greater distance across which to gain erosive force. As a result, this coastline has experienced more powerful waves over increasingly longer periods each year.
By looking at aerial photographs and satellite images, we can detect several different processes driving coastal change. Along permafrost bluffs, warm air and ocean water melt the ice binding the permafrost soils, causing sediment to slough off bluffs onto the beaches. In addition, the top-down thaw of ice wedges results in thermoerosion and the formation of gullies (Figure 6), which then exacerbate bluff erosion. On the shoreface, coarser sediment like sand and pebbles is transported alongshore while finer-grained material is pulled offshore into deeper water. We found that the processes driving erosion are different where the coast consists of barrier islands. Longshore-transported sediment builds spits and feeds the downdrift growth of barrier islands. During storm events, when waves have more energy, sand is washed across barrier islands to form overwash fans in lagoons.
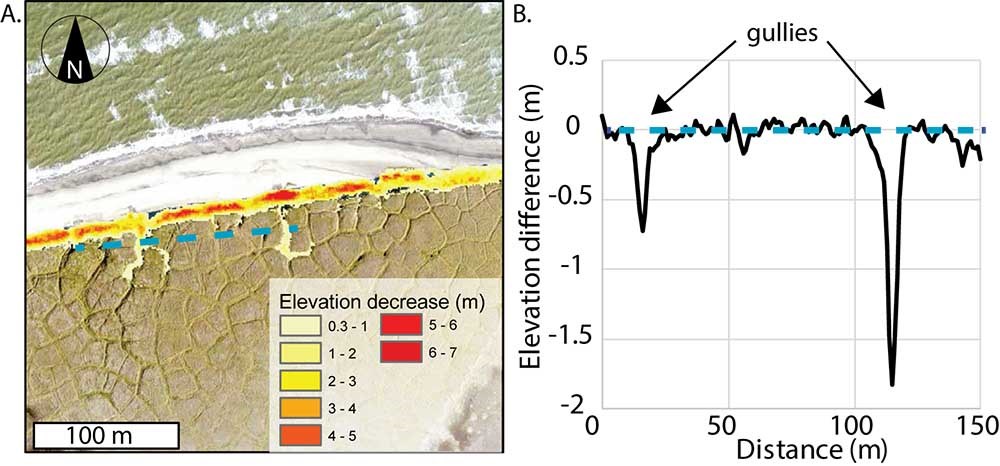
A. The black line indicates where the topographic profile in B is located. Areas in red indicate more elevation change (up to 7 m). B. A graph showing the change in elevation along the transect. The thermoerosion gullies are nearly 2 m in depth.
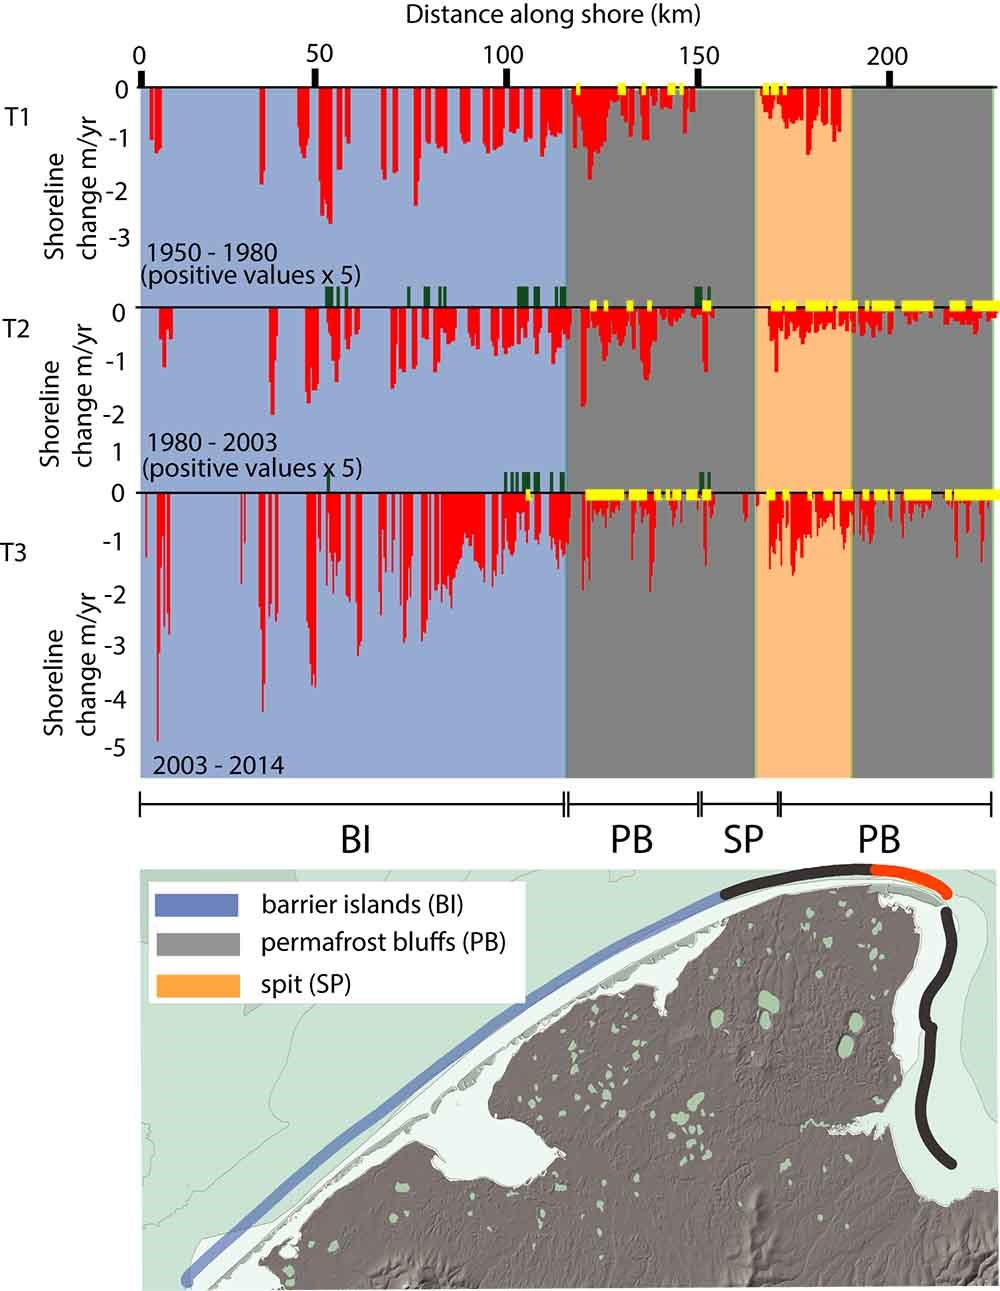
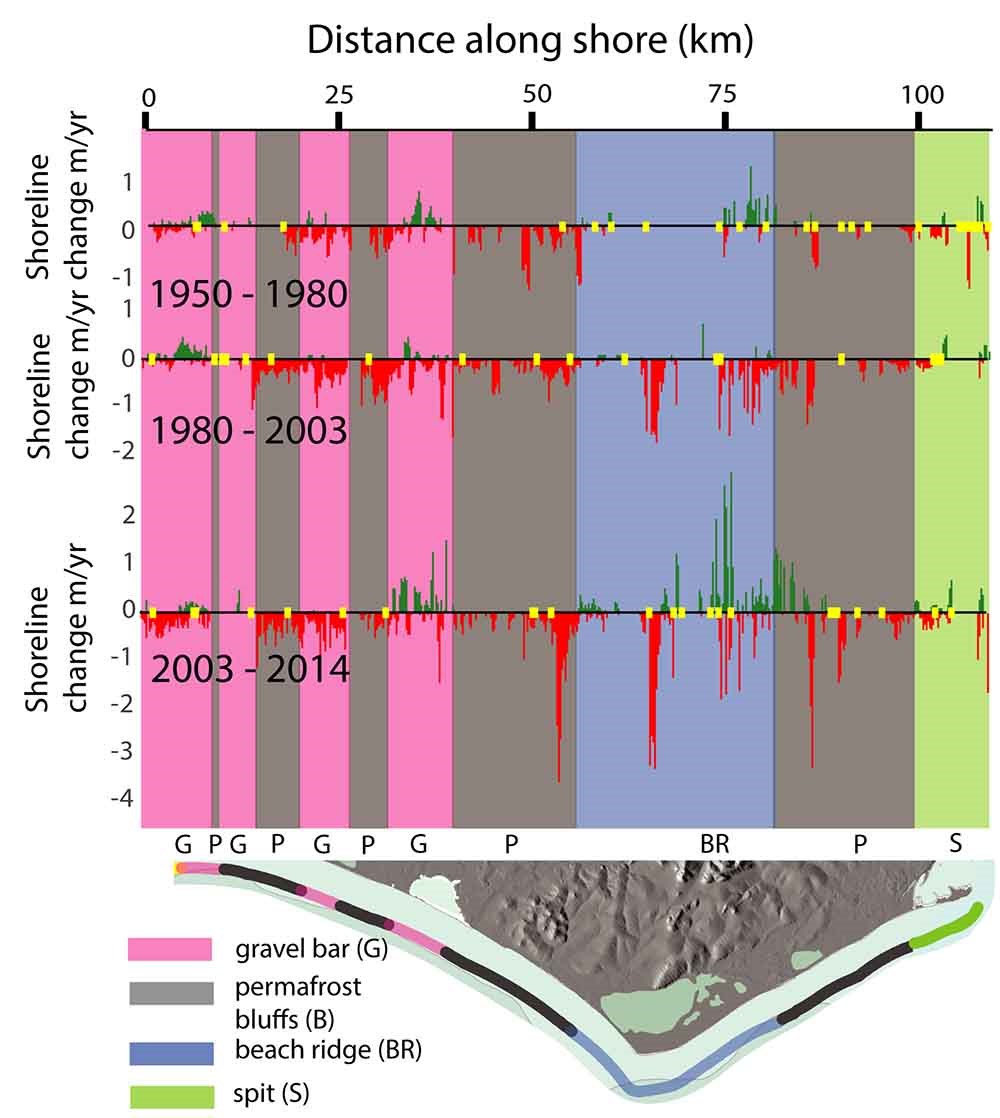
We discovered that the rates of coastline change in Bering Land Bridge NPres and Cape Krusenstern NM have varied over the last 60 years. Although both erosion (sediment loss) and accretion (sediment gain) have taken place, erosion has been the dominant process (Table 1). In Bering Land Bridge NPres, average rates of change were -2.2 feet/year, -0.8 feet/year, and -2.2 feet/year (-0.68 m/yr, -0.26 m/yr, and -0.68 m/yr) between 1950 and 1980, 1980 and 2003, and 2003 and 2014, respectively (Figure 7). The negative numbers indicate that the shoreline, on average, moved inland. In Cape Krusenstern NM, average rates of change were slower: -1.6 inches/year, -8.7 inches/year, and -5.1 inches/year (-0.04 m/yr, -0.22 m/yr, and -0.13 m/yr) between 1950 and 1980, 1980 and 2003, and 2003 and 2014, respectively (Figure 8). We also found that the rates of change differed along different sections of coastline, such as along barrier islands versus permafrost bluffs. In Bering Land Bridge NPres, the most rapidly changing type of coastline has been the low-lying barrier islands. The mean rate of change for these features was highest between 2003 and 2014, where rates reached up to -5 feet/year (-1.53 m/yr). Ice-rich permafrost bluffs changed much more slowly, with a maximum rate of only -1.7 feet/year (-0.51 m/yr) between 1950 and 1980.
The observed range in rates of change shows just how complicated the coastal systems of Bering Land Bridge NPres and Cape Krusenstern NM are. This variability suggests it is difficult to predict how ongoing sea ice decline will influence overall rates of coastal change. In addition to documenting a wide variability in mean rates of change, we also found that the range of rates (difference between minimum and maximum rates) of change were greatest between 2003 and 2014 in both Bering Land Bridge NPres and Cape Krusenstern NM (Table 1).
| 1950 to 1980 (m/yr) | 1980 to 2003 (m/yr) | 2003 to 2014 (m/yr) | |
| Bering Land Bridge National Preserve | |||
|
Mean rate of change
|
-0.7 | -0.3 | -0.7 |
| Range of change rates | 2.6 | 2.0 | 4.8 |
| Maximum erosion | -2.6 | -2.0 | -4.8 |
| Maximum accretion | 0.0 | 0.0 | 0.0 |
| Cape Krusenstern National Monument | |||
| Mean rate of change | 0.0 | -0.2 | -0.1 |
| Range of change rates | 3.3 | 3.8 | 6.5 |
| Maximum erosion | -1.1 | -3.1 | -3.6 |
| Maximum accretion | 2.2 | 0.8 | 3.0 |
Uncertain Futures for the Coastlines
The coasts of Bering Land Bridge NPres and Cape Krusenstern NM have become more dynamic over the last 60+ years (Figures 7 and 8, Table 1), probably due, in part, to an increase in the open-water season. Coastal landforms show no sign of being suddenly altered or radically modified by the changing sea ice regime; however, as the open-water season continues to lengthen, and the permafrost in coastal bluffs warms, shoreline geomorphic processes in Bering Land Bridge NPres and Cape Krusenstern NM may begin to change more rapidly. Shorelines now characterized by erosion may see erosion rates increase, and shorelines now experiencing sediment deposition may accrete more rapidly or convert to a new regime dominated by erosion. Despite such uncertainties, an understanding of how the coastline changed in the past, combined with further monitoring, can contribute to the effective management of coastal habitats and ecosystems, oil-spill response, marine debris collection, and the preservation of cultural artifacts within Bering Land Bridge NPres and Cape Krusenstern NM.
Acknowledgements
This project was funded by the NPS Climate Change Youth Initiative Fellowship and the NPS Inventory & Monitoring Division in collaboration with NPS ecologist David Swanson. We thank China Kantner and Sara Grocott for field assistance and Arctic Backcountry Flying Service in Kotzebue for safe transport to the field. Additional support provided by the National Science Foundation OPP-1745369 grant. Constructive reviews from Chris Maio and David Swanson greatly improved this article.
References
Barnhart, K. R., R. S. Anderson, I. Overeem, C. Wobus, G. D. Clow, and F. E. Urban. 2014.
Modeling erosion of ice-rich permafrost bluffs along the Alaskan Beaufort Sea coast. J. Geophys. Res. Earth Surf. 119: 1155-1179. https://doi.org/10.1002/2013JF002845
Darwent, J., O. K. Mason, J. F. Hoffecker, and C. M. Darwent. 2013.
1,000 years of house change at Cape Espenberg, Alaska: A case study in horizontal stratigraphy. Am. Antiq. 78: 433-455.
Farquharson, L. M., D. H. Mann, D. K. Swanson, B. M. Jones, R. M. Buzard, and J. W. Jordan. 2018.
Temporal and spatial variability in coastline response to declining sea-ice in northwest Alaska. Marine Geology 404: 71-83.
Farquharson, L. and B. M. Jones. 2017.
Changes in coastline elevation along the southern Chukchi Coast between 2004 and 2016, in: American Geophyical Union Fall Meeting 2017.
Giddings, J. L. 1966.
Cross-dating the archeology of northwestern Alaska. Science 80(153): 127-135.
Günther, F., P. P. Overduin, I. A. Yakshina, T. Opel, A. V. Baranskaya, and M. N. Grigoriev. 2015.
Observing Muostakh disappear: Permafrost thaw subsidence and erosion of a ground-ice-rich Island in response to arctic summer warming and sea ice reduction. Cryosphere 9: 151-178. https://doi.org/10.5194/tc-9-151-2015
Jones, B. M., C. D. Arp, M. T. Jorgenson, K. M. Hinkel, J. A. Schmutz, and P. L. Flint. 2009.
Increase in the rate and uniformity of coastline erosion in Arctic Alaska. Geophys. Res. Lett. 36(3), L03503. https://doi.org/10.1029/2008gl036205
Jordan, J. W. and O. K. Mason. 1999.
A 5,000-year record of intertidal peat stratigraphy and sea level change from northwest Alaska. Quat. Int. 60(1): 37-47. https://doi.org/10.1016/S1040-6182(99)00005-1
Mahoney, A. R., H. Eicken, A. G. Gaylord, and R. Gens. 2014.
Landfast sea ice extent in the Chukchi and Beaufort Seas: The annual cycle and decadal variability. Cold Reg. Sci. Technol. 103: 41-56. https://doi.org/10.1016/j.coldregions.2014.03.003
Manley, W. F. and L. R. Lestak. 2012.
Protocol for high-resolution geospatial analysis of coastal change in the Arctic Network of Parks. National Park Service, Fort Collins, Colorado.
Manley, W. F., D. M. Sanzone, L. R. Lestak, and E. G. Parrish. 2007a.
High-resolution orthorectified imagery from approximately 1980 for the Coastal Areas of Bering Land Bridge NP (BELA) and Cape Krusenstern NM (CAKR), Northwest Alaska, report, Arctic Network Invent. and Monit. Program, Natl. Park Serv., Fairbanks, Alaska.
Manley, W. F., D. M. Sanzone, L. R. Lestak, E. G. Parrish, D. M. Sanzone, and L. R. Lestak. 2007b.
High-resolution orthorectified imagery from approximately 1950 for the coastal areas of Bering Land Bridge NP (BELA) and Cape Krusenstern NM (CAKR), northwest Alaska, report, Arctic Network Invent. and Monit. Program, Natl. Park Serv., Fairbanks, Alaska.
Mason, O. K. and J. W. Jordan. 1993.
Heightened north pacific storminess during synchronous late holocene erosion of northwest Alaska beach ridges. Quat. Res. 40: 55-69. https://doi.org/10.1006/qres.1993.1056
Panda, S., V. Romanovsky, and S. Marchenko. 2016.
High-resolution permafrost modeling in the Arctic Network National Parks, Preserves, and Monuments. Natural Resource Report NPS/ARCN/NRR—2016/1366. National Park Service, Fort Collins, Colorado. https://doi.org/10.13140/RG.2.2.18127.89767
Radosavljevic, B., H. Lantuit, W. Pollard, P. Overduin, N. Couture, T. Sachs, V. Helm, and M. Fritz. 2016.
Erosion and Flooding—Threats to Coastal Infrastructure in the Arctic: A Case Study from Herschel Island, Yukon Territory, Canada. Estuaries and Coasts 39: 900-915. https://doi.org/10.1007/s12237-015-0046-0
Stroeve, J., M. Serreze, M. Holland, J. Kay, J. Malanik, and A. Barrett. 2012.
The Arctic’s rapidly shrinking sea ice cover: a research synthesis. Clim. Change 110: 1005-1027. https://doi.org/10.1007/s10584-011-0101-1
Thieler, E. R., E. A. Himmelstoss, J. L. Zichichi, and A. Ergul. 2009.
The Digital Shoreline Analysis System (DSAS) version 4.0-an ArcGIS extension for calculating shoreline change. U.S. Geological Survey.
Timmermans, M. L. and A. Proshutinsky. 2015.
Sea surface temperature, in: Blunden, J., Arndt, D. (Eds.), State of the Climate in 2014. Bulletin of the American Meteorological Society pp. ES1-ES32.
Wetterich, S., G. Grosse, L. Schirrmeister, A. A. Andreev, A. A. Bobrov, F. Kienast, N. H. Bigelow, and M. E. Edwards. 2012.
Late Quaternary environmental and landscape dynamics revealed by a pingo sequence on the northern Seward Peninsula, Alaska. Quat. Sci. Rev. 39: 26-44. https://doi.org/http://dx.doi.org/10.1016/j.quascirev.2012.01.027
Last updated: October 26, 2021
