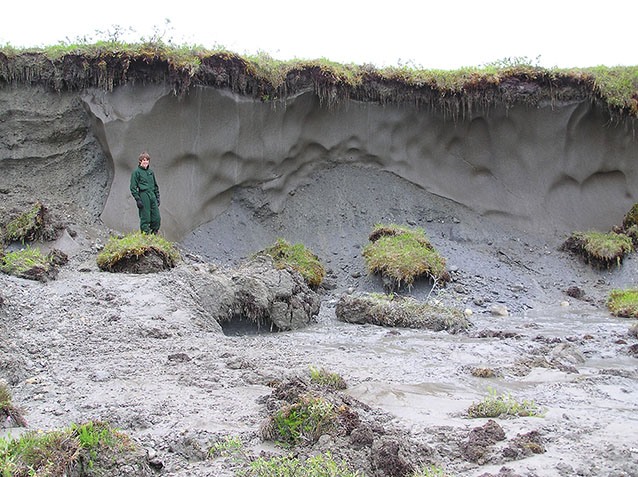
A skeleton is to a human body what permafrost is to Arctic land.
NPS Photo / David Swanson
Permafrost is ground that remains frozen year-round due to a cold climate; the active layer is the ground above the permafrost that thaws and re-freezes each year. Nearly 40 million acres of National Park Service (NPS) land in Alaska, similar to the size of Florida, lie within the zone of continuous or discontinuous permafrost. Permafrost can be classified as continuous (>90% of land area underlain by permafrost), discontinuous (90%-50%), sporadic (50%-10%), or isolated (<10%; Ferrians 1965). Permafrost is most vulnerable to climatic warming when its temperature is within a few degrees of thawing. Large-scale permafrost thawing would lead to a major reconfiguration of the landscape through the development of thermokarst (irregular topography resulting from ground ice melting).
In the last half century, an increase in ground temperature and profusion of thermokarst landforms throughout Alaska confirm thawing and degradation of permafrost in response to a warming climate. As a result, the ecosystem, landscape, and wildlife habitat in permafrost-affected land are in rapid transition, with both environmental implications and management challenges. Thawing permafrost has many consequences, such as drying lakes, new pond creation, soil erosion, ground slumps, increased sediment loads and siltation of streams and lakes, release of greenhouse gasses, and changes in soil wetness and nutrient cycling. Thawing permafrost is the second most important disturbance to boreal forests after wildfires (Jorgenson and Osterkamp 2005). Because of its indispensable role in maintaining northern ecosystems’ health and vitality, permafrost is monitored in Alaska’s parks (MacCluskie and Oakley 2005, Lawler et al. 2009).
Using Models to Map Permafrost
Because it is located under the surface, permafrost is difficult to observe and map directly. Existing knowledge of the distribution and temperature of permafrost in parks is very limited due to the paucity of borehole observations (direct measurements of temperature from boreholes drilled into the Earth’s crust) and temperature monitoring sites required to evaluate permafrost health. With sufficient soil, environmental, and climate data, however, the current distribution and temperature of near-surface permafrost can be reliably predicted. By using projected climate data and scenarios, the same models used to predict the current distribution of permafrost can also predict its future distribution.
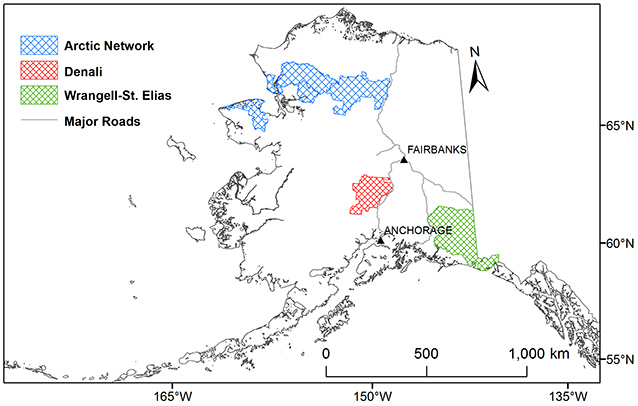
In recent work, we created improved and higher-resolution maps of permafrost distribution, temperature, and active-layer thickness for parks (Figure 1) under recent past, present, and future climate conditions. We used a permafrost model called GIPL 1.0 (Geophysical Institute Permafrost Laboratory 1.0) to assess the effect of a changing climate on permafrost. Using the GIPL 1.0 model, Marchenko and colleagues (2008) mapped permafrost distribution for the State of Alaska (at 1 kilometer scale). Using vegetation, soil, and temperature data for all the park units (Stevens et al. 2001, Clark and Duffy 2006, Stumpf 2007, Jorgenson et al. 2008a) with past and projected climate data from global climate datasets, we created 30 meter-resolution maps of near-surface permafrost distribution, temperature, and active-layer thickness for the recent past (the 1950s and 2000s decades) and the future (2050s decade).
We used historical (1901-2009) monthly average air temperature (°C) and total precipitation (millimeters; mm; CRU TS 3.1 from the University of East Anglia, UK, Climatic Research Unit) downscaled to 771 meters by the Scenario Network for Alaska and Arctic Planning (SNAP) for past climate forcing (SNAP 2012), and used projected (2001-2100) monthly average air temperature (°C) and total precipitation (mm) data from the Intergovernmental Panel on Climate Change (IPCC) Fourth Assessment Report (AR4) Global Climate Models (GCM) under a moderate greenhouse gas emission scenario for the future climate forcing (Walsh et al. 2008). We also used field observations of permafrost presence/absence, summer thaw depths, and ground temperature records from NPS monitoring stations to assess the accuracy of the modeled permafrost maps.
We created maps of near-surface permafrost dynamics including permafrost distribution, temperature, and active layer thickness for five parks in Arctic Alaska (Bering Land Bridge, Cape Krusenstern, Kobuk Valley, Gates of the Arctic, and Noatak) and two in interior Alaska (Denali and Wrangell-St. Elias). These are an immense improvement over the existing permafrost maps, whether produced through the spatially explicit thermal modeling of ground temperatures or by visual interpretation of satellite images and aerial photos using indirect surface evidence of permafrost, or by compilation of information from detailed field soil, geology, or ecotype surveys.
Arctic Parks’ Permafrost at Risk
In the Arctic parks, we found the distribution of near-surface permafrost—permafrost immediately below the active layer—could decrease from the current 99% of the total area to 91% by 2060 with little or no change in the distribution of deeper permafrost. Thermokarst landforms will continue to alter the land as a result of deepening active layers and melting ground ice; after 2060, widespread permafrost loss is likely.
We analyzed data across five Arctic parks: Gates of the Arctic, Noatak, Kobuk Valley, Cape Krusenstern, and Bering Land Bridge (Figure 1). The average decadal air temperature was -5.2 ± 1.9 °C for the 2000s and the modeled average decadal permafrost temperature was -4.0 ± 1.8 °C (Table 1). Near-surface permafrost was mapped under 99% of the Arctic parks in the 2000-09 decade. The decadal average air temperature for 2050s is projected to be 2.1 °C warmer than for the 2000s; under these conditions, the model predicted a 1.4 °C increase in average permafrost temperature by the 2050s, and near-surface permafrost under 91% for these parks (Figure 2).
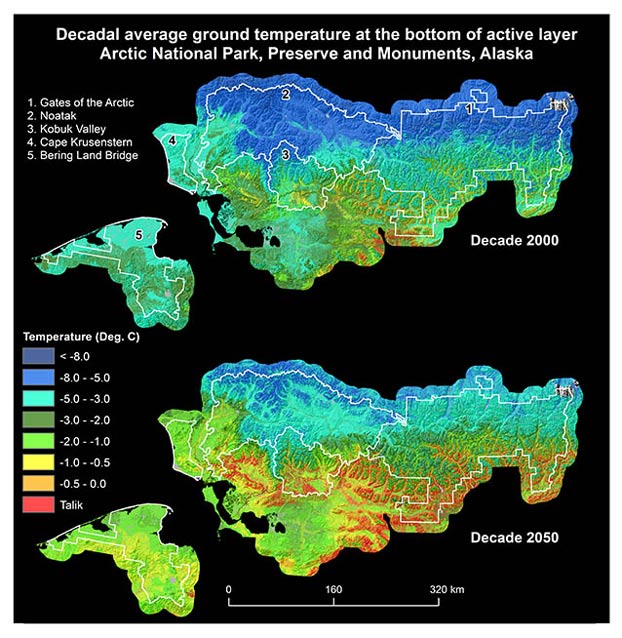
While this may or may not seem like a big loss depending on one’s perspective, the area of most vulnerable permafrost—permafrost within one degree of thawing—is predicted to increase from 4% in 2000s to 15% in 2050s. In other words, the loss of near-surface permafrost could be three times higher than predicted by our model if the climate warms a degree more than what current climate models suggest. According to the global climate models, the Arctic climate will continue to warm and the average decadal air temperature will increase by another 2.4 °C by the 2090s, for a total of 4.5 °C increase in the air temperature between the 2000s and 2090s. This will undoubtedly cause further increase in ground temperature and dramatic loss of near-surface permafrost. By the end of this century, only half of the Arctic parks are predicted to be underlain by near-surface permafrost (within the top 3 m of the ground surface), most of which will be in the northern half of Noatak and Gates of the Arctic (Panda et al. 2016).
NPS began collecting ground temperature data at twenty-one sites within Arctic parks in 2011. According to Swanson (2016), the air and soil temperatures at the newly installed monitoring stations have increased by 3-4 °C during the monitoring period from 2011-2015. Comparing modeled ground temperature for the 2000s with recorded temperatures (2011-2015), we found the modeled ground temperatures are 0.2-4.2 °C colder at fourteen sites and 0.4 °C warmer at two sites. In light of Swanson’s (2016) observations, the modeled ground temperature for the 2000s would be very close to the actual ground temperature of the modeled time period (2000-2009). We found 100% agreement between the modeled permafrost map for 2000s and field observations of permafrost presence at 575 sites.
Interior Alaska Likely to Experience Severe Permafrost Loss
For the interior Alaskan parks, the loss of near-surface permafrost will be severe—in Denali the distribution of near-surface permafrost is expected to decrease from the current 51% to 6%, and in Wrangell-St. Elias from the current 51% to 30% by 2060. Taliks (unfrozen ground above the permafrost) will replace the ground previously occupied by permafrost (Table 1).
Table 1. Summary statistics of climate and modeled permafrost characteristics in the Arctic network, Denali National Park and Preserve, and Wrangell-St. Elias National Park and Preserve. Climate data for 1950s and 2000s are from CRU dataset and for 2050s is from 5-GCM composite dataset. The permafrost statistics are from the output of GIPL 1.0 model runs.
|
Arctic Network Parks |
1950-1959 |
2000-2009 |
2051-2060 |
|---|---|---|---|
|
Mean decadal air temperature (°C) |
-7.0 ± 2.0 |
-5.2 ± 1.9 |
-3.1 ± 1.9 |
|
Mean decadal precipitation (mm) |
455 |
472 |
499 |
|
Mean decadal permafrost temperature (°C) |
-5.5 ± 1.7 |
-4.0 ± 1.8 |
-2.6 ± 1.6 |
|
Permafrost distribution (% of total area) |
100 |
99 |
91 |
|
Permafrost warmer than -1 °C (% of total area) |
0 |
4 |
15 |
|
Mean decadal active-layer thickness (ALT)(m)1 |
0.62 ± 0.20 |
0.67 ± 0.26 |
0.74 ± 0.31 |
|
Denali National Park and Preserve |
1950-1959 |
2000-2009 |
2051-2060 |
|
Mean decadal air temperature (°C) |
-3.5 ± 1.5 |
-1.6 ± 1.5 |
-0.2 ± 1.5 |
|
Mean decadal precipitation (mm) |
679 |
651 |
845 |
|
Mean decadal permafrost temperature (°C) |
-2.1 ± 1.2 |
-1.1 ± 1.2 |
-1.3 ± 2.2 |
|
Permafrost distribution (% of total area) |
75 |
51 |
6 |
|
Permafrost warmer than -1 °C (% of total area) |
8.5 |
30 |
4 |
|
Mean decadal ALT (m)1 |
1.1 ± 0.3 |
1.1 ± 0.3 |
1.1 ± 0.4 |
|
Wrangell-St. Elias National Park and Preserve |
1950-1959 |
2000-2009 |
2051-2060 |
|
Mean decadal air temperature (°C) |
-3.0 ± 2.5 |
-2.4 ± 2.4 |
-0.9 ± 2.4 |
|
Mean decadal precipitation (mm) |
1144 |
1110 |
1505 |
|
Mean decadal permafrost temperature (°C) |
-2.2 ± 1.7 |
-1.9 ± 1.5 |
-1.5 ± 1.4 |
|
Permafrost distribution (% of total area) |
74 |
51 |
30 |
|
Permafrost warmer than -1 °C (% of total area) |
22 |
22 |
18 |
|
Mean decadal ALT (m)1 |
1.2 ± 0.6 |
1.2 ± 0.5 |
1.31 ± 0.6 |
1The active-layer thickness (ALT) statistics does not include ALT for areas with talik above the permafrost table.
Denali National Park and Preserve
Our model predicted near-surface permafrost under 51% of Denali’s total area for the 2000s and 6% in the 2050s (Table 1 and Figure 3). If the climate continues to warm as the current global climate models suggest, Denali will experience a dramatic loss of near-surface permafrost in the next half century. Only tiny areas on the north-facing slopes of high mountains are expected to have near-surface permafrost in the 2050s (Panda et al. 2014a).
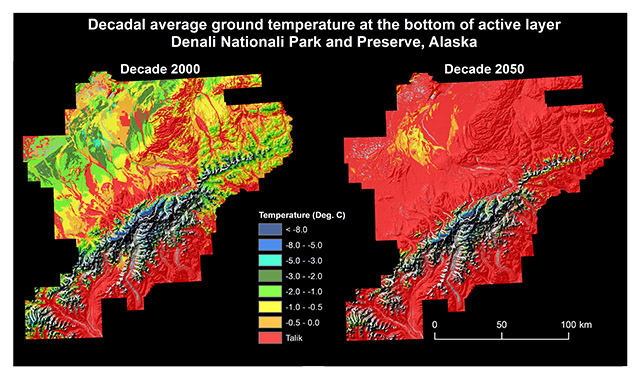
Only three climate stations within Denali have some recorded ground temperature data. We found less than 1 °C difference between recorded near-surface ground temperatures (at 0.02 m) and modeled ground surface temperatures at these stations. Also, we found 86% agreement between the modeled permafrost map for 2000s and field observations of permafrost presence/absence at 1,375 sites.
Wrangell-St. Elias National Park and Preserve
Our model predicted near-surface permafrost under 51% of Wrangell-St. Elias’ total area for the 2000s and 30% in the 2050s (Table 1 and Figure 4). If the climate continues to warm as the current global climate models suggest, it will also experience substantial loss of near-surface permafrost in the next half century (Panda et al. 2014b).
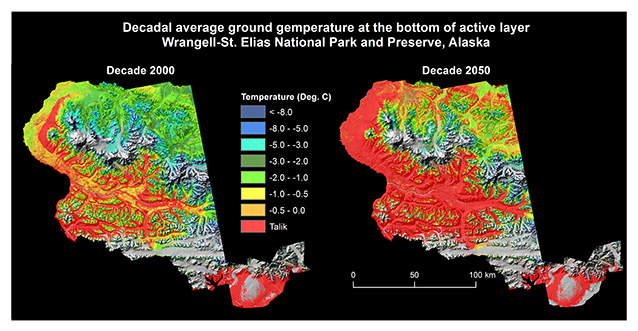
Only two climate stations within Wrangell-St. Elias have useful recorded ground temperature data. The difference between recorded near-surface ground temperatures (at 0.05 m) and modeled ground surface temperatures were less than 1°C at Chicken Creek and 2.0 °C at Gates Glacier. Also, we found a 91% agreement between modeled permafrost map for the 2000s and field observations of permafrost presence/absence at 430 sites.
Warmer Temperatures and Other Factors will Continue to Accelerate Permafrost Loss
At present, permafrost is continuous in Arctic parks, and discontinuous in Denali and Wrangell St.-Elias (Jorgenson et al. 2008b). We expect the distribution of permafrost will still be continuous in Arctic parks by the 2050s; however, it is very likely that the distribution of permafrost in Denali and Wrangell-St. Elias will become sporadic by the 2050s. If projections of current global climate models hold true, near-surface permafrost underneath 45% of Denali and 21% of Wrangell-St. Elias could be lost by the 2050s with deeper permafrost loss in many places.
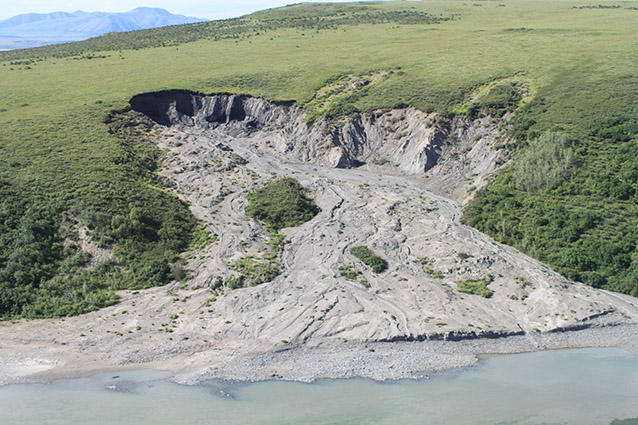
Our modeling results suggest the average temperature of near-surface permafrost increased by 1.5 °C in Arctic units, by 1 °C in Denali, and by 0.3 °C in Wrangell-St. Elias in 50 years between the 1950s and 2000s. This warming of permafrost is primarily responsible for the landscape reconfiguration that is ongoing in the parks today. Degradation of ice-rich permafrost is resulting in thermokarst, ponding of low-lying areas, lake drainage, and ground failures such as active layer detachment slides, retrogressive thaw slumps, and gully erosion. Jorgenson and colleagues (2008c) reported a 3.5% to 8% increase in thermokarst-affected areas over the past 50 years in Alaska. Swanson (2013, 2014) reported occurrence of numerous thaw slumps in Arctic parks. Balser and colleagues (2009) reported a two-fold increase in the number of thermokarst features over the total surface area of affected landscape in the Feniak Lake region of Noatak National Preserve over 25 years (1981-2006). The current global climate models suggest another 1.4-2.1 °C of warming by the end of the 2050s under moderate greenhouse gas emission scenario (SNAP 2012). This magnitude of future warming will lead to substantial loss of permafrost in parks and consequent proliferation of permafrost-thaw effects like those that occurred due to the pre-2000 warming.
The model that we used assesses the effect of a changing climate on permafrost, but is limited in its ability to incorporate associated changes in vegetation over time, which could also affect near-surface permafrost dynamics. As we used past and projected climate data for modeling, the output permafrost maps show the impact of a changing climate on near-surface permafrost temperature and its distribution. Though we assumed no change in vegetation dynamics for our modeling time periods, the natural disturbances from wildfire and flooding will likely alter the vegetation structure and composition, and consequently, the model’s prediction accuracy at those sites in the future.
How to Use this Information
We hope these permafrost maps help park mangers understand the current status of near-surface permafrost within parks and how it may evolve in the future with a changing climate. These results can be used to identify vulnerable sites and landscapes at higher risk of permafrost thawing, with concurrent changes to wildlife habitats and ecosystem function. This can inform critical management decisions on the use of park resources and public access, and evaluate the impacts of climate change on parks’ infrastructure, ecosystems, and wildlife habitat.
NPS Photo / Rory Nichols
References
Balser, A. W., M. N. Gooseff, J. B. Jones, and W. B. Bowden. 2009.
Thermokarst distribution and relationship to landscape characteristics in the Feniak Lake region, Noatak National Preserve, Alaska. National Park Service Report, Pages: 12.
Clark, M. H. and M. S. Duffy. 2006.
Soil survey of Denali National Park area, Alaska. National Cooperative Soil Survey, 822 p.
Ferrians, O. J., Jr. 1965.
Permafrost map of Alaska. United States Geological Survey Miscellaneous Investigation, Map I-445, scale 1:2,500,000.
Jorgenson, M. T. and T. E. Osterkamp. 2005.
Response of boreal ecosystems to varying modes of permafrost degradation. Canadian Journal of Forest Research 35:2100–2111.
Jorgenson, M. T., J. E. Roth, P. F. Loomis, E. R. Pullman, T. C. Cater, M. S. Duffy, W. A. Davis, and M. J. Macander. 2008a.
An ecological survey for landcover mapping of Wrangell-St. Elias National Park and Preserve. Natural Resource Technical Report NPS/WRST/NRTR—2008/094. National Park Service, Natural Resource Program Center, Fort Collins, CO.
Jorgenson, M. T., K. Yoshikawa, M. Kanevskiy, and Y. Shur. 2008b.
Permafrost characteristics of Alaska. Institute of Northern Engineering, University of Alaska Fairbanks, 1 Sheet, Scale 1: 7,200,000.
Jorgenson, M. T., Y. Shur, and T. E. Osterkamp. 2008c.
Thermokarst in Alaska. In the proceedings of Ninth International Conference on Permafrost, June 2008, Vol. 1: 869-876.
Lawler, J. P., S. D. Miller, D. M. Sanzone, J. Ver Hoef, and S. B. Young. 2009.
Arctic network vital signs monitoring plan. Natural Resource Report NPS/ARCN/NRR—2009/088. U.S. Department of the Interior, National Park Service, Natural Resource Program Center, Ft. Collins, CO.
MacCluskie, M., and K. Oakley. 2005.
Vital signs monitoring plan, Central Alaska Network. U.S. Department of the Interior, National Park Service, Fairbanks, AK.
Marchenko, S. S., V. E. Romanovsky, and G. Tipenko. 2008.
Numerical modeling of spatial permafrost dynamics in Alaska. In the Proceedings of Ninth International Conference on Permafrost, June 2008, Vol. 2: 1125–1130.
Panda, S. K., S. S. Marchenko, and V. E. Romanovsky. 2014a.
High-resolution permafrost modeling in Denali National Park and Preserve. Natural Resource Technical Report NPS/CAKN/NRTR—2014/858. National Park Service, Fort Collins, Colorado.
Panda, S. K., S. S. Marchenko, and V. E. Romanovsky. 2014b.
High-resolution permafrost modeling in Wrangell-St. Elias National Park and Preserve. Natural Resource Technical Report NPS/CAKN/NRTR—2014/861. National Park Service, Fort Collins, Colorado.
Panda, S. K., V. E. Romanovsky, and S. S. Marchenko. 2016.
High-resolution permafrost modeling in Arctic national parks of Alaska. Natural Resource Technical Report NPS/ARCN/NRTR—2016/xxx. National Park Service, Fort Collins, Colorado. (In preparation)
Scenarios Network for Alaska and Arctic Planning (SNAP). 2012.
Tools and Data, Data. Available at: http://www.snap.uaf.edu/data.php (accessed March 28, 2016).
Stevens, J. L., K. Boggs, A. Garibaldi, J. Grunblatt, and T. Helt. 2001.
Denali National Park and Preserve landcover mapping project Volume 1: Remote sensing data, procedures and results. Natural Resource Technical Report NPS/DENA/NRTR—2001/001. National Park Service, Fort Collins, CO.
Stumpf, K. 2007.
Wrangell-St. Elias National Park and Preserve landcover mapping project. Natural Resource Technical Report NPS/WRST/NRTR—2008/095. National Park Service, Fort Collins, CO.
Swanson, D. K. 2013.
Monitoring of Retrogressive Thaw Slumps in the Arctic Network, 2012. Natural Resource Data Series NPS/ARCN/NRDS—2013/591. Fort Collins, Colorado: National Park Service.
Swanson, D. K. 2014.
Mapping of Erosion Features Related to Thaw of Permafrost in the NPS Arctic Inventory and Monitoring Network, Alaska. Natural Resource Technical Report NPS/ARCN/NRTR—2014/912. Fort Collins (CO): National Park Service. https://irma.nps.gov/App/Reference/Profile/2216465.
Swanson, D.K. 2016.
Soil temperatures in Alaska’s Arctic National Parks, 2011-2015, and implications for permafrost stability. Natural Resource Report NPS/ARCN/NRR—2016/1109. National Park Service, Fort Collins, Colorado.
Walsh, J. E., W. L. Chapma, V. E. Romanovsky, J. H. Christensen, and M. Stendel. 2008.
Global climate model performance over Alaska and Greenland. America Meteorological Society 21:6156–6174.
Part of a series of articles titled Alaska Park Science - Volume 16 Issue: Science in Alaska's Arctic Parks.
Tags
- bering land bridge national preserve
- cape krusenstern national monument
- denali national park & preserve
- gates of the arctic national park & preserve
- kobuk valley national park
- noatak national preserve
- wrangell - st elias national park & preserve
- permafrost
- climate change
- science
- research
- alaska park science
- arcn
- cakn
- alaska
- forces of nature
- ak1
Last updated: October 26, 2021
