Last updated: April 7, 2025
Article
Using 3D Documentation to Create 2D Maps of Carlsbad Caverns
National Center for Preservation Technology and Training
This presentation, transcript, and video are of the Texas Cultural Landscape Symposium, February 23-26, 2020, in Waco, TX. Watch a non-audio described version of this presentation on YouTube.
National Park Service
Kimball Erdmann: Okay. I think you can see why I enjoy working with the Center for Advanced Spatial Technologies (CAST) and with Malcolm. They know how to do some really cool things. Point clouds is just one. I do have to say that I've worked with them. I've been at the University of Arkansas in the Department of Landscape Architecture in the Faye Jones School of Architecture. I teach courses in the history of landscape architecture and in historic landscape preservation as well as some other courses, but that's what I love. Since I've been there for 10 years, most of the projects that I've done have involved CAST in some way or another and I think you can see why with the abilities. Malcolm is one of 25 or so staff that they have and they have all kinds of cool things.
One of the things I won't be talking today about is the application of the Secretary of Interior Standards for preservation, specifically of reconstruction to digital landscape reconstruction and we've done this for the Buffalo National River, and on a much larger scale, we've been working on Japanese internment camps. For the relocation center at Rohwer in Southeast Arkansas we have a digital reconstruction that we've done of this landscape that today has almost no integrity left, but that's another topic that some of the things that we've been able to do with CAST because of the wonderful staff that they have and the expertise that they have. So my purpose today is to talk to you about how we took this point cloud and actually put it to use in terms of the cultural landscape inventory. I will say in 20 plus years of my career working with cultural landscapes, this is the first time I've had an opportunity to work on a subterranean cultural landscape, which is quite spectacular, as you can see.
Kimball Erdmann, University of Arkansas
What I won't be doing today is I won't be going into detail as to why the underground portion of Carlsbad Caverns National Park is a cultural landscape, but I think from what you guys have seen so far in this conference that you could probably understand that yes, indeed, the underground portion of Carlsbad Caverns is a cultural landscape and it does deserve our attention. Okay. Before I dive into Carlsbad though, I do want to talk about one other project that we used a laser scan for that CAST assisted us with and you see these first several slides are going to go through that project because it applies to what we'll be talking about, which is really the benefits that I've seen in two projects now where we're using laser scans and point clouds for traditional documentation tools such as historic American landscape survey or HALS in cultural landscape inventories is the CLI.
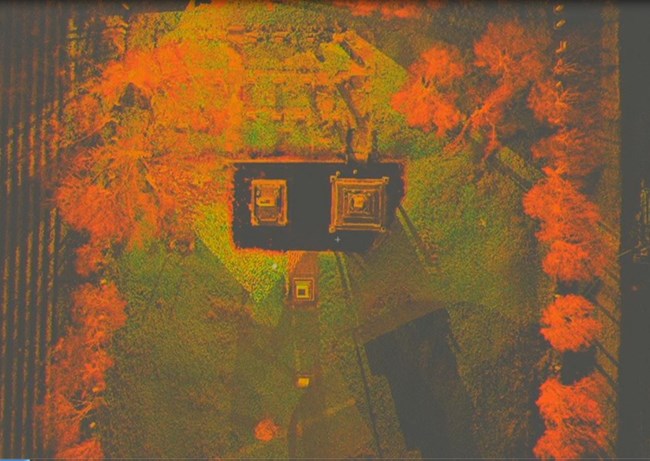
The first project that you're looking at here is the Rohwer Memorial Cemetery. It was designed and built by a single Japanese American internee at Rohwer, who built the cemetery for some of the folks that died in between 1942 and 45. He designed and built all the monuments and when we documented the cemetery in 2012, it was in a very poor state. So, we did HALS documentation and since then the monuments have been stabilized and conserved. But we worked with CAST to do laser scans of the site and we used two different scanners in order to produce the materials. The most obvious benefit I think that comes from using a laser scan is that, and Malcolm already mentioned this, you're going to get the most accurate and potentially most detailed plans, sections, elevations that you could get by any other means. You can get potentially through the point cloud and I'll be demonstrating that first here.
Kimball Erdmann, University of Arkansas
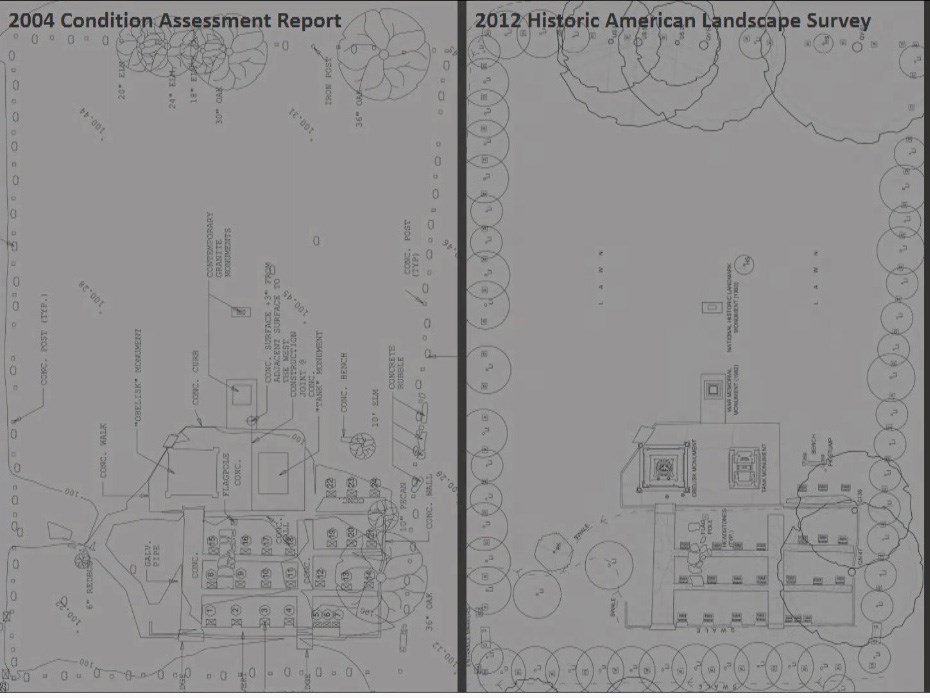
In this particular project, we use the point cloud to get to the drawings. We ended up not using the point cloud in the final product. We use this data to produce the plans. What you're looking at on the right is the plan that we created of the cemetery using the point cloud. The one on the left is one that was created in 2004 by another team that was documenting in the cemetery. They're using traditional analog means of measurements. We were using the point cloud. Our drawings that may be a little difficult to see here, but our drawings are much more detailed and accurate than the survey conducted just a few years prior. That's even more noticeable in the elevations of the various monuments. Again, on the left is the 2004 set of drawings and our drawings on the right and again, the proportions are much more accurate.
One thing that we did find though is that the scan was not at a high enough resolution that we could see the detail on these monuments. These are extremely detailed concrete monuments that were constructed and the point cloud was too difficult for us to determine that detail, but we devised the technique where we drew it an extremely accurate elevation based off of that point cloud data. And then we're able to take that framework, bring it into Photoshop, stretch photographs over it to fit that data. And once we had that information, and you're not going to see any of it from with this screen, but we made these incredibly detailed drawings that were part of the HALS set that's at the Library of Congress, which you can see here, each of the monuments and the overall cemetery. So again, amount of detail that you can produce with this point cloud and potential and the accuracy is extremely high. That's also true for Carlsbad.
Kimball Erdmann, University of Arkansas
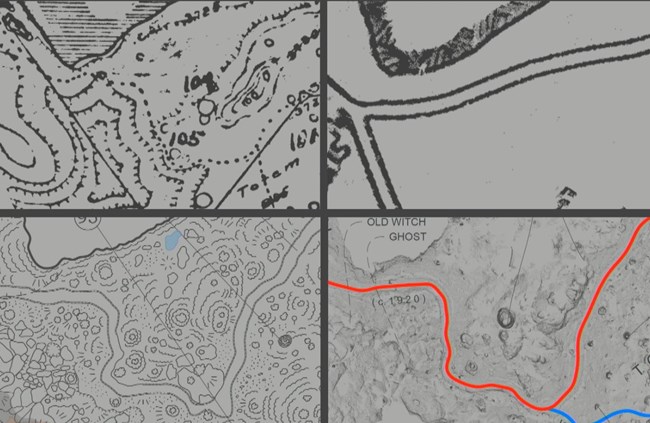
There are significant advantages to our CLI project at Carlsbad as well. We took a very different approach though when we got to Carlsbad in which we decided to keep the point cloud data rather than setting it aside and kind of discarding it when we're done with the drawings, but to incorporate the point cloud into our final set of drawings. This drawing down here is the one that we produced and just barely finished and it uses the point clouds that Malcolm and his team produced that you see here, so that is the finished product. We're incorporating those into the final drawings.
What you're looking at in these other images are maps of the cave of the same little spot, produced at other times in the past, including a rather detailed set not too long ago in 2014 which is quite commendable, but you can see even in this one that we decided ultimately that the amount of detail and information that could be gathered from these plans was much higher if we simply left the point cloud in place and allowed that to communicate rather than trying to draft over it in some two dimensional means.
So, the end result that we see here again is the most highly detailed and accurate set of plans ever produced for Carlsbad Caverns, thanks to this technology. You won’t be able to see this very well but for the record, Malcom flew us right down to about there. So, we had a long way to go. We just got started. There’s over three and a half miles of trails here, so yes, it takes quite a while to fly through the whole thing.
Kimball Erdmann, University of Arkansas
The second advantage that I think is also rather obvious when it comes to using terrestrial laser scanning is the ability to work on a site remotely. We could go back to the site as often as we needed to from our remote location in Arkansas by going into the point cloud and being able to explore from this remote position even though we did many site visits as well.
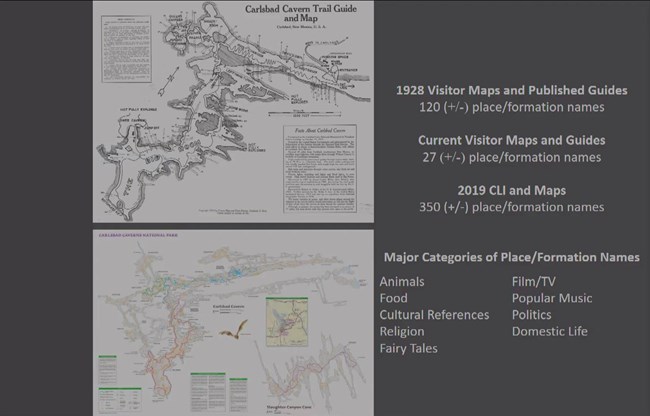
There were also always additional features to inventory, as we delved further and further into the report. The point cloud allowed us to inspect and quantify man-made features in a comprehensive manner. In addition, the point cloud greatly enhanced our ability to study natural features. One of the most significant aspects of the Carlsbad Caverns cultural landscape is the long-held practice of bestowing names on cave rooms, formations, and other natural features. During our research, we discovered documentation of over 350 rooms and features that had been named over the past 100 years of exploration inside this most visited portion of the cave. So, 350 names and they're inspired by a wide range of topics including popular music, film, politics, religion, fairy tales, etc. Two documents, for example, published in 1928 feature over 120 named features, more than any other published source, until the publication of our CLI.
Most of those names of the 350 names that I'm mentioning here, most were passed on by oral tradition by the rangers that led all cave tours up until 1967. With the shift to self-guided tours in the late 1960s and early 1970s, along with an ever-increasing emphasis on scientific interpretation rather than the fantastic, the majority of these 350 place names have been long since forgotten.
Speaker 2: What do you mean by place names?
Kimball Erdmann: So, if we go into this area, for example, this is the big room, so we're naming places and formations based off of the whims of the person bestowing the name such as Rock of Ages, for example. So we'll get into some of those in just a moment. What I will say is that most of those names have been forgotten. The best record that a visitor can get today is by buying a separate map from National Geographic and that map features 27 names. When you compare that to the 350 names over the past a hundred years, you can see just how much has been forgotten of that cultural landscape.
Through much research, many site visits and even more time exploring the point cloud, we are able to map, find and photograph and describe almost all of those 350 names. So those are all in our CLI. For example, in the 1928 map, which again is this map here in this 1928 map that points to a formation that is called Andy Gump. We had no written description in that guide about what Andy Gump was, what type of formation it was, what it might look like. It just pointed to this general area and said, Andy Gump. And when we explored the cave and looked for this formation, we couldn't find it. So, we just didn't know what it looked like.
However, by examining the point cloud, the point cloud allowed us to zoom in on there. And by the way, it wasn't helped by the fact that this area was also dimly lit. In the point cloud, we were able to go into the point cloud and zoom in and look around and we're actually able to find this formation. This formation here, which is a little difficult to see, but it's a seven foot long slab of rock that is about a foot thick and it's propped up on a very narrow rock, is about 21 inches wide, right here, that resembles in profile this comic strip character Andy Gump from 1917 and it's even harder to see over here, but this is the matching image that we found in the point cloud. Once we found it in the point cloud, we're able to go back to the cave, find it in real life and photograph it for the report and we're able to do that over and over again.
Kimball Erdmann, University of Arkansas
This is our typical symbol key that we use in the drawings and we didn't know at the time of our initial site visits just how much we're going to attempt to document of this cultural landscape. And by having this point cloud, we were able to, in the office, if we decided we wanted to add features, lights, electrical panels, railings etc., we could go back and do this extensive inventory over this three and a half mile cave system and simply tally all those elements without having to go back into the field to do that. So having the point cloud, gave us the flexibility to expand this symbol key to document much more than we had originally anticipated.
Back to formations. This is another example. In this particular case, we knew of the witches face. We had a pretty good description of it, but we couldn't find it either until we found this photograph from 1962 and if you look closely, here's the eye. This is in profile. So here's the eye with a beaked nose, the mouth, chin, long hair, she even has some whiskers. So this is the witch's face and we couldn't find her until we found this photograph. Once we found the photograph, we were able to find it in the point cloud. And again, once we found it in the point cloud positioned from the trail, we're able to mark that on a map, go back to the cave, and find the photograph that matched.
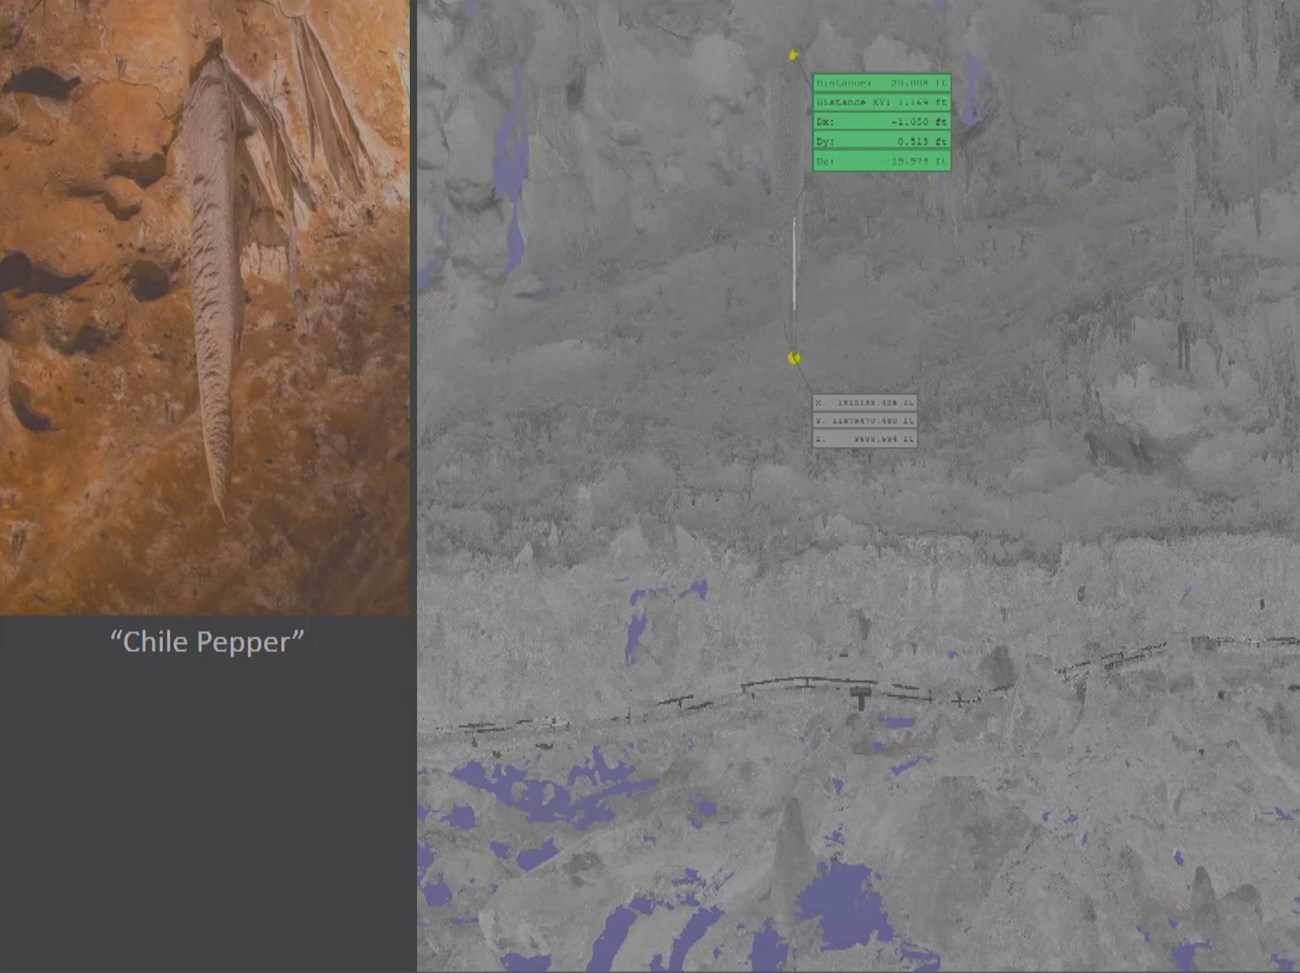
Another distinct advantage to being able to visit this site remotely is to be able to take measurements of all sorts, and Malcolm alluded to this as well. As you can imagine, this could be a very dangerous venture to go and take measurements inside the cave, not only for the people taking the measurements but for the formations also and they are subject to breaking and to vandalism. So in this particular case, our last site visit where we went this past fall, we thought we were done identifying formations. We had an awful lot by then, but this was the last one I think that one of the Rangers pointed out to us and said, by the way, we all call this the Chili Pepper. And so Chili Pepper, you know it's hanging way up above the roof here. It's actually much larger than I anticipated. It's 20 feet long and we're able to find that out by simply in a matter of seconds. You can click on the point cloud, you find it in point cloud. You can simply take a measurement and take any measurement you want of anything that's there, so it greatly aided our ability to describe the formations and various features that were there. It saved us a lot of time in the office. You can see there's an awful lot of upfront time of course to get this far, but once we have that information, it's very easy to take any type of measurement that we need.
Kimball Erdmann, University of Arkansas
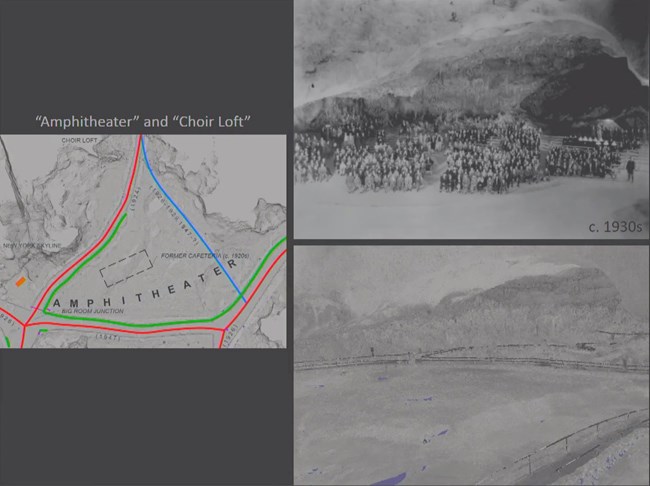
A less obvious but equally beneficial use of the TLS data proved to be the observation analysis of subtle remnants of landscape characteristics from former periods that were difficult or impossible to detect from the field, such as former trails. An excellent demonstration of this point can be seen at this area which is known historically as the Amphitheater. Today, this area is known by Rangers somewhat inaccurately as the Old Lunchroom. While this area did serve briefly as a lunchroom in the late 1920s just for a matter of a year or so, very briefly, it subsequently operated as an amphitheater for over 15 years from 1932 up to 1947. It was an area that was a low depression in the cave floor to begin with. After it had served as a lunchroom, it was then scraped out even further and shaped into this bowl where performances could be held inside the cave in this area known as the amphitheater.
In 1947 it was subsequently filled in. The amphitheater even hosted the performance of Franzoso Haydn's oratorio, The Creation in 1933, featuring a 160 voice strong choir, a full orchestra, and an audience of over 1000 people accommodated in 12 rows of concentric seating in this amphitheater. Misunderstandings of the site's creation in history led to a partial excavation of the amphitheater area in the 1990s in a somewhat misguided effort to restore the cave floor, and today the site bears little resemblance. Here's a view of the site today and in the past, but it bears little resemblance to its past use and past appearance.
It's also was extremely difficult for us to understand this space and where exactly it was and how it was oriented because it is so drastically different today than it was from historic photographs that we found. Just to make matters worse, the historic photographs that we did find such as this one were mislabeled in the archive as the old Lunch Room, which again was a prior period and it was a different configuration than it was prior to the construction of this amphitheater. So that made things even worse. But we finally figured out that these were indeed of the amphitheater and then we had to figure out where this image was taken from and how on earth this amphitheater was arrayed. And so what we did, is we are able to take this photograph and by maneuvering around inside the point cloud, we are able to find that the image was taken from this position right here.
Now what's interesting from that position is that it is perched up over the trail right here. So, here's the trail down below and the camera man was standing up above the trail in this little alcove, and we discovered that that alcove up above the trail is known as the choir loft and the choir loft seems rather dangerous. I can't imagine that the 160-voice choir was up in that spot, but there are four soloists in the creation, and I do wonder, we didn't find documentation, but I do wonder if the four soloists were perched up there. But in any case, we're able to match that photograph from that location, and from that we're then able to determine how the rows were laid out, how this amphitheater was configured. Again, because of the point cloud, we were able to determine that.
One major concern that we had, besides the fact that this took a lot of effort to get up and rolling. One concern was these voids that you see here, the voids that Malcolm talked about, reflections from the stainless steel railing and from water. Those we could live with and from shadows on backsides of formations, those we could live with. The major voids that were more difficult were ones that we didn't send Malcolm to. The original intent of this project was to scan the cave as seen from the visitor, from the trails, the existing trails and historic trails. The problem was he did this work at the very beginning of the project before we knew where all the historic trails were and so in the places where he didn't go, we have voids.
So here for example, the top of Appetite Hill, just before you get to the Lunch Room, we have no points, because in this particular case we knew about it but it was too steep for Malcolm to haul his equipment up there and so I had to just approximate the trail end based off of historic plans, but we have no point data up there because he wasn't able to get up there. In this case we had historic trail alignments that suggested a different configuration than what we have today. Malcolm though stuck to the trail as per our instructions because we didn't know there might be trails over here. Based off the point cloud and the voids that are there, we thought that there still might be, so the only way we could remedy that situation was actually go back out in the field and discover that sure enough, it's too difficult over here and chances are the trail was always in this configuration and these earlier historic plans are simply wrong in that particular area.
Kimball Erdmann, University of Arkansas
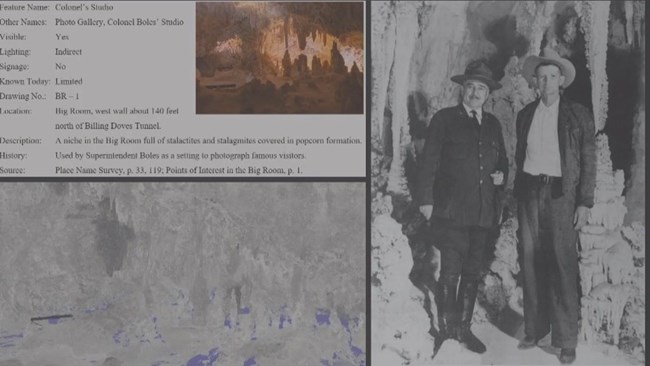
In conclusion, the final point that I want to make is our most frustrating experience, I think, coming out of the use of this particular point cloud and as it applies to cultural landscape inventories, is the realization that so much of the data available in the point cloud was underutilized and lost in the process of simplifying the mapping to conform to existing CLI standards. In other words, we're dumbing down the 3D data to create a 2D product. To create the 2D maps, the entire ceiling of the cave had to be peeled off. We're throwing away half the information right there for these maps and discarded. While the resulting maps and report are detailed and accurate, the actual point cloud is many times more so. When we started manipulating the point cloud, our initial hope was that the information about the cultural features we were putting into the maps and the report could also be incorporated into the point cloud creating a 3D interactive CLI of sorts.
For example, most of the cultural features we gathered information about included, present and past, names appear, current visibility, lighting, signage, location, description, history, sources, current and historical images. All that information could have been tied to the actual point clouds. So that as you go flying through the point cloud, you could come to a formation, to a cultural feature and you would have access to all of this information that's in the CLI. You could have access to it in the point cloud. That's a potential use for this product. What we found though is we couldn't display it in the point cloud in a way that would also be legible in the 2D format. And so in the end, since our product was a CLI, a traditional 2D CLI, we had to focus on that and we weren't able to create this, which could have been more useful to the park, this 3D CLI. But it's something that I would love to see explored further, and I think has a real potential application in the use of point clouds and cultural landscape inventories.
Thank you.

University of Arkansas
Speaker Biography
Kimball Erdman, PLA is an Associate Professor in the Department of Landscape Architecture at the Fay Jones School of Architecture + Design
