Last updated: March 19, 2025
Article
Climate and Water Monitoring at Tonto National Monument: Water Year 2022

NPS
Overview
Together, climate and hydrology shape ecosystems and the services they provide, particularly in arid and semi-arid ecosystems. Understanding changes in climate, groundwater, and surface water is key to assessing the condition of park natural resources—and often, cultural resources.
At Tonto National Monument (Figure 1), Sonoran Desert Network scientists study how ecosystems may be changing by taking measurements of key resources, or “vital signs,” year after year—much as a doctor keeps track of a patient’s vital signs. This long-term ecological monitoring provides early warning of potential problems, allowing managers to mitigate them before they become worse. At Tonto National Monument, we monitor climate and springs among other vital signs.
Surface-water conditions are closely related to climate conditions. Because they are better understood together, we report on climate in conjunction with water resources. Reporting is by water year (WY), which begins in October of the previous calendar year and goes through September of the water year (e.g., WY2022 runs from October 2021 through September 2022).
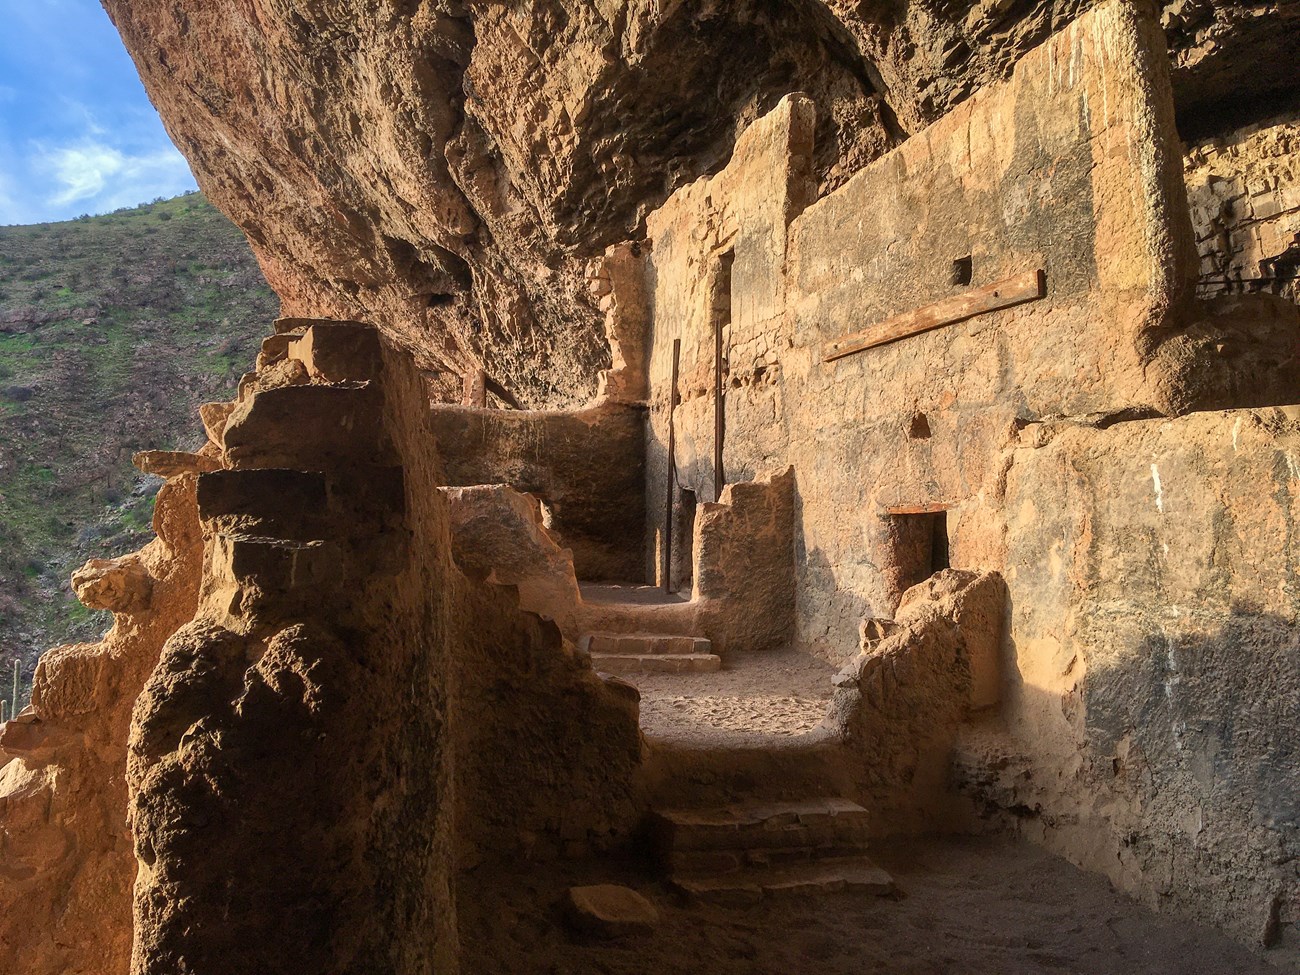
This article reports the results of climate and water monitoring at Tonto National Monument (Figure 1) in WY2022.

NPS
Climate and Weather
There is often confusion over the terms “weather” and “climate.” In short, weather describes instantaneous meteorological conditions (e.g., it’s currently raining or snowing, it’s a hot or frigid day). Climate reflects patterns of weather at a given place over longer periods of time (seasons to years). Climate is the primary driver of ecological processes on earth. Climate and weather information provide context for understanding the status or condition of other park resources.
A National Oceanic and Atmospheric Administration (NOAA) Cooperative Observer Program (COOP) weather station, “Roosevelt 1 S” (ID# 027281), had been operational three miles (4.8 km) from Tonto National Monument since 1905. In 2019, this station was relocated to Tonto National Monument (Figure 1). Due to this geographical move, current weather data from this station is no longer directly comparable to the long-term climate dataset. As a substitute, climate analyses in this year’s report use 30-year averages (1991–2020) and gridded surface meteorological (GRIDMET) data from the location of the station.
GRIDMET is a spatial climate dataset at a 4-kilometer resolution that is interpolated using weather station data, topography, and other observational and modeled land-surface data. Temperature and precipitation estimated from GRIDMET may vary from actual weather at a particular location, depending on the availability of weather station data and the difference in elevation between the location and that assigned to a grid cell. Data from both weather station and GRIDMET are accessible through Climate Analyzer.
Results for Water Year 2022
Precipitation
Annual precipitation at Tonto National Monument in WY2022 was 10.59″ (26.9 cm; Figure 2), which was 2.90″ (7.4 cm) less than the 1991–2020 annual average. The deficit primarily occurred October–May, when monthly totals were all less than the 1991–2020 monthly averages—except in December, which received nearly twice the average rainfall. Overall monsoonal rains (June–September) were slightly above the 1991–2020 average, with June receiving over three times the monthly average.
Air Temperature
The mean annual maximum temperature at Tonto National Monument in WY2022 was 82.8°F (28.2°C), 0.2°F (0.1°C) above the 1991–2020 average. The mean annual minimum temperature in WY2022 was 56.1°F (13.4°C), 0.3°F (0.2°C) above the 1991–2020 average. Mean monthly maximum and minimum temperatures in WY2022 were variable relative to average. While temperatures were frequently near average, deviations from 1991–2020 monthly averages of up to 7.0°F (3.9°C) occurred (Figure 2).

NPS
Drought
Reconnaissance drought index (Tsakiris and Vangelis 2005) provides a measure of drought severity and extent relative to the long-term climate. It is based on the ratio of average precipitation to average potential evapotranspiration (the amount of water loss that would occur from evaporation and plant transpiration if the water supply was unlimited) over short periods of time (seasons to years). The reconnaissance drought index for Tonto National Monument indicates that WY2022 was drier than the 1991–2022 annual average for the third consecutive year from the perspective of both precipitation and potential evapotranspiration (Figure 3).
Reference: Tsakiris G., and H. Vangelis. 2005. Establishing a drought index incorporating evapotranspiration. European Water 9: 3–11.

NPS
Springs
Background
Springs, seeps, and tinajas (small pools in a rock basin or impoundments in bedrock) are small, relatively rare biodiversity hotspots in arid lands. They are the primary connection between groundwater and surface water and are important water sources for plants and animals. For springs, the most important questions we ask are about persistence (How long was there water in the spring?) and water quantity (How much water was in the spring?).
Methods
Sonoran Desert Network springs monitoring is organized into four modules described below.
Site Characterization
This module, which includes recording GPS locations and drawing a site diagram, provides context for interpreting change in the other modules. We also describe the spring type (e.g., helocrene, limnocrene, rheocrene, or tinaja) and its associated vegetation. Helocrene springs emerge as low-gradient wetlands, limnocrene springs emerge as pools, and rheocrene springs emerge as flowing streams. This module is completed once every five years or after significant events.
Site Condition
We estimate natural and anthropogenic disturbances and the level of stress on vegetation and soils on a scale of 1–4, where 1 = undisturbed, 2 = slightly disturbed, 3 = moderately disturbed, and 4 = highly disturbed. Types of natural disturbances can include flooding, drying, fire, wildlife impacts, windthrow of trees and shrubs, beaver activity, and insect infestations. Anthropogenic disturbances can include roads, off-highway vehicle trails, hiking trails, livestock and feral-animal impacts, removal of invasive non-native plants, flow modification, and evidence of human use of the spring. We take repeat photographs showing the spring and its landscape context. We note the presence of certain obligate wetland plants (plants that almost always occur only in wetlands), facultative wetland plants (plants that usually occur in wetlands, but also occur in other habitats), and non-native bullfrogs and crayfish, and we record the density of invasive, non-native plants.
Water Quantity
We measure the persistence of surface water, amount of spring discharge, and wetted extent (area that contained water). To estimate persistence, we analyze the variance of temperature measurements taken by logging thermometers placed at or near the orifice (spring opening). Because water mediates variation in diurnal temperatures, data from a submerged sensor will show less daily variation than data from an exposed open-air sensor; this tells us when the spring was wet or dry. Surface discharge is measured with a timed sample of water volume. Wetted extent is a systematic measurement of the physical length (up to 100 m), width, and depth of surface water. It is assessed using a technique for either standing water (e.g., limnocrene and helocrene springs) or flowing water (e.g., rheocrene springs).
Water Quality
We measure core water quality parameters and water chemistry. Core parameters include water temperature, pH, specific conductivity (a measure of dissolved compounds and contaminants), dissolved oxygen (how much oxygen is present in the water), and total dissolved solids (an indicator of potentially undesirable compounds). Discrete samples of these parameters are collected with a multiparameter meter. If the meter fails calibration check(s), we indicate that condition when presenting data. Water chemistry is assessed by collecting surface water sample(s) and estimating the concentration of major ions with a photometer in the field. These parameters are collected at one or more sampling locations within a spring. Data are presented only for the primary sampling location. Each perennial spring is somewhat unique, and there are not water quality standards specific to most perennial springs in Arizona. Where conditions exceed water quality standards for other surface waters (rivers, streams, lakes, and reservoirs) we note it, but the reader is advised that these standards were not developed for perennial springs. Our ongoing data collection at each spring will improve our understanding of the natural range in water quality and water chemistry parameters for a given site.
Inventory of Rare and Invasive Species and Pathogens
An inventory of rare and invasive species and pathogens in perennial springs was implemented in WY2022 using environmental DNA (eDNA) techniques. Four samples were collected and filtered (0.45 µm mesh) from Cave Canyon Spring and then preserved in ethanol prior to DNA extraction and analysis by the Goldberg Lab at Washington State University This inventory effort is ongoing at the time of writing. When completed, a detailed report of all inventory findings will be presented.
Target Organisms for eDNA Project:
-
The native amphibian lowland leopard frog (Rana yavapaiensis), a species of conservation concern that had not been confirmed previously within Tonto National Monument (Albrecht et al. 2007).
-
The pathogen chytrid fungus (Batrachochytrium dendrobatidis), a major threat to amphibians globally that is currently expanding in the American Southwest. American bullfrog is an important vector of chytrid fungus and ranaviruses.
-
The non-native invasive American bullfrog (Rana catesbeiana), which had not been confirmed previously within the park (Albrecht et al. 2007).
-
Ranaviruses that can infect amphibians and produce 90–100% mortality in tadpoles and adults and can persist in affected wetlands. Ranaviruses have not been previously detected at the park.
-
The native amphibian Chiricahua leopard frog (Rana chiricahuensis), a federally designated threatened species that has not been previously documented at the park (Albrecht et al. 2007). Designated critical habitat is located in nearby Tonto Creek and the Mogollon Rim.
-
The native aquatic snake northern Mexican garter snake (Thamnophis eques megalops), a federally designated threatened species that has not been previously been observed within the park (Albrecht et al. 2007). Designated critical habitat is found in nearby Tonto Creek.
-
The native mammal jaguar (Panthera onca), a federally designated endangered species whose historic range included the Tonto Basin. Designated critical habitat for jaguar recovery is located in southern Arizona adjacent to Tucson.
Reference: Albrecht, E.W. and Others. 2007. Vascular Plant and Vertebrate Inventory of Tonto National Monument. U.S. Geological Survey (USGS) Open-File Report. 2007-1295. USGS Southwest Biological Science Center, Sonoran Desert Research Station, University of Arizona. Tucson, Arizona.

NPS
Recent Findings at Cave Canyon Spring
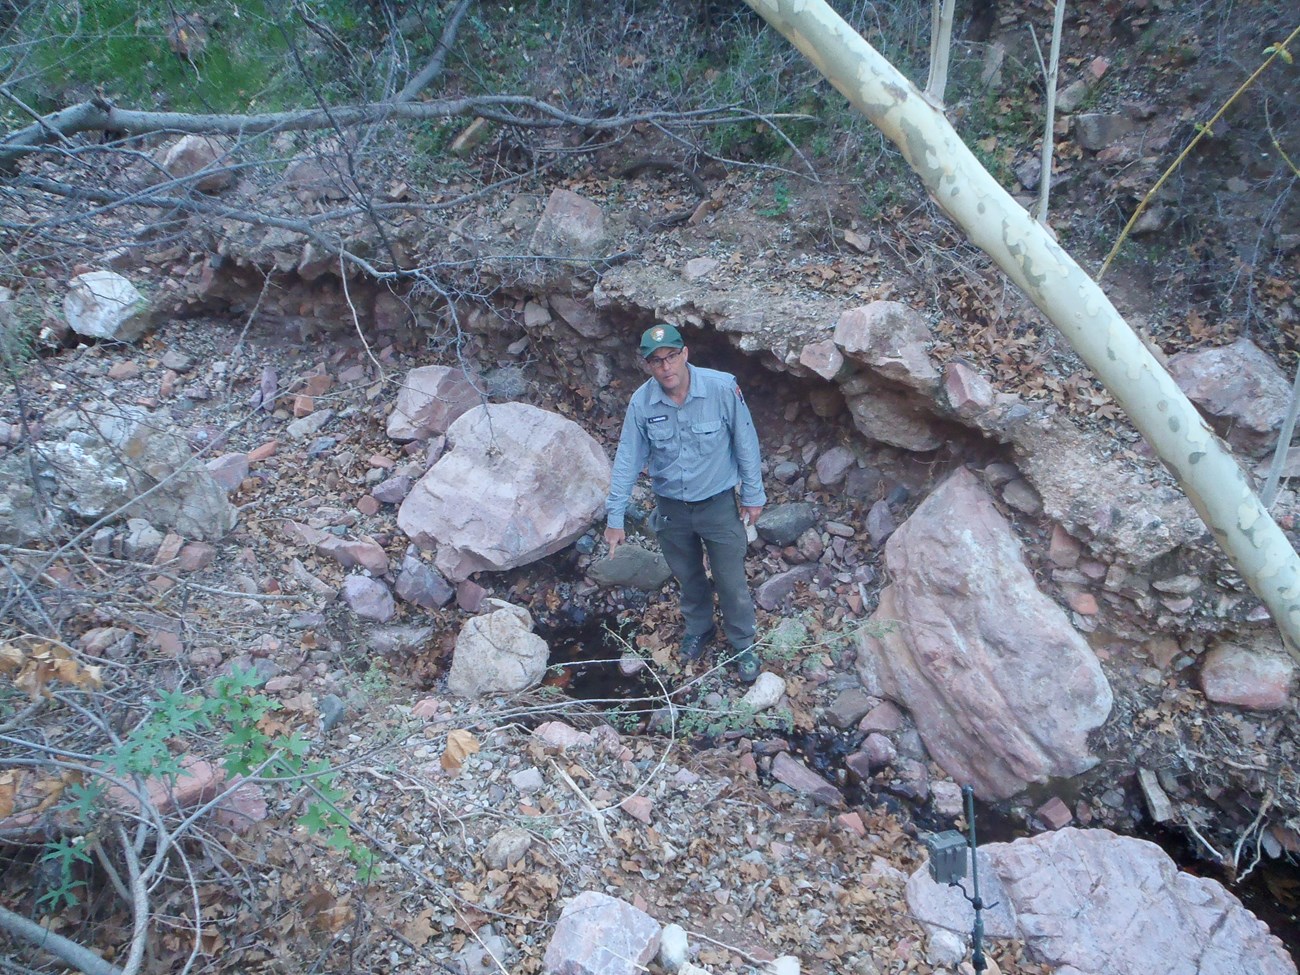
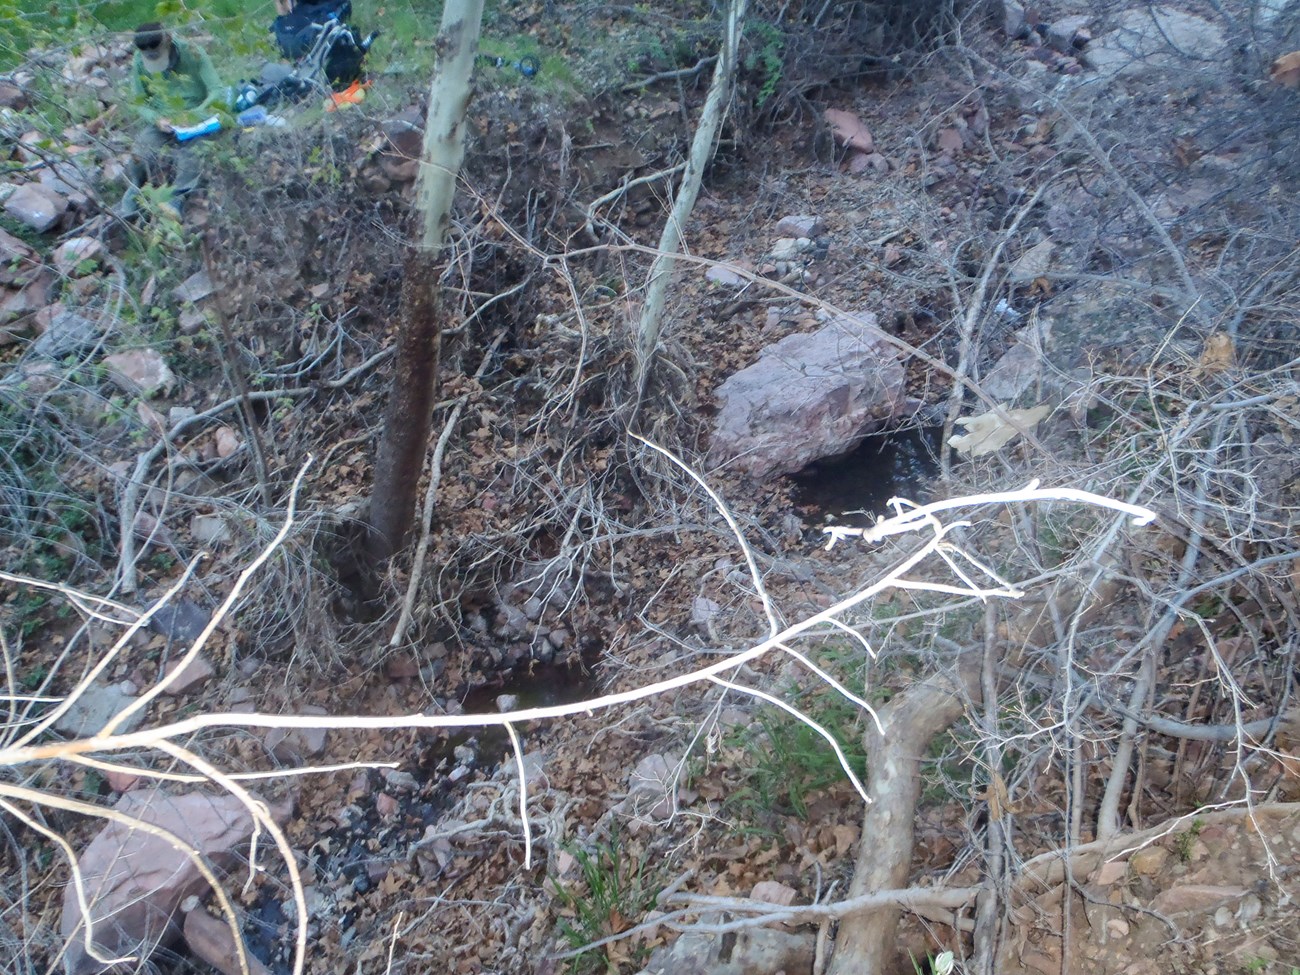
Cave Canyon Spring is a rheochrene spring (emerges as a flowing stream) located within the main drainage of Cave Canyon between the Upper and Lower Cliff Dwellings. When visited and last characterized on 23 March 2022, Cave Canyon Spring emerged as a series of small, shallow pools (Figure 4) linked by a shallow springbrook within the active channel (Figure 5). Cave Canyon Spring is one of the most dynamic perennial springs in the Sonoran Desert parks, with highly variable springflow and wetted extent, likely due to the influence of periodic scour/sedimentation events in the Cave Canyon drainage (Albrecht et al. 2005). Descriptions and other characteristics of springs are updated every five years.
Reference: Albrecht, E.W. and Others. 2005. A Biological Inventory and Hydrological Assessment of the Cave Springs Riparian Area, Tonto National Monument, Arizona. USGS Southwest Biological Science Center, Sonoran Desert Research Station, University of Arizona. Tucson, Arizona

NPS
Site Condition
Consistent with past years, we rated Cave Canyon Spring as “moderately disturbed” because of the presence of the Upper Cliff Dwelling Trail, which lies within a few meters of the spring. For the first time in WY2022, Cave Canyon Spring was “highly disturbed” from recent flooding, as shown by substantial shifts in channel morphology since our visit in WY2021 and heavy accumulations of sediment and woody debris in and around the site. We did not note any other natural or human-caused disturbances at Cave Canyon Spring in WY2022.
As in previous years, we did not observe crayfish or bullfrogs (invasive aquatic animals) in WY2022. However, scattered patches of the non-native grasses ripgut (Bromus diandrus) and red brome (B. rubens) were detected around Cave Canyon Spring in WY2022, similar to most previous visits.
The obligate wetland tree Arizona sycamore (Platanus wrightii) was also observed at Cave Canyon Spring in WY2022, as it has been in previous years.
Inventory of Rare and Invasive Species and Pathogens
Four water samples were collected from Cave Canyon Spring on 23 March 2022. None of our target organisms were detected.
Water Quantity
The WY2022 visit occurred on 23 March 2022, and the spring contained water. The water temperature sensor and housing were not relocated during the March 2022 visit, and recent scour and sedimentation evidence in the channel suggested that flooding may have swept the sensors away or buried them, as appeared to have occurred in WY2019 and WY2020 (Figure 3). In prior water years, when the temperature sensor and housing were relocated, the spring was wetted 100% of the days measured.

NPS
Unlike in previous years, discharge could not be measured at Cave Canyon Spring in WY2022 due to negligible surface flow.
Wetted extent was evaluated using a method for flowing water. The total brook length was 10 m (33 ft)—much shorter than previous measurements (Table 1). However, Albrecht et al. (2005) refer to periods in the past during which Cave Canyon Spring was “buried” by sedimentation events (resulting in no surface water), only to be uncovered and surface flow restored by subsequent scour events.
Width and depth averaged 94.7 cm (37.3 in) and 6.7 cm (2.6 in), respectively—generally wider and deeper than previous measurements (Table 1). When considered with the observed flooding evidence from WY2021 and WY2022, these dramatic shifts in wetted extent parameters at Cave Canyon Spring suggest a return to the dynamic geohydrology conditions following channel erosion/deposition events in the early 2000s as documented by Albrecht et al. (2005).
Water Quality
Core water quality (Table 2) and water chemistry (Table 3) data were collected at the primary sampling location of Cave Canyon Spring, the largest pool within the spring complex. This location was re-established in WY2022 because the original location was buried in sediment. Specific conductance, total dissolved solids, and alkalinity were on the high end of the range observed in other perennial springs we monitor in the Sonoran Desert parks.
Cave Canyon Spring Data Tables
| Measurement | WY2022 Value (range of prior values) |
Prior Years Measured (# of measurements) |
|---|---|---|
| Width (cm) | 94.7 ± 87.7 (42.9–71.0) | 2017–2021 (4) |
| Depth (cm) | 6.7 ± 8.3 (1.5–2.7) | 2017–2021 (4) |
| Length (m) | 10.3 (52.7–95.0) | 2017–2021 (4) |
| Sampling Location | Measurement Location (width, depth) |
Parameter | WY2022 Value (range of prior values) |
Prior Years Measured (# of measurements) |
|---|---|---|---|---|
| 004 | Center | Dissolved oxygen (mg/L) | 5.26 (n/a) |
n/a |
| 004 | Center | pH | 6.98 (n/a) |
n/a |
| 004 | Center | Specific conductivity (µS/cm) | 538 (n/a) |
n/a |
| 004 | Center | Temperature (°C) | 18.6 (n/a) |
n/a |
| 004 | Center | Total dissolved solids (mg/L) | 349 (n/a) |
n/a |
| Sampling Location | Measurement Location (width, depth) |
Parameter | WY2022 Value (range of prior values) |
Prior Years Measured (# of measurements) |
|---|---|---|---|---|
| 004 | Center | Alkalinity (CaCO3) |
255 (n/a) |
n/a |
| 004 | Center | Calcium (Ca) |
44 (n/a) |
n/a |
| 004 | Center | Chloride (Cl) |
42 (n/a) |
n/a |
| 004 | Center | Magnesium (Mg) |
29 (n/a) |
n/a |
| 004 | Center | Potassium (K) |
3.1 (n/a) |
n/a |
| 004 | Center | Sulphate (SO4) |
6 (n/a) |
n/a |
Report Citation
Authors: Kara Raymond, Andy Hubbard, Cheryl McIntyre
Raymond, K., A. Hubbard, and C. McIntyre. 2024. Climate and Water Monitoring at Tonto National Monument: Water Year 2022. Sonoran Desert Network, National Park Service, Tucson, Arizona.
Past Findings
Water Year 2018 Full Report • Water Year 2018 Web Summary Report


