Last updated: February 24, 2022
Article
Terrestrial Landscape Dynamics Resource Brief for the Arctic Network


Status and trends of terrestrial landscape dynamics in the Arctic Network
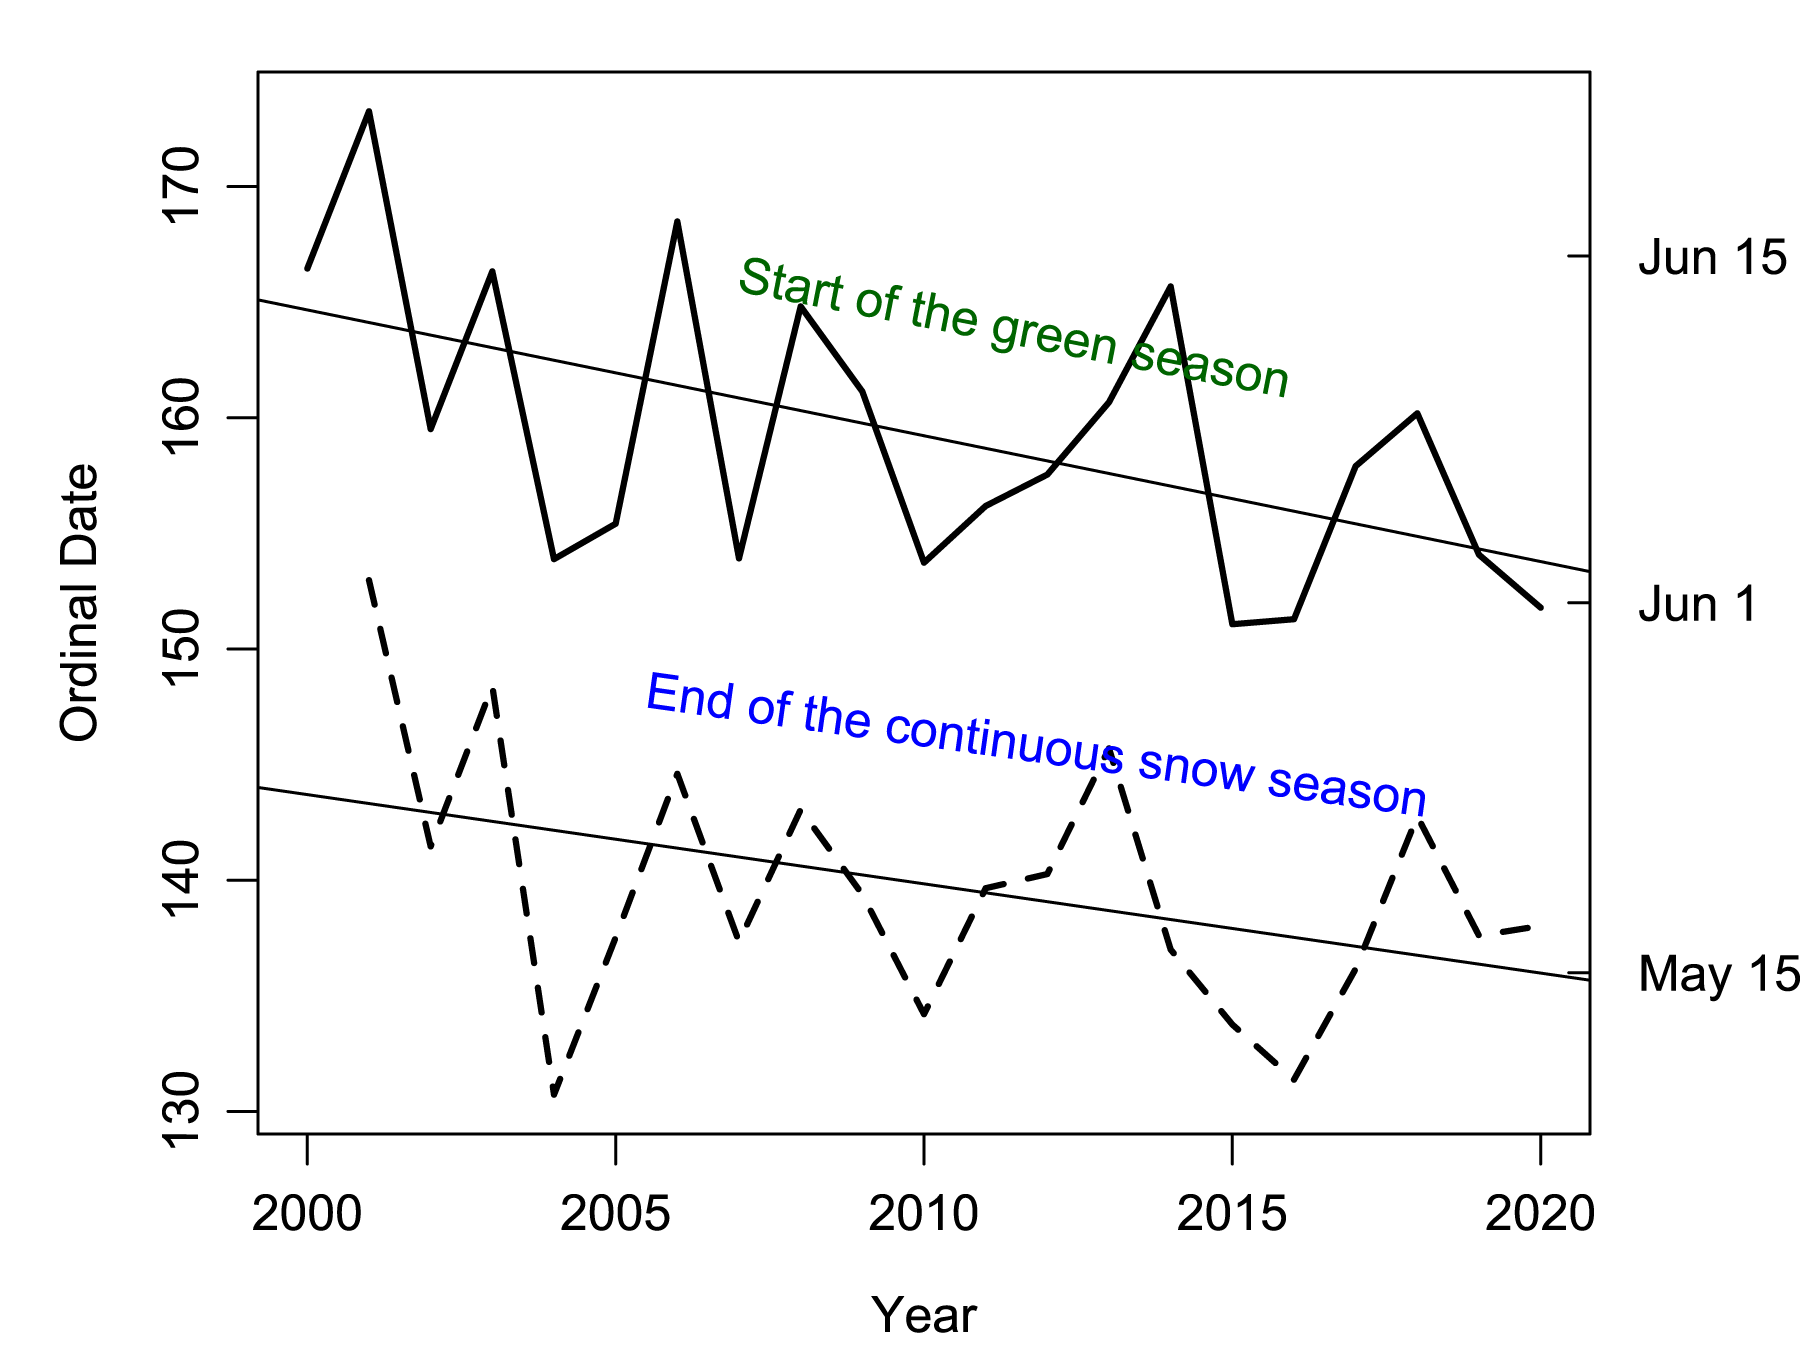
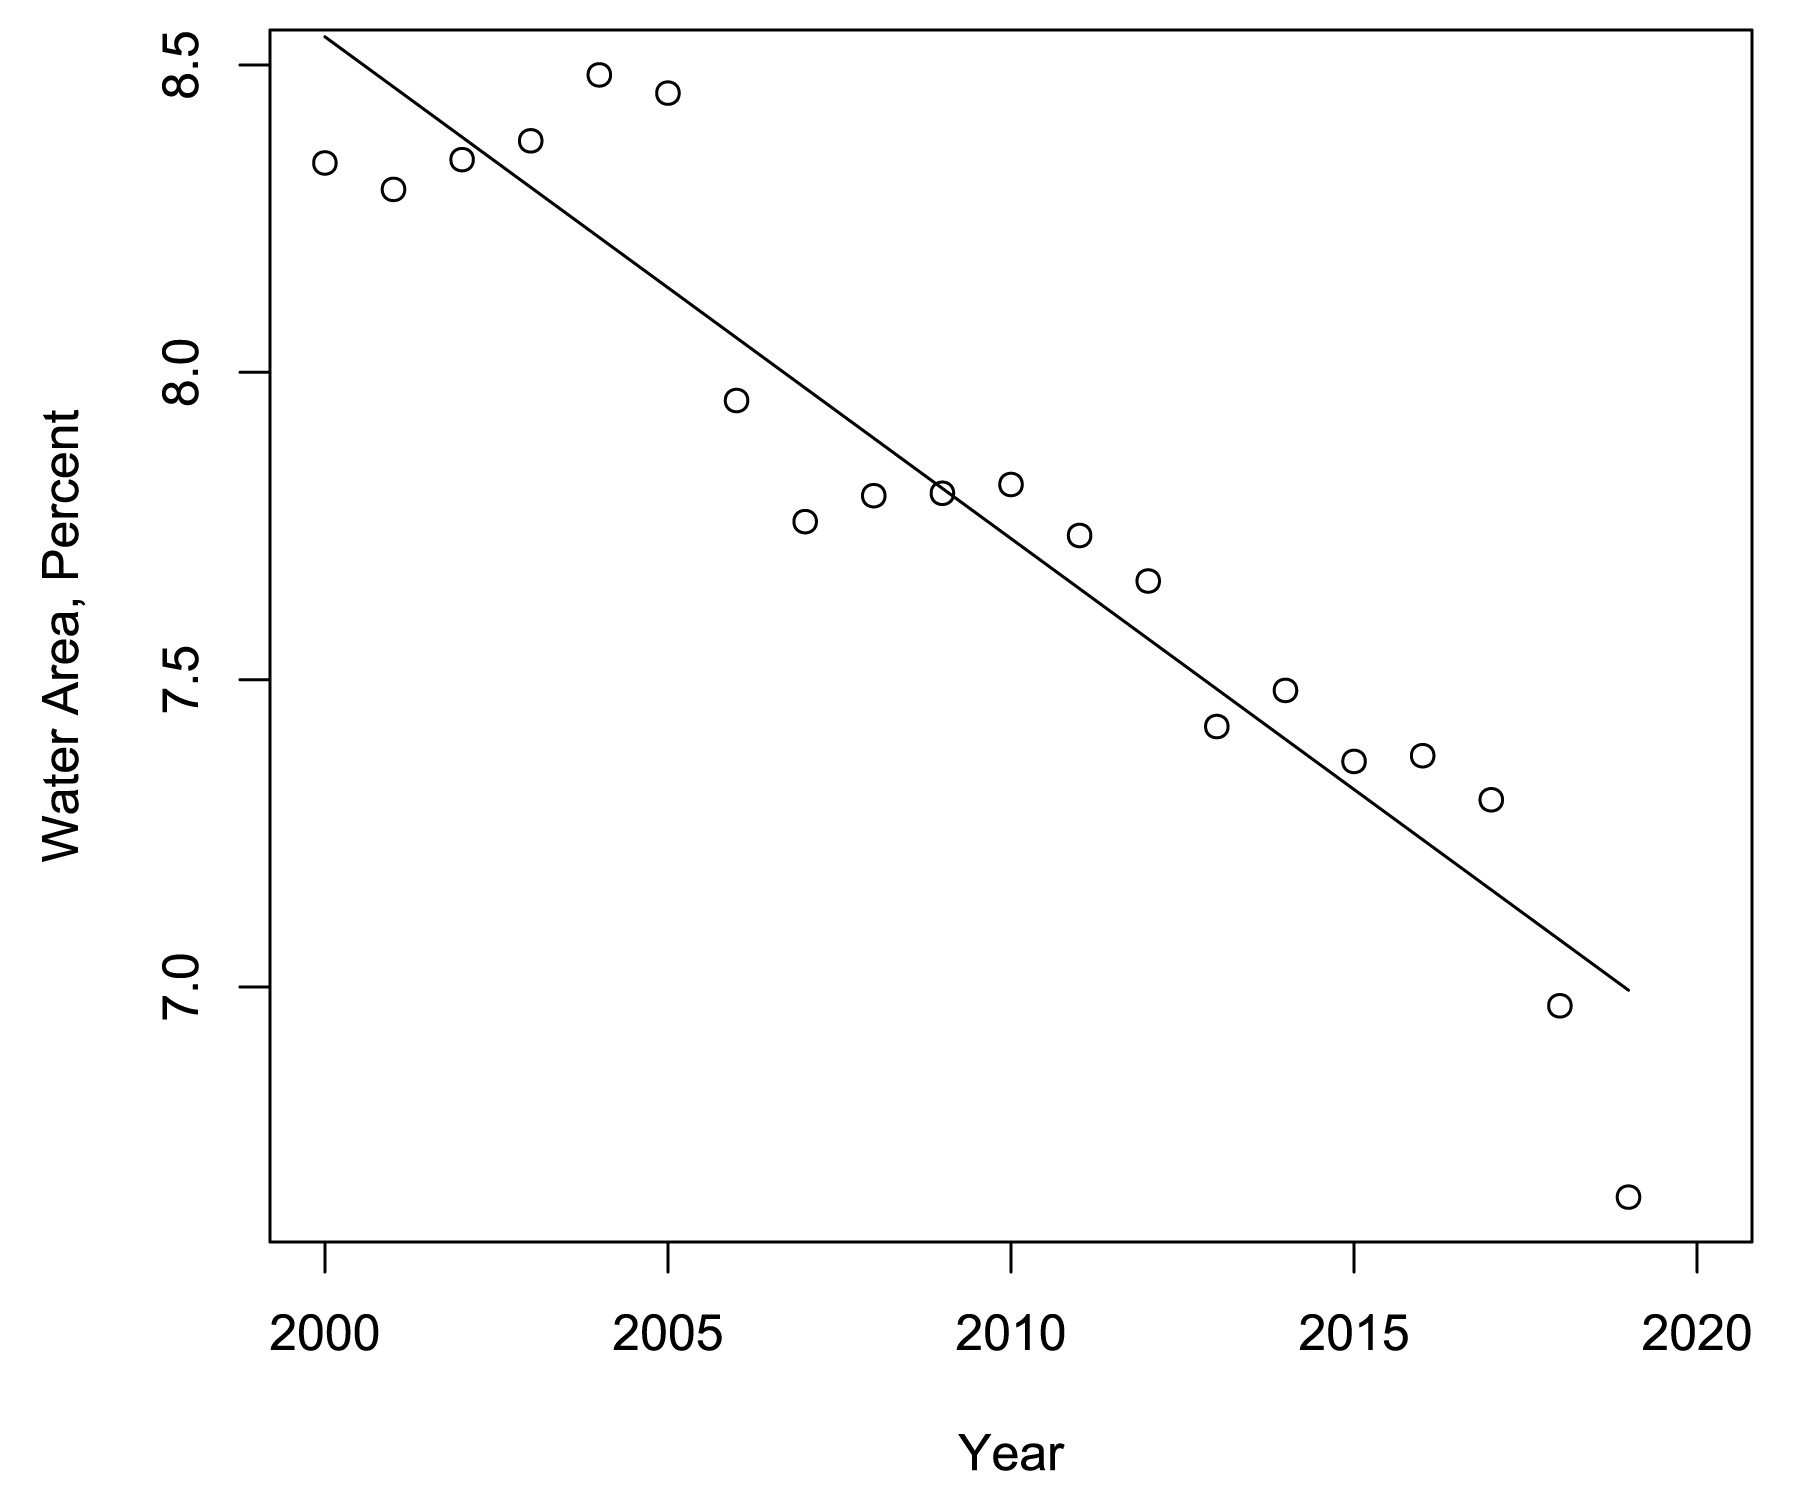
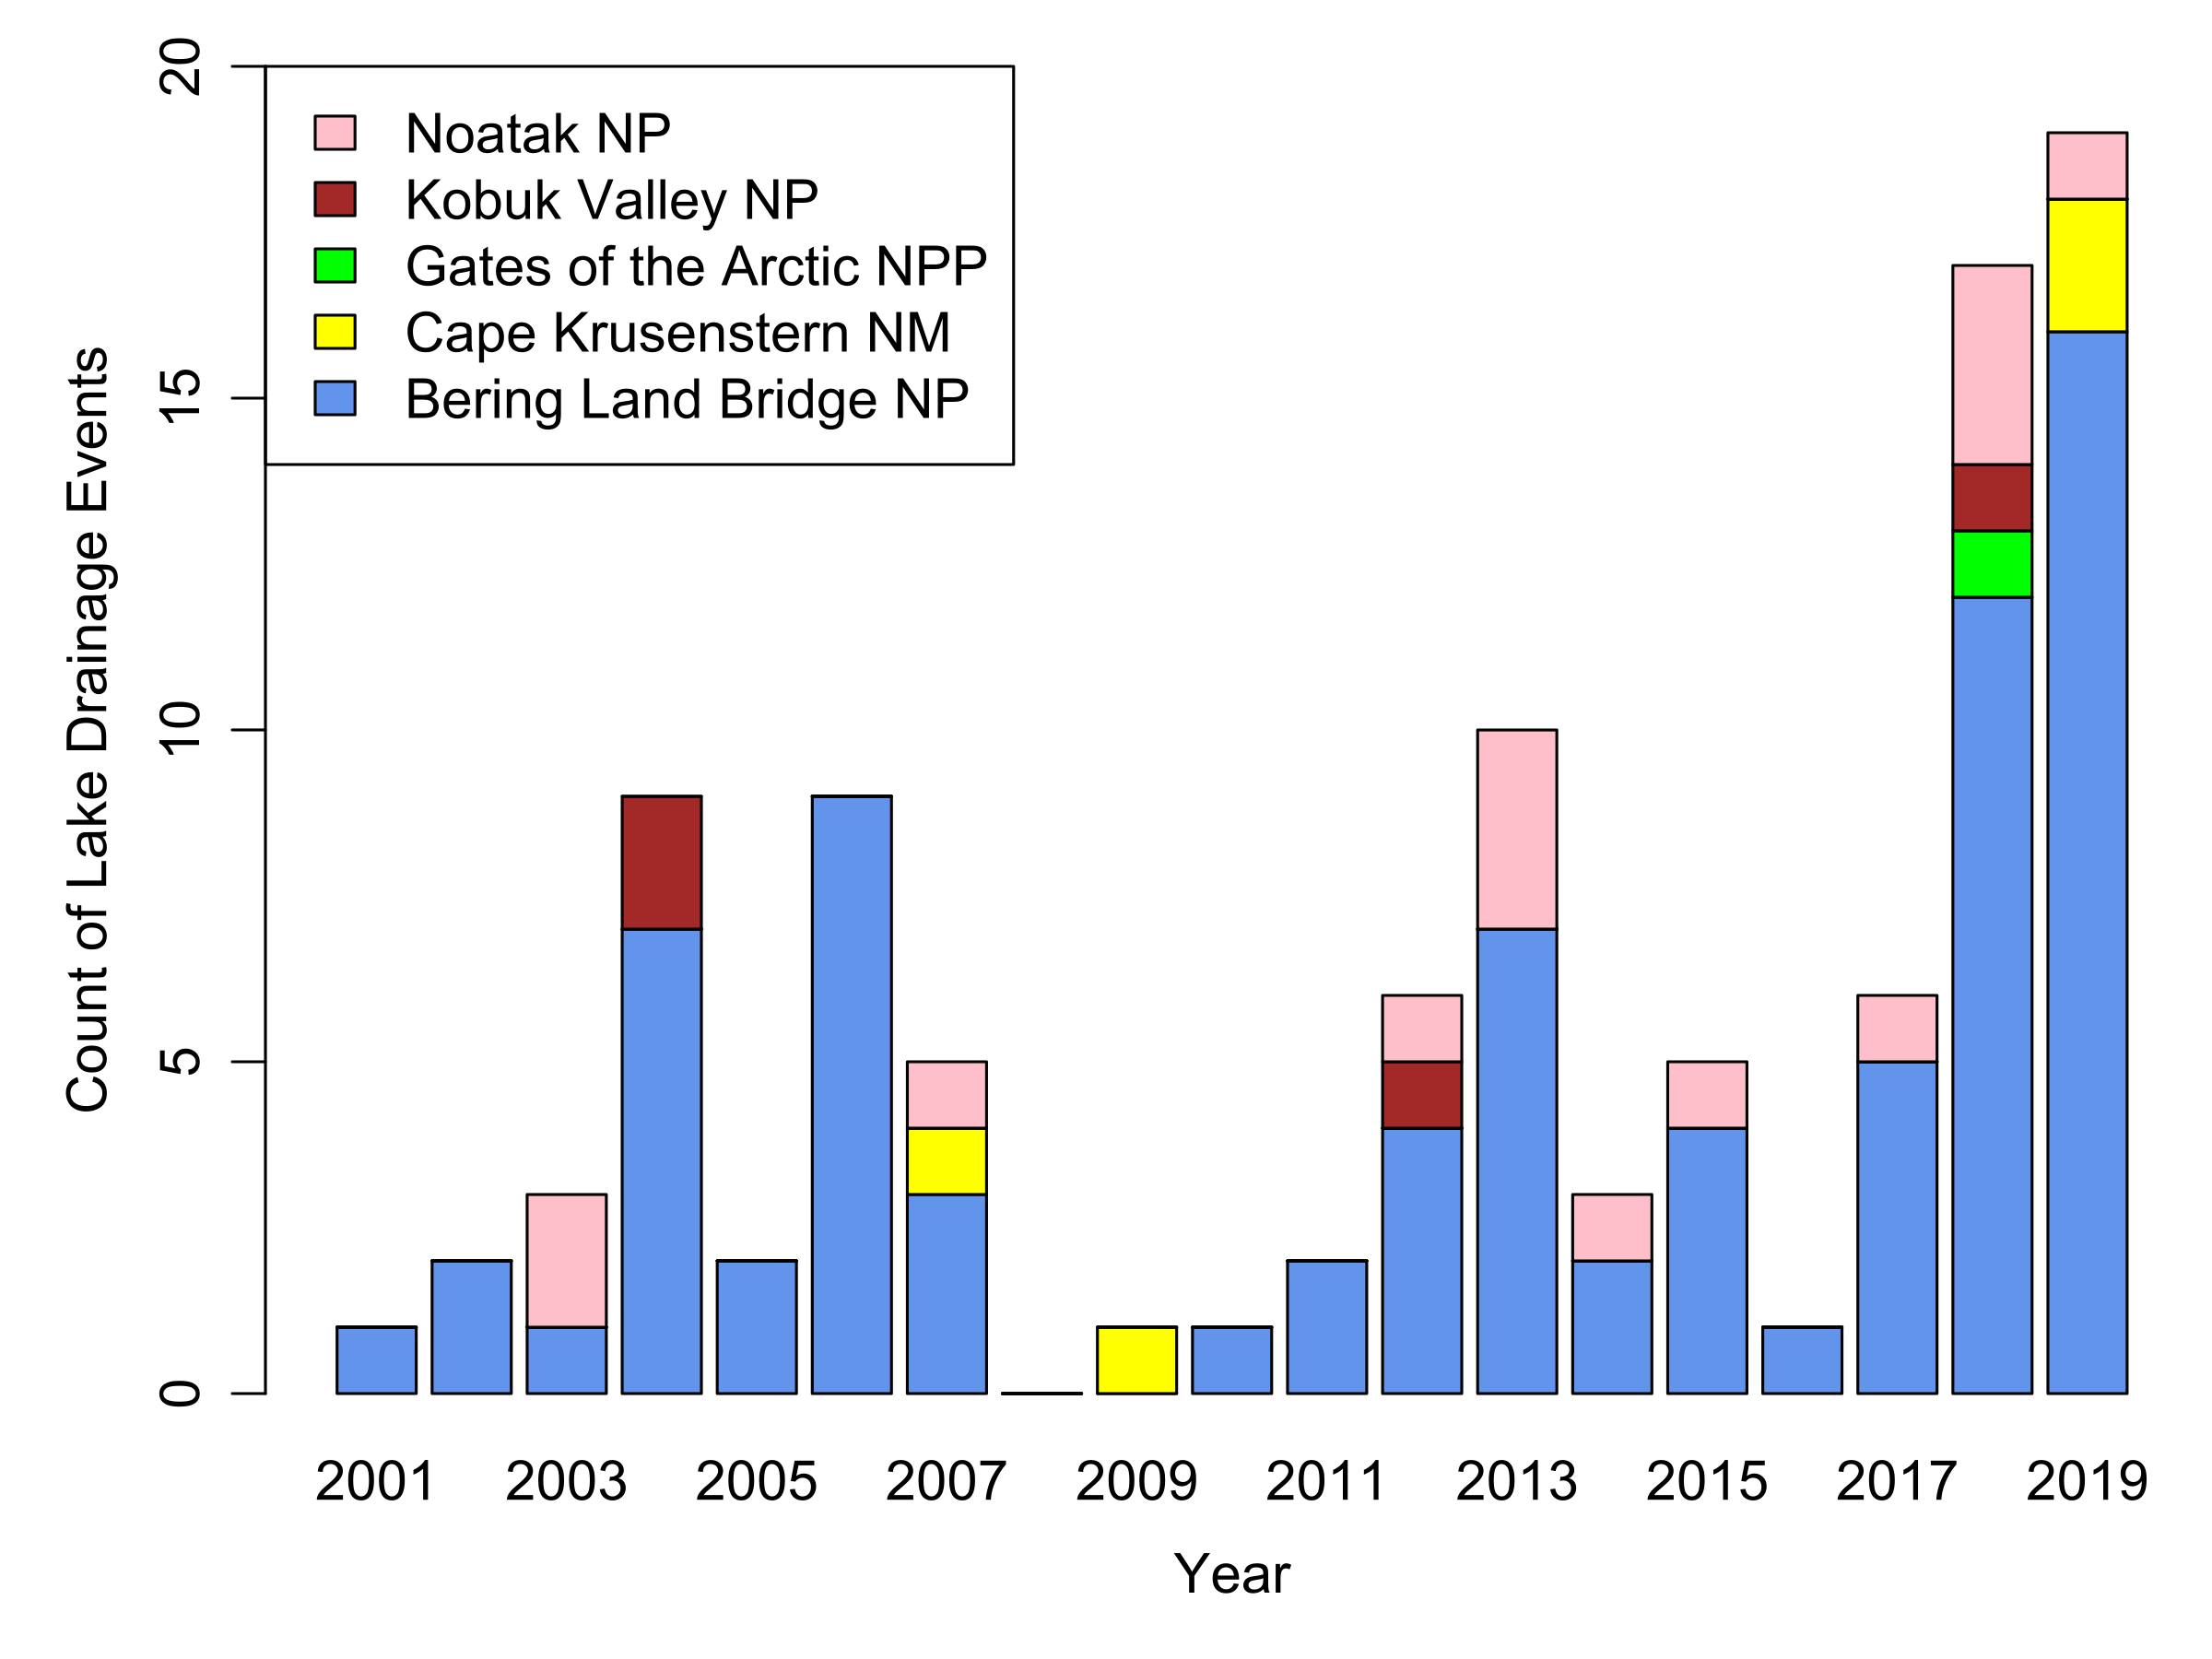
The timing of the start and end of the growing season and snow-free season vary by about a month from year-to-year. The overall trend over the past 20 years has been toward longer summers. On average, summers in the year 2020 started about 11 days earlier than in the year 2000. The area of lakes and ponds fluctuated without any major gains or losses in recent decades over much of ARCN, but portions of Bering Land Bridge National Preserve and Kobuk Valley National Park lost a significant amount of surface water. Losses were concentrated in areas with ice-rich permafrost, where lakes drained suddenly by a breach in the bank. The vegetation has been stable over most of our area in recent decades, but tall shrubs are expanding their range and getting denser in some areas. Shrub increase is concentrated in tundra areas with the warmest summers.


NPS/Dave Swanson
Why terrestrial landscape dynamics are important
Landscape dynamics are the “big picture” of changes in the growing season, vegetation, and surface water.The length and warmth of the growing season control the amount of plant matter, which is the energy supply for all other biological processes and crucial for wildlife. Major changes in vegetation are likely to benefit some species and harm others. Formation and drainage of ponds and lakes, which are important habitat for many species, are natural processes that may be accelerated by climate change.

NPS/Matt Nolan
What we want to know about landscape dynamics
- Long-term trends in the timing and length of the growing season and the snow-free period.
- Long-term trends in land cover types such as shrubs, trees, bare ground, including both the overall area of the different types and spatial patterns such as where shrub are increasing or tree-line is advancing.
- Long-term trends in the area covered by lakes and ponds.

How we monitor terrestrial landscape dynamics
- Analyze trends in snow cover and vegetation greenness measured by satellites. For over 20 years, satellites have measured the amount of sunlight reflected from the earth in different wavelengths (colors). We compute an index of the earth’s greenness from these measurements and determine the length of the growing season and its peak greenness. We also determine when the snow cover arrives and disappears each year.
- Analyze trends in snow and growing seasons using remote automated cameras at weather stations. Remote cameras at five of the NPS climate monitoring stations capture daily photographs of the same scene throughout the year. From these photographs we can observe changes in the length of the snow-free season, and the flowering and leaf-out of plants. We relate these changes to weather measurements. The photos also provide a valuable on-the-ground check of satellite measurements.
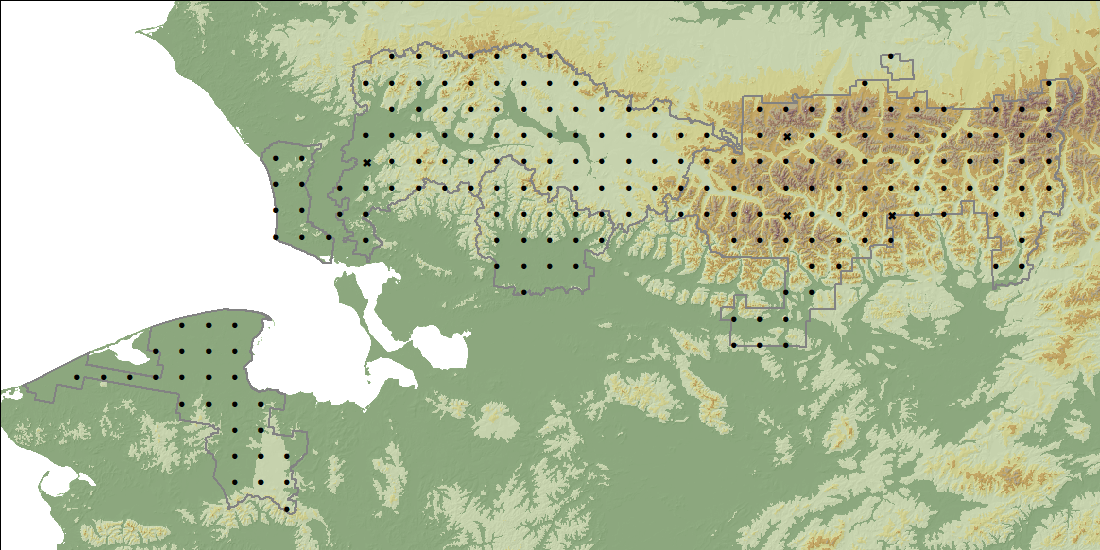
- Analyze changes in vegetation and other land surface features visible on high resolution satellite images and aerial photographs. Using detailed aerial photographs taken on a 20-km grid across the Arctic Network, we measure landscape characteristics such as shrub cover, tree cover, and area of small ponds caused by thawing permafrost. We plan to repeat these photographs every 10 years and compare the dates to get a network-wide view of changes over time.
- Analyze the change in area of lakes and ponds using satellite images. Satellites images dating back to 2000 are suitable for mapping the extent of lakes and ponds. We use these maps of surface water to track changes in the total area of lakes and ponds, and to locate lakes and ponds that have drained or dried up.

How monitoring landscape dynamics can help park managers protect parks in the Arctic Network
Landscape changes affect most other natural resources and could influence decisions about wildlife, fire, cultural resource, and visitor management. Our interpretive products will educate visitors and others about the effects of environmental change on arctic ecosystems.
For more information, contact:
Dave Swanson907-455-0665
David_K_Swanson@nps.gov
