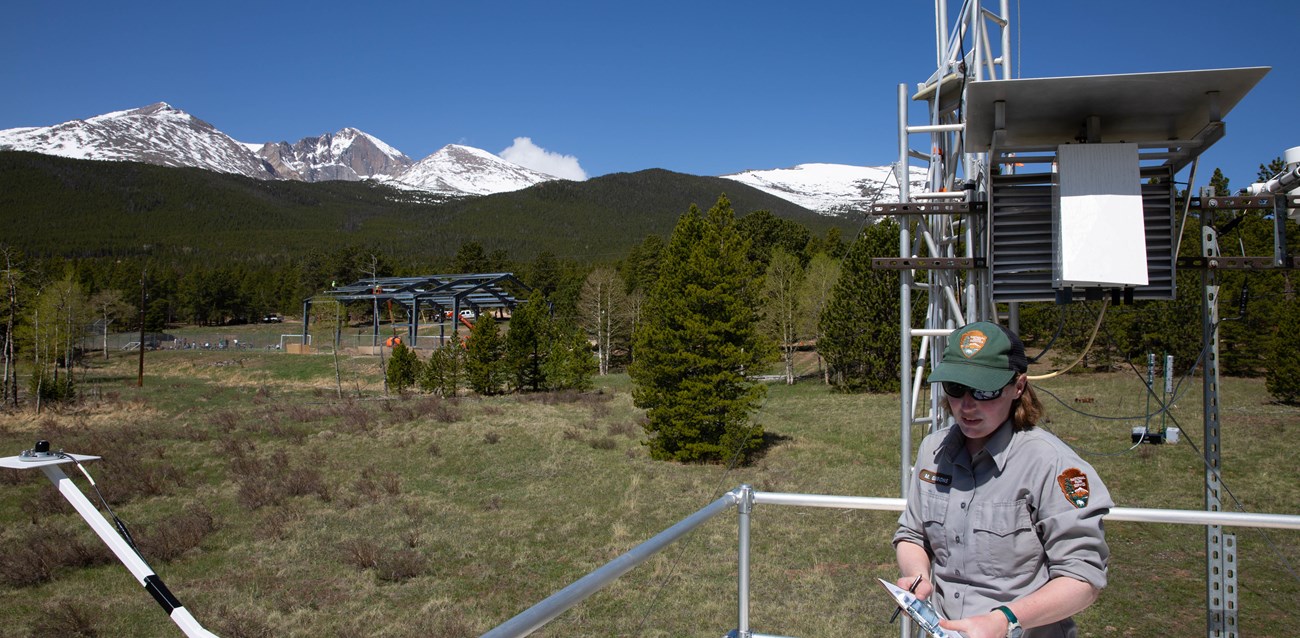
Photo courtesy of Mackenzie Reed/NPS Nitrogen and sulfur air pollution is transported through the atmosphere in gaseous and particulate forms. When these compounds are deposited without precipitation (rain or snow) it is called dry deposition. Too much nitrogen or sulfur deposition can have harmful effects on park ecosystems. We monitor nitrogen and sulfur dry deposition compounds in park ecosystems by measuring gaseous ammonia (NH3), nitric acid (HNO3), as well as particulate ammonium (NH4+), nitrate (NO3-), and sulfate (SO42-). These air concentrations are then combined with meteorological data and leaf area index to estimate dry deposition. Measurements of sulfur dioxide (SO2) were made since the early 2000s but were discontinued in 2023. SO2 concentrations are now being estimated by models. Who is monitoring and where?NPS staff and partners participate in national networks such as the Clean Air Status and Trends Network (CASTNET) and the National Atmospheric Deposition Program (NADP) Ammonia Monitoring Network (AMoN) that collect dry deposition data in 95 sites across the U.S. These networks measure the concentrations of nitrogen and sulfur pollutants in the air and then other factors, such as meteorology and leaf area index, are used along with this data to model dry deposition. Take a look at the Nitrogen & Sulfur tab as well as the Ammonia tab on the NPS Air Quality Monitoring map to see where these sites are located.
What Equipment do we use and how does it work?Dry Deposition Monitoring
Visit our keyboard shortcuts docs for details
An air quality scientist describes the process of collecting data involving the dry deposition of nitrogen and sulfur. Video courtesy of Mackenzie Reed/NPS Pollutant concentrations are measured by pulling air through a filter pack located in a shelter at the top of a tall tipping tower. Air is pumped in through the open face of the filter pack and through a stack of filters inside that each collect different pollutants. The filter pack, shown below, consists of three different filters:
Visit our keyboard shortcuts docs for details
A CASTNET filter pack captures nitrogen and sulfur pollutants. Video courtesy of Mackenzie Reed/NPS How often do we measure?Dry deposition particles and gases are collected continuously, and filter packs are changed at weekly intervals. Once a week, the monitoring site operator tips the tower down, collects the filter pack, and replaces it with a clean one. The used filter pack is then sealed and sent to the analytical chemistry laboratory along with filter pack identification information and a data sheet recording the amount of air that was drawn through the used filter. At the laboratory, the filters are removed and analyzed. The total mass of pollutants on the filters is divided by the amount of air that the pump pulled through the filter pack to get the concentration of each pollutant. Measured concentrations from the filters are reported as kg ha-1. Ammonia monitoring
Visit our keyboard shortcuts docs for details
An air quality scientist describes how we monitor the dry deposition of ammonia. Video courtesy of Mackenzie Reed/NPS Ammonia monitoring uses a different sampler. The ammonia monitoring equipment is also located on a tower is but usually lower to the ground than the CASTNET filter packs. Inside the shelter, a Radiello® passive sampler continuously traps ammonia from the surrounding air. This passive sampler does not require electricity to pump air through the filter pack, instead it uses a concentration gradient to move air through the sampler (shown above). The naturally higher concentration of pollutants on the outside of the sampler drives the passive diffusion of ammonia through the outer porous surface towards the lower concentration on the inside. The inner cartridge is coated with phosphoric acid that ammonia molecules stick (adsorb) to. How often do we measure?Ammonia gas is collected continuously, and passive samplers are changed every two weeks. The used sampler is packaged and sent to the NADP Central Analytical Laboratory in Wisconsin. At the laboratory, the central cartridge is removed and processed using a technique that removes the ammonia molecules with water so that ammonia concentration can be precisely measured. How are the data used?Dry deposition data are useful for:
Explore park-specific dry deposition information on the Nitrogen and/or Sulfur Composition portion of the NPS Air Quality Conditions & Trends website. Additional data summaries and deposition maps for general dry deposition monitoring are available through the CASTNET program. For ammonia monitoring, data summaries are available through the AMoN network. |
Last updated: August 7, 2025
