WebcamWebcam
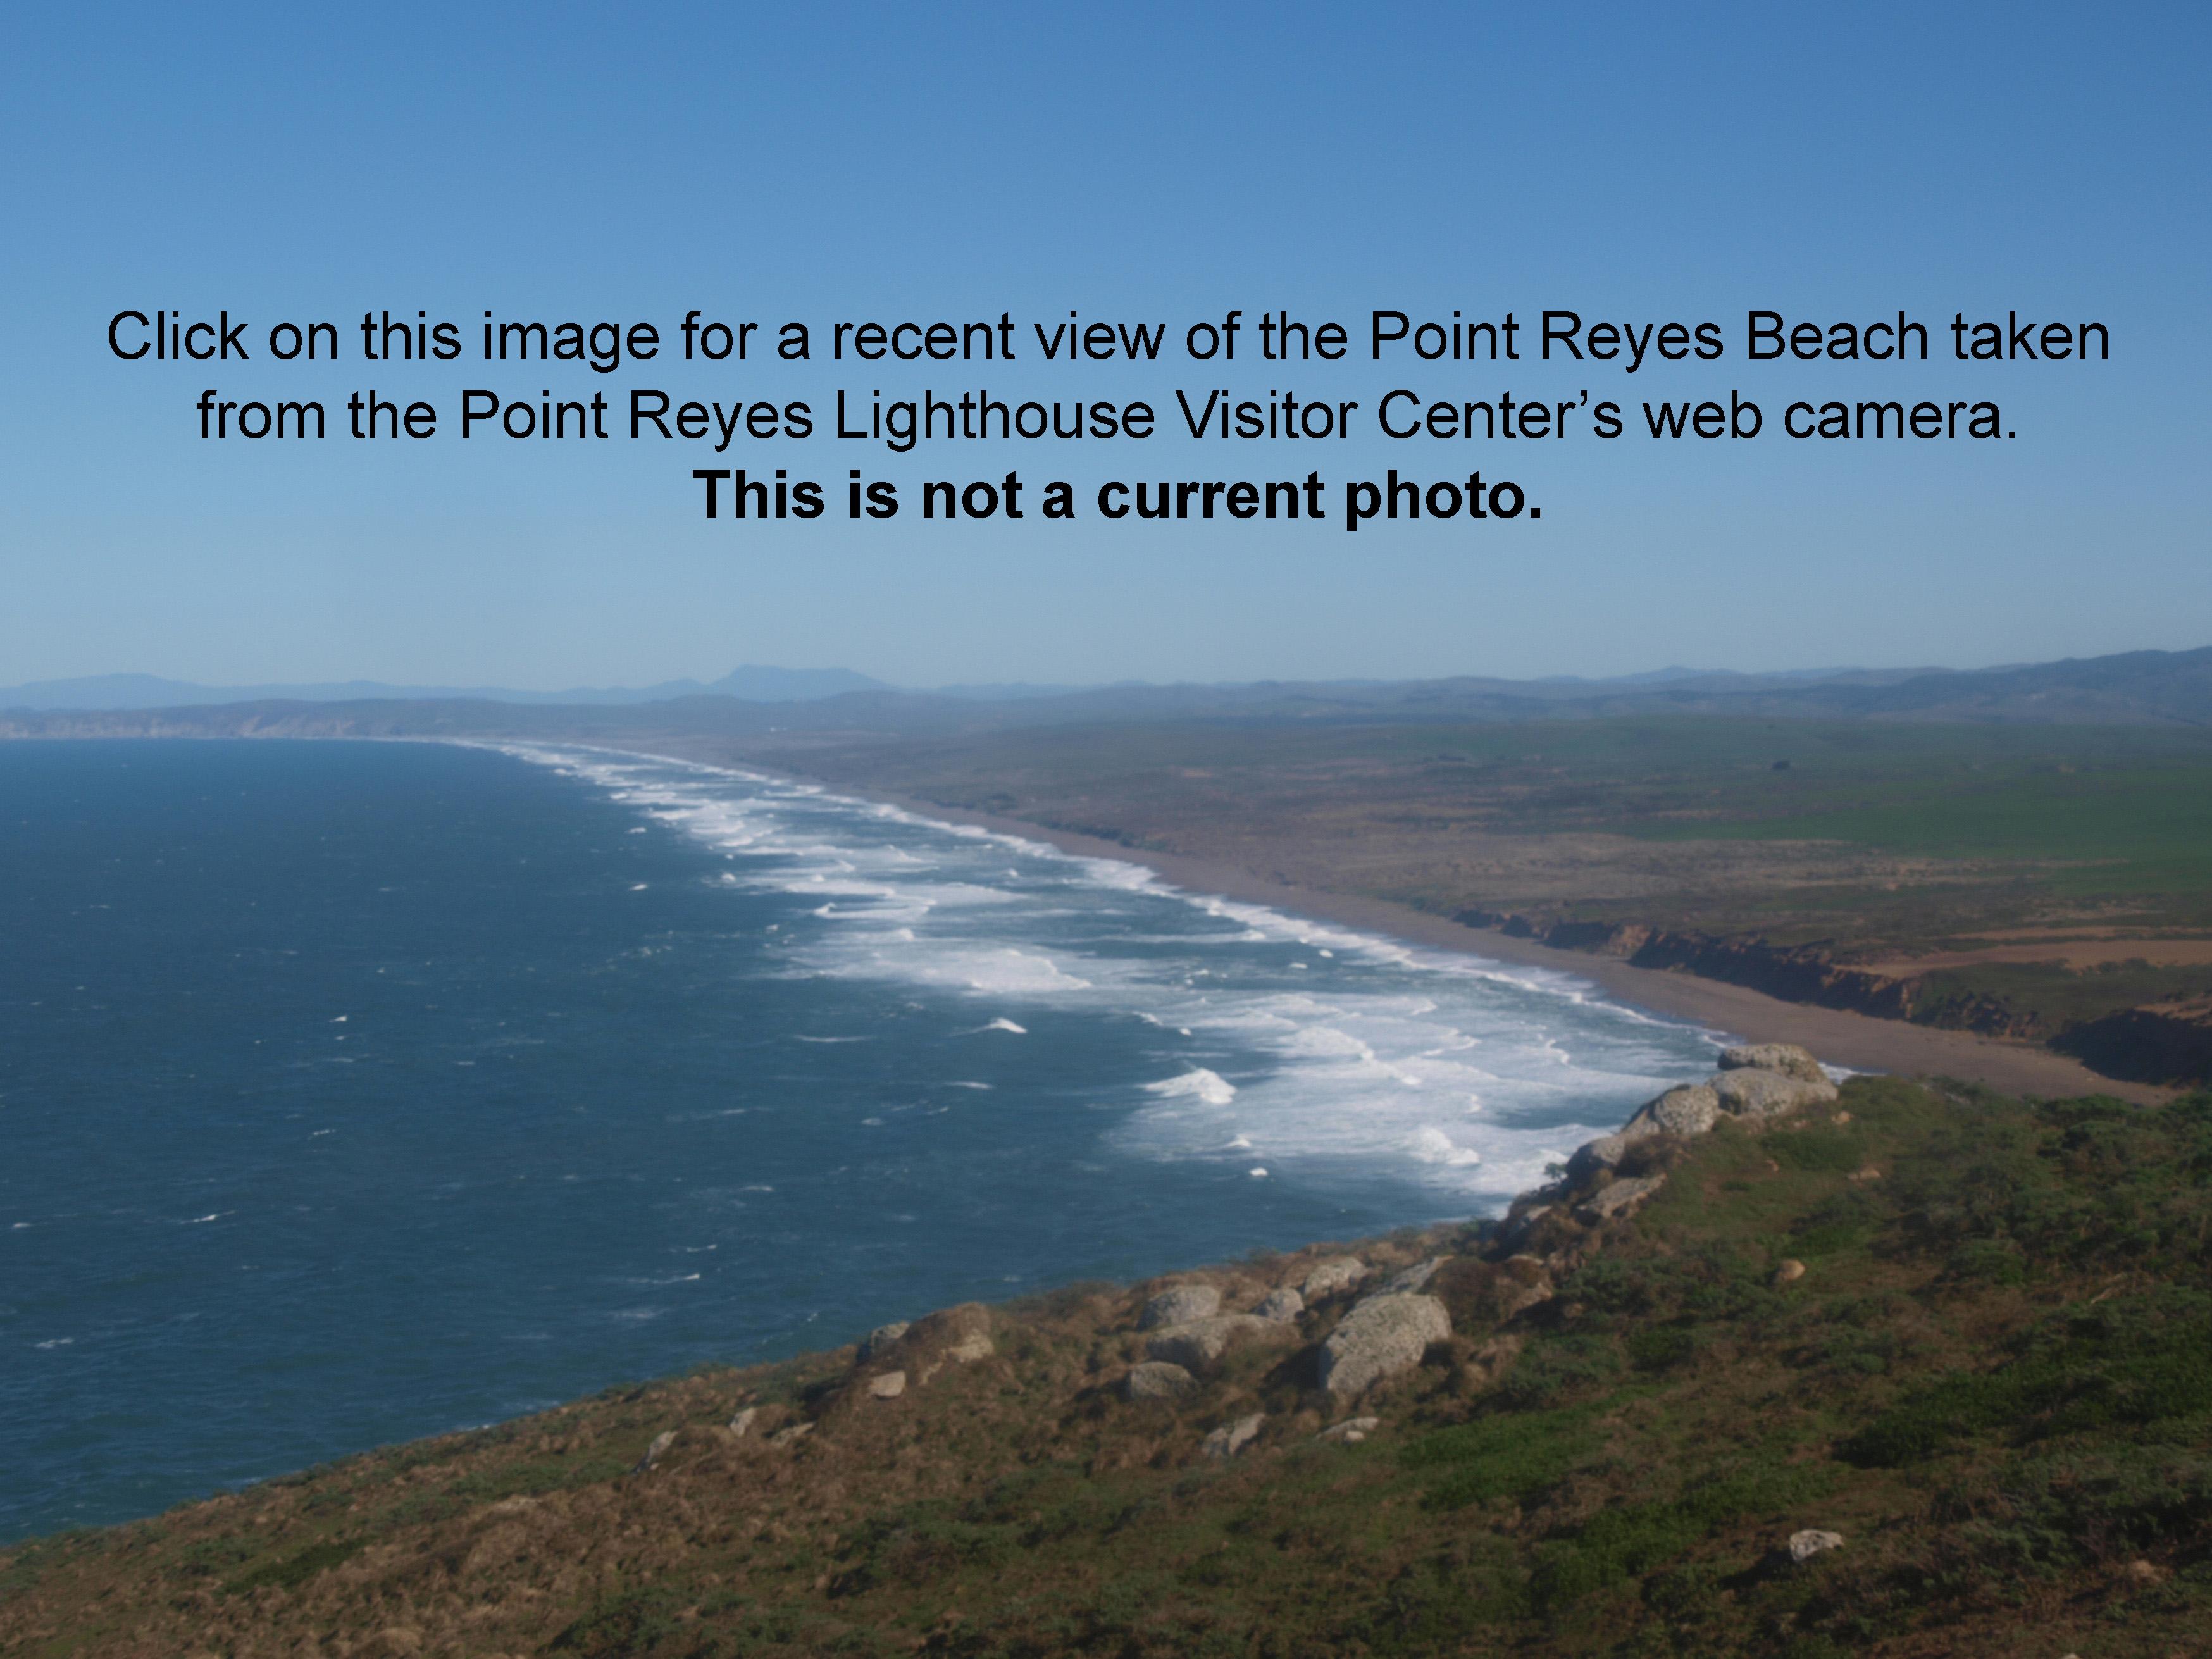
View of Point Reyes Beach Looking North-NortheastView of Point Reyes Beach Looking North-Northeast from the Point Reyes Lighthouse Visitor Center. Image refreshes every fifteen minutes. View WebcamDescription of Typical Weather by SeasonThe moderating influence of the Pacific Ocean creates a climate with no great extremes of heat or cold. Any season can bring interesting weather during your visit to Point Reyes National Seashore. Come prepared! Summer:Although there is very little rain during summer months, there is often dense fog. If you are visiting Bear Valley or Tomales Bay, expect patchy morning fog to burn off by mid-day. Afternoons are often sunny and warm with a light breeze. By contrast, the beaches and headlands are often 20 degrees cooler with heavy fogs common throughout the day in July, August and September. Fall:The coastal areas of Point Reyes experience some of the clearest days in late September, October and early November. The occasional storm will start rolling through in late October, bringing clouds, wind, and rain. The strongest winds occur in November and December during occasional southerly gales. Winter:The heaviest rainfall occurs in the winter months. Come prepared for rain and drizzle to possibly last for several days. More rain falls east of Inverness Ridge than on the west side. In between winter rains, it is often sunny, calm, and cool. Spring:Most spring days are windy and even Bear Valley and Tomales Bay experience stiff breezes. Expect cool temperatures in March. By late May and early June, temperatures can be quite warm on the east side of Inverness Ridge.
Data source: PRISM Climate Group at http://www.prism.oregonstate.edu/explorer/ Current WeatherReal-time weather conditions at Bear Valley Visitor Center National Weather Service ForecastsBear Valley/Olema National Weather Service Marine ForecastsZone Area Forecast for coastal waters from Point Arena to Point Reyes (including Tomales Bay) out to 10 NM National Weather Service Watches, Warnings, & AdvisoriesCoastal North Bay, including Point Reyes National Seashore Air QualityCurrent Air Quality Data
Bay Area Air Quality Management District Environmental Protection Agency For more information about this issue and how it impacts Point Reyes, visit our Nature > Environmental Factors > Air Quality page. For emergency road and weather conditions in West Marin, tune in to KWMR, 90.5 FM. TidesNOAA's Tides and Currents: Tide Predictions for Point Reyes Wind ForecastsThe following links are offered as two of many tools to determine the weather conditions at Point Reyes. Use them in conjunction with the other links above. Tsunamis | ||||||||||||||||||||||||||||||||||||||||||||||||||||||||||||||||||||||||||||||||||||||||||||||||||||||||||||||||||||||||||||||||||||||||||||||||||||||||||||
Last updated: September 18, 2025

