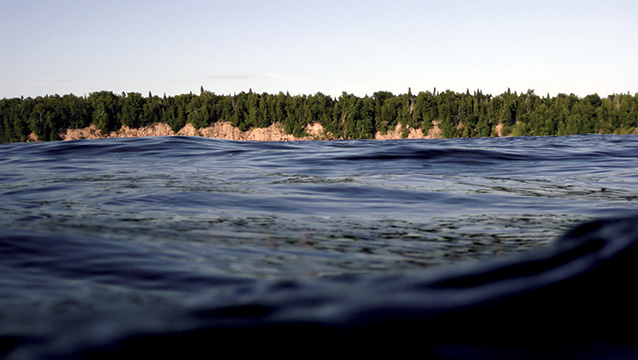
Nearshore waters have largely been left out of NPS monitoring programs [in the Great Lakes] because of financial, logistical, and jurisdictional constraints.
Abstract: In summer 2010 the coastal water quality in Great Lake national parks was assessed in conjunction with the EPA National Coastal Condition Assessment program (NCCA). Here we present the main findings from this survey, summarize environmental quality, and test whether conditions within park boundaries differ from those in the larger lake. We found that water quality was generally good within park boundaries, as assessed using NCCA criteria, and did not differ significantly from the larger Lakes Michigan and Superior with one exception. Dissolved nitrogen concentrations within three park boundaries were shown to be significantly different than in the larger lakes. The presence of contaminants in sediments and fish in all nearshore parks was widespread. However, contaminant concentrations only exceeded environmental criteria in two sites in Lake Michigan parks, and toxicology results revealed that concentrations at these sites were not acutely toxic to sediment-dwelling invertebrates. Ultimately, the data set compiled during this study offers managers a common baseline on which to build future monitoring efforts.
Key words: coastal parks, contaminants, Great Lakes, nearshore health, water quality
NPS Photo
ENCOMPASSING 18% OF THE COASTAL WATER ACREAGE in the National Park System, the Great Lakes national parks protect exquisite shorelines and nearshore waters as well as key fishery resources (National Park Service 2008). Like the Great Lakes in general, these parks face increasingly complex management issues, ranging from beach health and contaminant concerns to fisheries management, invasive species, and climate change (Allan et al. 2013). However, nearshore waters have largely been left out of NPS monitoring programs because of financial, logistical, and jurisdictional constraints. In addition, the monitoring work of other agencies and partners has generally been limited in scope or focused on specific research or management goals. Consequently baseline data on nearshore waters in these national parks are scarce, patchy in time and space, and in general poorly suited for a comprehensive assessment of nearshore conditions (Lafrancois and Glase 2005).
Many have recognized this gap in nearshore data availability. Davis (2004) outlined a Service-wide effort to enhance the NPS role in coastal park stewardship, noting a need to inventory, assess, and monitor coastal resources. Similarly, in 2008 the NPS Midwest Region released a strategy for protecting coastal waters in Great Lakes national parks, identifying a need to acquire and interpret baseline data on nearshore conditions (NPS 2008). These needs have been further emphasized in subsequent NPS natural resource condition assessments for Great Lakes parks, with significant nearshore data gaps noted at even the most prominent of these parks (e.g., Kraft et al. 2010). Concerns about nearshore conditions and data availability are echoed more broadly throughout the Great Lakes management community (Seelbach et al. 2013).
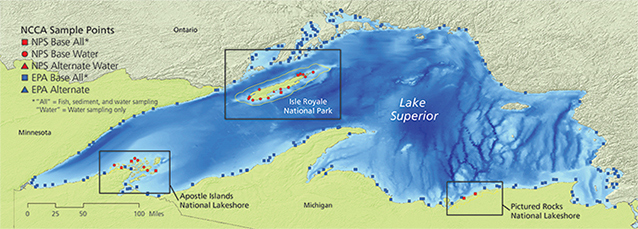
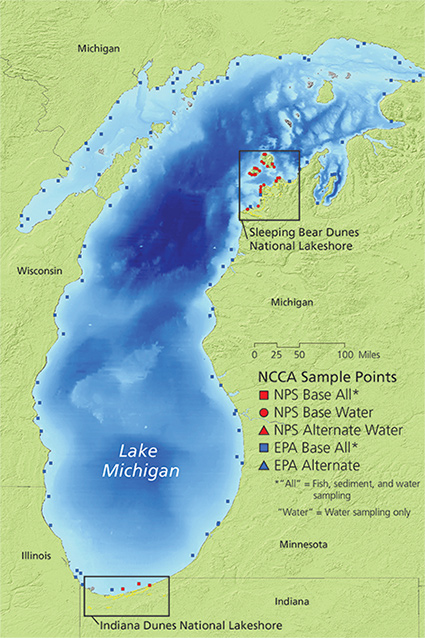
In 2010 the U.S. Environmental Protection Agency (EPA) scheduled its first-ever National Coastal Condition Assessment (a repeatable, wide-ranging environmental assessment; hereafter, NCCA) in Great Lakes waters. Simultaneously, the National Park Service received a critical influx of funds via the new Great Lakes Restoration Initiative, a large-scale, multiagency restoration program coordinated by the EPA. These funds enabled managers and scientists from the NPS Water Resources Division, Midwest Regional Office, and Great Lakes Inventory and Monitoring Network to partner with EPA to include NPS-administered sites in the 2010 condition assessment. The result is a comprehensive nearshore data set collected with consistent methods, addressing multiple media (water, sediments, and fish), and spanning five Great Lakes national parks (Isle Royale National Park and Apostle Islands, Indiana Dunes, Pictured Rocks, and Sleeping Bear Dunes National Lakeshores) as well as the nearshore waters of the Great Lakes that are not part of a national park (fig. 1).
Here we summarize the 2010 NCCA results, discuss NPS nearshore conditions relative to the broader Great Lakes NCCA data set and relevant environmental benchmarks, and describe implications for future NPS monitoring in the Great Lakes.
Methods
Sampling
Contractors sampled a total of 262 sites for water chemistry in Lakes Michigan and Superior, including 60 sites within Great Lakes national parks (30 in each of Lakes Michigan and Superior), over a 130-day period in the summer of 2010 (fig. 1). Sites were selected using a Generalized Random Tessellation Stratified survey design (Olsen 2009). Sampling (e.g., water, fish, and macroinvertebrates) and site reconnaissance protocols conformed to established EPA protocols for the NCCA program (USEPA 2010a). Sample depths ranged from 0.2 to 29.5 m (0.7–96.8 ft). Briefly, field measurements at each site involved water column profiles for light, temperature, dissolved oxygen, pH, and conductivity. Water quality and phytoplankton samples were collected at each site from a depth of 0.5 m (1.6 ft) via a pumping system or a bottle-based water sampling device. At a subset of sites, more extensive sediment and fish sampling occurred, detailed below. Multiple sediment samples were collected from these sites using a Ponar grab sampler for analysis of benthic species composition and abundance, physical and chemical characteristics, and use in acute whole sediment toxicity tests. Targeted fish species were collected for contaminant analysis using trawls and other appropriate methods.
Water Resources Division, May 2014. Coordinate system: GCS North American 1983.
Water Resources Division, May 2014. Coordinate system: GCS North American 1983.
Sediment chemistry and toxicity were assessed at 177 sites over both lakes; 13 of these sites were within a park’s boundaries. To evaluate the potential toxicity of existing contaminants to sediment-dwelling aquatic invertebrates, sediment toxicity assays were carried out using freshwater invertebrates (Hyalella azteca). The assays determined the percentage survival of the invertebrates relative to a clean control sample (USEPA 2010b). Additionally, we compared measured sediment contaminant concentrations with the consensus-based threshold effect concentration and the probable effect concentration (MacDonald et al. 2000). Results below the threshold effect concentration predict the absence of toxicity (lethality), and concentrations above the probable effect concentration tend to predict sediment toxicity accurately. A total of 192 samples were collected for benthic macroinvertebrates from depths ranging from 0.4 to 33.2 m (1.3–108.9 ft).
A total of 148 tissue samples were collected from resident fish and analyzed for toxics, including organochlorine pesticides, PCBs, and mercury. Sampling and analysis protocols for the NCCA program list the target fish species and length in each lake (USEPA 2010a). Analysis of contaminants in fish tissue is a useful estimator of the potential risk to human health (USEPA 2009b). We assessed all fish data against the ecological criteria under the Great Lakes Water Quality Agreement (GLWQA) (Governments of Canada and the USA 2012) and the EPA human health screening value,¹ which is intended for fillet tissue but is used here as a conservative comparison for whole-fish tissue concentrations.
¹EPA risk-based approach for a cancer health endpoint based on the consumption of four 8-ounce meals per month by a 150-pound adult human (USEPA 2000).
Sample analysis
Laboratory analysis and quality control adhered to EPA guidance for the assessment (USEPA 2010b). Water chemistry analyses included nutrient (ammonia nitrogen, nitrate + nitrite nitrogen, total nitrogen, soluble reactive phosphorus, and total phosphorus) and chlorophyll a concentrations, while sediment samples were analyzed for legacy and current-use organochlorine pesticides,² polychlorinated biphenyls (PCBs, 21 congeners measured), and heavy metals including total mercury. Whole-fish tissue samples were assessed for a similar suite of persistent toxic compounds as sediments; macroinvertebrate communities were also enumerated in a number of locations.
²dichlorodiphenyltrichloroethane (p,p' DDT), dichlorodiphenyldichloroethane (p,p' DDD), dichlorodiphenyldichloroethylene (p,p' DDE), and 13 additional compounds such as Mirex and Chlordane.
Data analysis
To test for potential differences in water and sediment chemistry within and beyond national park boundaries in Lakes Michigan and Superior we grouped the data into each Great Lake to test each water quality variable separately. We then tested the data for normality using a Shapiro-Wilks test and subsequently transformed all data except pH, dissolved oxygen, and secchi depth (table 1). We conducted a one-way ANOVA (analysis of variance) with a Levene’s test for equality of variance. Variables that showed significant differences were analyzed further to quantify the significance by park using either a Bonferroni or Dunnett’s test depending on the homogeneity of the variance. Water quality variables were also compared with the NCCA criteria for classification as “good,” “fair,” or “poor” (table 2; USEPA 2008; USEPA 2009a).
| Table 1. Summary of water chemistry parameters for Lakes Michigan and Superior national parks | ||||||||||||||||
|---|---|---|---|---|---|---|---|---|---|---|---|---|---|---|---|---|
| Parameter | Lake Superior | Lake Michigan | ||||||||||||||
| Trans-form-ation | Isle Royale National Park | Apostle Islands National Lakeshore | Pictured Rocks National Lakeshore | Lake Superior | Trans-form-ation | Indiana Dunes National Lakeshore | Sleeping Bear Dunes National Lakeshore | Lake Michigan | ||||||||
| Mean | SD | Mean | SD | Mean | SD | Mean | SD | Mean | SD | Mean | SD | Mean | SD | |||
| pH | none | 7.68 | 0.32 | 7.63 | 0.13 | 7.78 | 0.26 | 7.75 | 0.34 | none | 8.39 | 0.16 | 8.20 | 0.21 | 8.21 | 0.25 |
| Dissolved oxygen (mg/l) | none | 10.6 | 1.8 | 10.7 | 0.7 | 10.7 | 2.6 | 10.6 | 2.1 | none | 10.4 | 2.4 | 10.0 | 0.7 | 10.2 | 2.1 |
| Secchi depth (m) | none | 9.5 | 3.9 | 6.0 | 1.6 | 8.0 | 0.0 | 6.1 | 3.6 | none | 4.3 | 2.0 | 6.3 | 3.1 | 4.9 | 3.4 |
| % Photosynthetically active radiation at 1 m (3.3 ft) | log | 0.69 | 0.12 | 0.56 | 0.11 | 0.60 | 0.12 | 1.56 | 9.59 | log | 0.69 | 0.15 | 0.60 | 0.19 | 0.63 | 0.66 |
| NH3 (mg/l) | square root | 0.001 | 0.001 | 0.003 | 0.001 | 0.002 | 0.002 | 0.006 | 0.012 | square root | 0.003 | 0.002 | 0.006 | 0.004 | 0.008 | 0.010 |
| NO3 + NO2 (mg/l) | log | 0.369 | 0.031 | 0.343 | 0.024 | 0.333 | 0.016 | 0.323 | 0.054 | square root | 0.262 | 0.012 | .0271 | 0.017 | 0.170 | 0.134 |
| Total nitrogen (mg/l) | log | 0.433 | 0.026 | 0.497 | 0.015 | 0.393 | 0.033 | 0.445 | 0.149 | log | 0.431 | 0.043 | 0.434 | 0.020 | 0.429 | 0.202 |
| Soluble reactive phosphate (mg/l) | log | 0.004 | 0.001 | 0.003 | 0.001 | 0.004 | 0.001 | 0.006 | 0.006 | log | 0.008 | 0.004 | 0.006 | 0.003 | 0.005 | 0.003 |
| Total phosphorus (mg/l) | log | 0.004 | 0.001 | 0.003 | 0.002 | 0.003 | 0.002 | 0.007 | 0.013 | log | 0.004 | 0.001 | 0.004 | 0.002 | 0.010 | 0.022 |
| Dissolved inorganic nitrogen: Total phosphorus (molar) | none | 93 | 20 | 208 | 141 | 196 | 146 | 131 | 104 | none | 65 | 11 | 74 | 22 | 75 | 90 |
| Chlorophyll a (ppb) | log | 0.64 | 0.15 | 1.07 | 0.24 | 0.86 | 0.01 | 1.17 | 1.09 | log | 1.63 | 0.44 | 0.81 | 0.42 | 3.00 | 7.12 |
| n | 15 | 9 | 4 | 91 | 4 | 24 | 98 | |||||||||
| Table 2. Water quality criteria used by EPA during the National Coastal Condition Assessment | |||
|---|---|---|---|
| Parameter | Threshold | ||
| Good | Fair | Poor | |
| Dissolved oxygen (mg/l) | >5 | 2–50 | <2 |
| Chlorophyll a (ppb) | <5 | 5–20 | >20 |
| Dissolved inorganic nitrogen (mg/l) | <0.1 | 0.1–0.5 | >0.5 |
| Dissolved inorganic phosphorus (mg/l) | <0.01 | 0.01–0.05 | >0.05 |
| Water clarity (% surface light at 1 m [3.3 ft]) | >20% | 10–20% | <10% |
| Notes: Overall sample site water quality Good = No component indicators rated poor; maximum of one rated fair. Fair = One component indicator rated poor, or two or more indicators rated fair. Poor = Two or more component indicators rated poor. |
|||
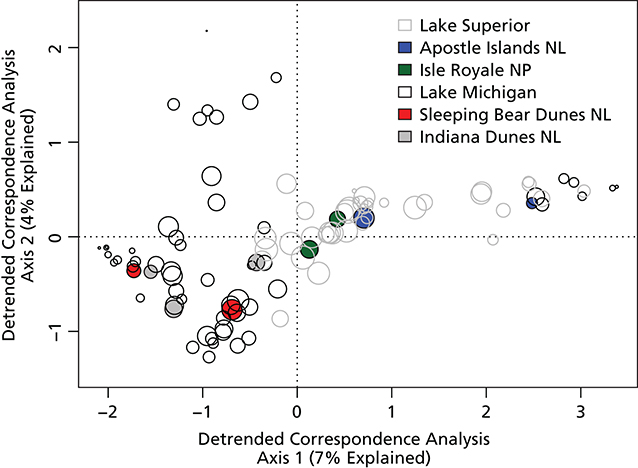
Macroinvertebrate sampling protocols (EPA) for bioassessment recommend a minimum of 100 individuals for community analysis (Barbour et al. 1999). Screening our data set yielded 101 of 192 sites that met this criterion. Macroinvertebrate species diversity was quantified by the Shannon-Wiener index and the number of individuals was standardized to a common count (100 as suggested above). The similarity of macroinvertebrate communities to one another was tested using a detrended correspondence analysis (DCA) (Hill and Gauch 1980). The DCA is a multivariate statistical tool that allows us to visualize how similar communities are by their proximity on a two-dimensional biplot (closer together is more similar). All data analyses were made using the program R (R Core Development Team 2014) and SPSS (SPSS 2009).
Results and discussion
Water chemistry
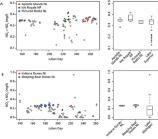
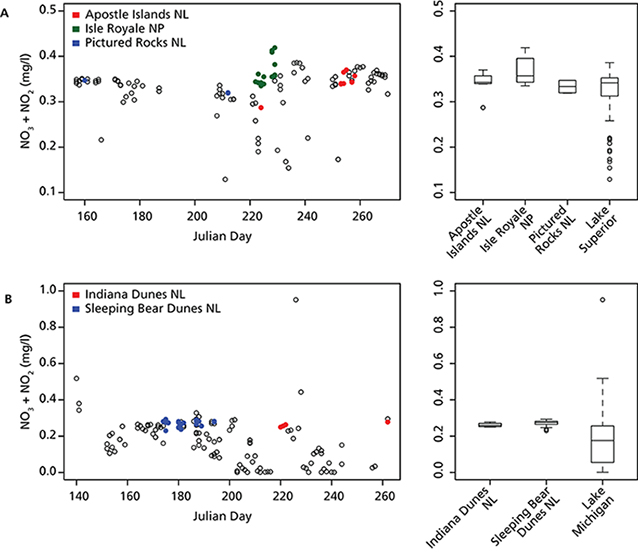
In general, water quality conditions in national park sites did not differ significantly from those outside these areas, with the exception of some nutrient variables. Dissolved inorganic nitrogen (largely as nitrate + nitrite, a nutrient variable) differed significantly within and beyond national park boundaries. In Lake Superior, Isle Royale had significantly higher dissolved inorganic nitrogen concentrations than the lake outside park boundaries (p = 0.038) (fig. 2A). This difference in dissolved inorganic nitrogen led to a significantly lower nutrient supply ratio (dissolved inorganic nitrogen to total phosphorus) between Isle Royale and the rest of Lake Superior (p = 0.011). Chlorophyll a concentrations (a surrogate measure for algae growth) were also significantly lower around Isle Royale when compared with the rest of the lake (p < 0.005) or Apostle Islands (p < 0.005) and Pictured Rocks (p < 0.005). In Lake Michigan, Sleeping Bear Dunes (p < 0.005) and Indiana Dunes (p < 0.005) had significantly higher dissolved inorganic nitrogen than the lake outside park boundaries (fig. 2B). Sleeping Bear Dunes also had significantly higher soluble reactive phosphorus (p < 0.005), the biologically available inorganic form of phosphorus that algae use.
The water quality status, as defined by the NCCA criteria (table 2), was classified as “good” for all sample sites in the Great Lakes national parks. Using more stringent assessment criteria based on the National Lakes Assessment (USEPA 2009a), a similar status of “good” was identified for these sites. Outside boundaries of NPS-administered areas, coastal water quality was also classified as “good” for most sites. However, several non–national-park sites in Lakes Michigan and Superior were classified as “fair” or “poor” because of elevated nutrient concentrations. These sites are affected by urban, industrial, and agricultural runoff and received high nutrient loading ratings in a recent stressor assessment for the Great Lakes (Allan et al. 2013).
Our observation of elevated dissolved inorganic nitrogen concentrations at Indiana Dunes and Sleeping Bear Dunes is puzzling but may relate to localized inputs from groundwater or agricultural tributaries. More surprising were the elevated inorganic nitrogen concentrations at remote Isle Royale. Long-term monitoring of one Isle Royale watershed has documented a significant increase in the concentrations of dissolved inorganic nitrogen and dissolved organic carbon over the last several decades, likely due to climate change and related impacts on temperature, snowpack accumulation, and soil microbial activity in park watersheds (Stottlemyer and Toczydlowski 2006; 2011). Long-term increases in dissolved inorganic nitrogen have also been noted in Lake Superior as a whole (Sterner et al. 2007; Sterner 2011). Our findings suggest that increased nitrogen leaching from remote watersheds such as Isle Royale may increasingly influence Lake Superior’s nutrient status as climate changes.
Sediment contaminants
There were no statistical differences in sediment contaminants among sites within and outside park boundaries in either Lake Superior or Michigan, although the total organic carbon concentrations in sediments collected within the boundaries of Pictured Rocks are significantly lower than those collected outside the park in Lake Superior (p = 0.027). All sites in the Great Lakes parks were below threshold effect concentration values for total PCBs (sum of all PCB congeners), total DDTs (sum of p,p' DDE, p,p' DDD, p,p' DDT), total PAHs, and the majority of heavy metals including mercury (fig. 3), suggesting low toxicity to invertebrates. However, two sites did exceed the threshold effect concentration for copper concentrations, one in Sleeping Bear Dunes and one at Apostle Islands; the same site in Sleeping Bear Dunes was also in excess of the probable effect concentration for chromium. The most heavily impacted sites in Lakes Michigan and Superior, where contaminant concentrations exceeded threshold effect concentration and probable effect concentration thresholds, were located adjacent to major urban and industrial centers and are recognized areas of concern. Additional sediment toxicity testing indicated that all sites within park boundaries were within threshold limits (i.e., they showed greater or equal invertebrate survival in comparison to control assays), including the site at Sleeping Bear Dunes where concentrations of chromium were above the PEC threshold. Several sites in Lake Michigan and one site in Lake Superior exceeded threshold limits for invertebrate toxicity; however, these sites were not located near national parks (fig. 3).

Contaminated sediments in the industrialized regions of the Great Lakes contribute to cumulative ecosystem stress (Allan et al. 2013). Previous assessments of the sediment chemistry in these lakes have identified sediment quality as a primary contributor to degraded overall quality at many sample sites (USEPA 2008). Although sediments within park boundaries did not exhibit acute toxicity, each of the sites at Indiana Dunes had detectable concentrations of total PAHs, and the threshold exceedances for copper and chromium at Apostle Islands and Sleeping Bear Dunes are of concern. Elevated concentrations of PAHs are well documented at Indiana Dunes and are likely the result of deposition of atmospheric particulates from coal and other combustion sources (Egler et al. 2013). Causes for elevated copper and chromium concentrations at the Apostle Islands and Sleeping Bear Dunes sites are less clear since neither site is directly influenced by riverine runoff or substantial urban or industrial sources, and copper concentrations are thought to be relatively moderate in and near these parks (Allan et al. 2013). However, copper and chromium have been associated with a range of agricultural and marine applications and both parks share a common agricultural (e.g., orchards) and maritime context.
Fish contaminants
The accumulation of legacy organochlorine pesticides, PCBs, and mercury in fish of the Great Lakes has long been recognized as a human health risk and a significant impact on the ecological health of these ecosystems (Environment Canada and the USEPA 2011). Although a majority of all fish samples (83%) had detectable concentrations of total PCBs, no samples from national park sites had concentrations exceeding a threshold of more than 100 ppb as per the GLWQA (Governments of Canada and the USA 2012), and only a few park sites (one from Apostle Island and seven from Indiana Dunes and Sleeping Bear Dunes combined) had concentrations exceeding the EPA human health screening value of 12 ppb (USEPA 2000). Similarly, most fish samples (86%) had detectable concentrations of total DDT, but none of the samples exceeded the threshold of 1,000 ppb as per the GLWQA (Governments of Canada and the USA 2012), and no national park samples exceeded the EPA’s human health screening value of 69 ppb (USEPA 2000). All fish samples contained detectable concentrations of mercury; however, no samples from national park sites exceeded the EPA recommended methylmercury criterion of 300 ppb (USEPA 2001). Two fish tissue samples from Lake Superior and one from Lake Michigan had mercury concentrations greater than the USEPA criterion. Chlordane is an organochlorine pesticide that was banned in the United States for all uses in 1988; however, it is still prevalent in fish tissue throughout the country (USEPA 2009b). We found measurable concentrations in 27% of all samples analyzed, but none exceeded the EPA human health screening value of 67 ppb (USEPA 2000).
Although concentrations of PCBs and legacy pesticides continue to decline in Great Lakes fish (Salamova et al. 2013), we note that PCBs and DDT are still detected in a large majority of fish from the 2010 survey. Recent studies document a halt in the declining trend of organic contaminant concentrations in fish tissue over time from the Great Lakes (Carlson et al. 2010; Monson et al. 2011), possibly because of changes in the base of the Great Lakes food web, which alter the biomagnification of these contaminants. Relative to previous studies of contaminants in the same species of fish from Lakes Superior and Michigan, concentrations measured during the 2010 survey were generally lower (Carlson et al. 2010). A recent survey (near Apostle Islands) of bald eagles, which are dependent on fish and other aquatic prey, found that contaminant concentrations were below levels thought to impair reproduction (Dykstra et al. 2010). However, new contaminants such as perfluorinated compounds also pose a threat to aquatic life and wildlife that depend on them (Route et al. 2014).
Benthic macroinvertebrate communities
Macroinvertebrate species diversity did not differ significantly among parks and the nonpark waters of the Great Lakes, nor did species richness. In previous assessments of Great Lakes macroinvertebrate communities, indicator species of Diporeia and Hexagenia have been used to evaluate benthic health because of their importance at the base of the Great Lakes food web (USEPA 2012). However, Diporeia and Hexagenia were not abundant enough to consider using them as lake-wide assessment tools for the coastal sites. Only one Diporeia specimen was identified and very few samples contained more than five Hexagenia specimens.
Analysis of the macroinvertebrate community and the species diversity data reveals a clear separation of communities between Lakes Michigan and Superior (fig. 4). Goforth and Carman (2005) suggest that nearshore substrate has a significant influence on the community structure and density of benthic organisms in the Great Lakes. However, the vast majority of sites in the 2010 survey had similar substrates dominated by sand. A range of other factors (e.g., currents, sediment contaminants, and local food webs) likely accounts for the variation in community composition among these sites. A handful of samples from Green Bay on Lake Michigan resemble samples from some Lake Superior sites, which is interesting given the differences in water chemistry between the two lakes.
Summary and management implications
The 2010 condition assessment survey indicated that coastal water quality in the Great Lakes national parks was generally good, and that sediment and fish contaminants were generally below levels of concern for consumption by humans and wildlife. However, we identified several potential management issues: (1) elevated dissolved inorganic nitrogen concentrations at Isle Royale, Indiana Dunes, and Sleeping Bear Dunes; (2) elevated heavy metal concentrations in sediments at Apostle Islands and Sleeping Bear Dunes; and (3) continued detection of legacy contaminants in whole-fish samples.
We found this broad-scale survey valuable for creating a baseline data set and providing a larger spatial context for understanding nearshore conditions in the Great Lakes national parks. Since conditions in NPS-administered waters did not differ greatly from those of the surrounding lake waters in the 2010 study, we conclude that the broader surveys of the EPA National Coastal Condition Assessment program (expected to recur every five years) may suffice for understanding general trends in coastal conditions at these parks. However, unless national parks are explicitly included in future NCCA study plans, it is not clear how many EPA sites will occur in or near national parks, or whether park-specific nearshore issues will be as readily identifiable. We expect results of this study to inform site selection for future interagency contaminant monitoring, inspire topical follow-up research, and serve as a foundation for understanding future trends in nearshore conditions at Great Lakes national parks.
Acknowledgments
This work was funded by the Great Lakes Restoration Initiative. We thank the dedicated staff and contractors of the EPA for their work on the study design, site selection, and sample collection and analysis. We also thank our EPA colleagues, Treda Grayson and Hugh Sullivan, for help with data access, and our NPS colleagues, Jeremy Cantor, David VanderMeulen, and Bill Route, for mapping support and helpful comments on earlier versions of this article.
References
Allan, J. D., P. B. McIntyre, S. D. Smith, B. S. Halpern, G. L. Boyer, A. Buchsbaum, G. A. Burton, L. M. Campbell, W. L. Chadderton, and J. J. Ciborowski. 2013. Joint analysis of stressors and ecosystem services to enhance restoration effectiveness. Proceedings of the National Academy of Sciences 110:372–377.
Barbour, M. T., J. Gerritsen, B. D. Snyder, and J. B. Stribling. 1999. Rapid bioassessment protocols for use in streams and wadeable rivers: Periphyton, benthic macroinvertebrates, and fish. Second edition. EPA 841-B-99-002. U.S. Environmental Protection Agency, Office of Water, Washington, D.C., USA.
Carlson, D. L., D. S. De Vault, and D. L. Swackhammer. 2010. On the rate of decline of persistent organic contaminants in lake trout (Salvelinus namaycush) from the Great Lakes 1970–2003. Environmental Science and Technology 44:2004–2010.
Davis, G. 2004. Maintaining unimpaired ocean resources and experiences: A National Park Service Ocean Stewardship Strategy. The George Wright Forum 2(4):22-41.
Dykstra, C. R., W. T. Route, M. W. Meyer, and P. W. Rasmussen. 2010. Contaminant concentrations in bald eagles nesting on Lake Superior, the upper Mississippi River, and the St. Croix River. Journal of Great Lakes Research 36:561–569.
Egler, A. L., M. R. Risch, D. A. Alvarez, and P. M. Bradley. 2013. Organic wastewater compounds in water and sediment in and near restored wetlands, Great Marsh, Indiana Dunes National Lakeshore, 2009–2011. USGS Scientific Investigations Report 2013–5186. U.S. Geological Survey, Reston, Virginia, USA. doi:10.3133/sir20135186.
Environment Canada and the U.S. Environmental Protection Agency. 2011. State of the Great Lakes 2011. Catalog number En161-3/1-2011E-PDF. EPA 950-R-13-002. Available at http://binational.net/2011/10/16/sogl-edgl-2011/.
Goforth, R. R., and S. M. Carman. 2005. Nearshore community characteristics related to shoreline properties in the Great Lakes. Journal of Great Lakes Research 31:113–128.
Governments of Canada and the United States of America. 2012. Great Lakes Water Quality Agreement with Annexes and Terms of Reference, originally published in 1978. International Joint Commission of the United States and Canada, Windsor, Ontario, Canada. Available at http://binational.net.
Hill, M., and H. Gauch. 1980. Detrended correspondence analysis: An improved ordination technique. Vegetatio 42:47–58.
Kraft, G. J., D. J. Mechenich, C. Mechenich, J. E. Cook, and S. M. Seiler. 2010. Assessment of natural resource conditions: Isle Royale National Park. Natural Resource Report NPS/NRPC/WRD/NRR-2010/237. National Park Service, Fort Collins, Colorado, USA.
Lafrancois, B. M., and J. Glase. 2005. Aquatic studies in national parks of the upper Great Lakes states: Past efforts and future directions. Water Resource Division Technical Report NPS/NRWRD/NRTR-2005/334. National Park Service, Denver, Colorado, USA.
MacDonald, D. D., C. G. Ingersoll, and T. A. Berger. 2000. Development and evaluation of consensus-based sediment quality guidelines for freshwater ecosystems. Archives of Environmental Contamination and Toxicology 39:20–31.
Monson, B. A., D. F. Staples, S. P. Bhavsar, T. M. Holsen, C. S. Schrank, S. K. Moses, D. J. McGoldrick, S. M. Backus, and K. A. Williams. 2011. Spatiotemporal trends of mercury in walleye and largemouth bass from the Laurentian Great Lakes Region. Ecotoxicology 20:1555–1567.
National Park Service. 2008. Great Lakes Strategy: Conserving national park resources on America’s freshwater coast. National Park Service, Midwest Region, Omaha, Nebraska, USA. 10 pp. Available at https://www.nature.nps.gov/water/oceancoastal/assets/docs/MWR_Great_Lakes_Strategy_Oct2008.pdf.
Olsen, A. R. 2009. National coastal assessment 2010 survey design. U.S. Environmental Protection Agency, Western Ecology Division. Corvallis, Oregon, USA. Available at http://water.epa.gov/type/oceb/assessmonitor/nccr/upload/NCA-2010-Design-Documentation-20090228.pdf.
R Core Development Team. 2014. R: A language and environment for statistical computing. R Foundation for Statistical Computing, Vienna, Austria. Described at http://www.R-project.org.
Route, W. T., R. E. Russell, A. B. Lindstrom, M. J. Strynar, and R. L. Key. 2014. Spatial and temporal patterns in concentrations of perfluorinated compounds in bald eagle nestlings in the upper midwestern United States. Environmental Science and Technology 48:6653–6660.
Salamova, A., J. J. Pagano, T. M. Holsen, and R. A. Hites. 2013. Post-1990 temporal trends of PCBs and organochlorine pesticides in the atmosphere and in fish from Lakes Erie, Michigan, and Superior. Environmental Science and Technology 47:9109–9114.
Seelbach, P. W., L. R. Fogarty, D. B. Bunnell, S. K. Haack, and M. W. Rogers. 2013. A conceptual framework for Lake Michigan coastal/nearshore ecosystems, with application to Lake Michigan Lakewide Management Plan (LaMP) objectives. Open-File Report 2013–1138. U.S. Geological Survey, Reston, Virginia, USA. Available at https://pubs.usgs.gov/of/2013/1138/.
SPSS Inc. 2009. PASW Statistics for Windows, Version 18.0. SPSS, Inc., Chicago, Illinois, USA.
Sterner, R. W. 2011. C: N: P stoichiometry in Lake Superior: Freshwater sea as end member. Inland Waters 1:29–46.
Sterner, R. W., E. Anagnostou, S. Brovold, G. S. Bullerjahn, J. C. Finlay, S. Kumar, R. M. L. McKay, and R. M. Sherrell. 2007. Increasing stoichiometric imbalance in North America’s largest lake: Nitrification in Lake Superior. Geophysical Research Letters 34:L10406.
Stottlemyer, R., and D. Toczydlowski. 2006. Effect of reduced winter precipitation and increased temperature on watershed solute flux, 1988–2002, Northern Michigan. Biogeochemistry 77:409–440.
———. 2011. Annual report for the Wallace Lake watershed, Isle Royale National Park, Michigan: Trends 1982–2010. Unpublished summary report. National Park Service, Ashland, Wisconsin, USA.
U.S. Environmental Protection Agency (USEPA). 2000. Guidance for assessing chemical contaminant data for use in fish advisories. Volume 2: Risk assessment and fish consumption limits. Third edition. EPA823-B-00-008. U.S. Environmental Protection Agency, Office of Science and Technology, Office of Water, Washington, D.C., USA.
———.2001. Water quality criterion for the protection of human health: Methylmercury. EPA-823-R-01-001. U.S. Environmental Protection Agency, Office of Water, Office of Science and Technology, Washington, D.C., USA.
———. 2008. National coastal condition report III. EPA-842-R-08-002 U.S. Environmental Protection Agency, Office of Water and Office of Research and Development, Washington, D.C., USA.
———. 2009a. National lakes assessment: A collaborative survey of the nation’s lakes. EPA-841-R-09-001. U.S. Environmental Protection Agency, Office of Water, Washington, D.C., USA.
———. 2009b. The national study of chemical residues in lake fish tissue. EPA-823-R-09-006. U.S. Environmental Protection Agency, Office of Water, Washington, D.C., USA.
———. 2010a. National coastal condition assessment: Field operations manual. EPA-841-R-09-003. U.S. Environmental Protection Agency, Office of Water and Office of Research and Development, Washington, D.C., USA.
———. 2010b. National coastal condition assessment: Laboratory methods manual. EPA-841-R-09-002. U.S. Environmental Protection Agency, Office of Water and Office of Research and Development, Washington, D.C., USA.
———. 2012. National coastal condition report IV. EPA-842-R-10-003. U.S. Environmental Protection Agency, Office of Water and Office of Research and Development, Washington, D.C., USA.
About the authors
William O. Hobbs is with the Washington State Department of Ecology in Olympia. He was formerly with the St. Croix Watershed Research Station, Science Museum of Minnesota, Marine on St. Croix. Brenda Moraska Lafrancois (corresponding author) is with the NPS Midwest Region and Water Resources Division, Ashland, Wisconsin. Eva DiDonato is with the NPS Water Resources Division, Fort Collins, Colorado.
Download: PDF of this article
This article published
Online: 6 May 2016; In print: 25 March 2016
URL
https://www.nps.gov/ParkScience/articles/parkscience32_2_36-45_hobbs_et_al_3834.htm
Suggested citation
Hobbs, W. O., B. M. Lafrancois, and E. DiDonato. 2016. Nearshore conditions in the Great Lakes national parks: A baseline water quality and toxicological assessment. Park Science 32(2):36–45.
This page updated
5 May 2016
Site navigation
• Back to Volume 32, Number 2
• Back to Park Science home page
Tags
- apostle islands national lakeshore
- indiana dunes national park
- isle royale national park
- pictured rocks national lakeshore
- sleeping bear dunes national lakeshore
- park science journal
- ps v32 n2
- case study
- coastal parks
- contaminants
- great lakes
- nearshore health
- water quality
- apostle islands national lakeshore
- indiana dunes national lakeshore
- isle royale national park
- pictured rocks national lakeshore
- sleeping bear dunes national lakeshore
- environmental quality
Last updated: August 9, 2018

