Our goal was to estimate the degree to which lake trout indirectly altered the benthic invertebrates of Yellowstone Lake
Abstract: Invasive predators can induce trophic cascades in the open water of lakes; however, much less is known about their effect on benthic invertebrates, which inhabit the lake bottom, or benthic zone. Lake trout (Salvelinus namaycush) were introduced to Yellowstone Lake, Wyoming, and reduced the Yellowstone cutthroat trout (Oncorhynchus clakrii bouvieri) population. We predicted that lake trout indirectly reduced predation of benthic invertebrates through cutthroat trout. To estimate how the benthic invertebrate assemblages differed under cutthroat trout– versus lake trout–dominated food webs, we collected benthic invertebrate samples from two areas of Yellowstone Lake in 2004 using a Ponar sampler and compared them with stomach contents from cutthroat trout. Cutthroat trout selectively ate benthic invertebrates with the largest body sizes. The amphipod genus, Gammarus, had the highest biomass of all benthic invertebrates. Gammarus biomass was higher in West Thumb (6,000 mg/m² [0.02 oz/ft²]) where lake trout dominated and lower in South Arm (3,160 mg/m² [0.01 oz/ft²]) where cutthroat trout dominated (p = 0.01). Additionally, individual body mass of Gammarus was greater in West Thumb (1.6 mg/individual [0.000056 oz/individual]) than in South Arm (1.1 mg/individual [0.000039 oz/individual; p = 0.01). Our results suggest that lake trout predation on cutthroat trout indirectly reduced predation on Gammarus in West Thumb, leading to a relative increase in the local Gammarus biomass and body mass. Monitoring the benthos of Yellowstone Lake may allow managers to understand the food web dynamics at higher trophic levels.
Key words: diet, invasive species, invertebrates, trophic cascade, Yellowstone cutthroat trout
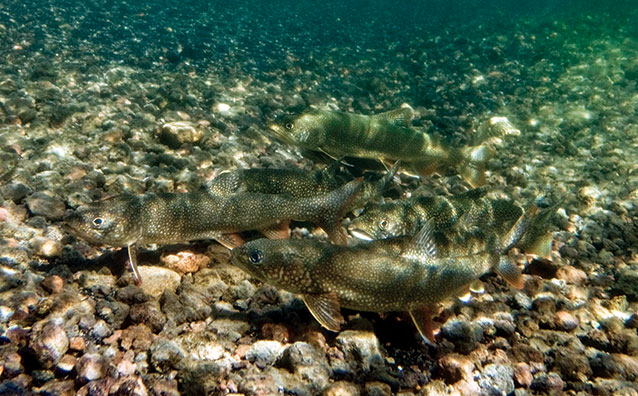
Copyright Jay Fleming
LAKE TROUT (SALVELINUS NAMAYCUSH) HAVE BEEN WIDELY INTRODUCED, both legally and illegally, throughout the western United States (Martinez et al. 2009) (fig. 1). These fish are considered apex predators in lakes because they occupy the top trophic level (Post et al. 2000). Lake trout have been successful invaders in many lakes and can alter ecosystems through competition, hybridization, predation, and trophic cascades, described below (Martinez et al. 2009). For example, lake trout in two Idaho lakes reduced bull trout (Salvelinus confluentus) populations through competition, and lake trout can hybridize with other trout, such as brook trout (Salvelinus fontinalis; Behnke 2002). These piscivores (fish predators) have reduced the native fish populations in many lakes and reservoirs (Martinez et al. 2009), which can lead to a trophic cascade that alters the structure of the pelagic (open water) food web (Tronstad et al. 2010). The effects of trophic cascades have been studied thoroughly in the pelagic zone of lakes, but few studies have examined trophic cascades in the lake benthos (life associated with the bottom substrate of aquatic habitats; fig. 2).
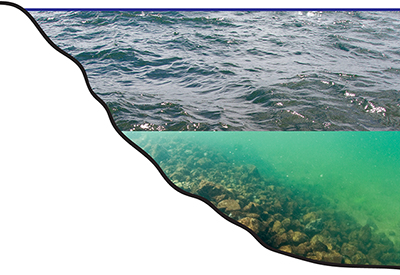
Pelagic Zone: Lusha Tronstad; benthic Zone: Copyright Jay Fleming
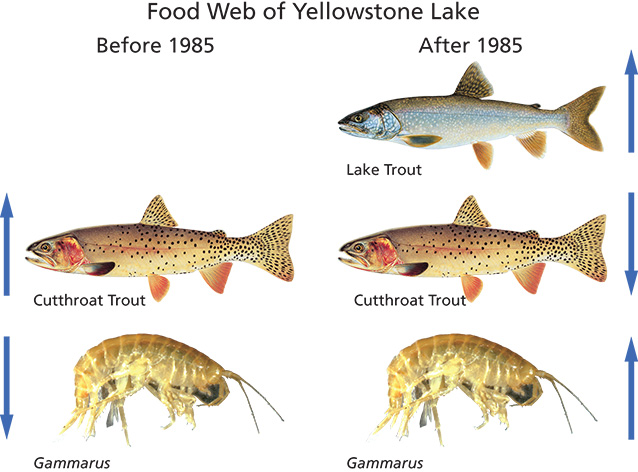
Trout: Copyright Joe Tomelleri; Gammarus: Lusha Tronstad
Introduced lake trout can change lower trophic levels through direct and indirect effects (Tronstad et al. 2010). Trophic cascades are naturally occurring processes in ecosystems where top predators control the biomass of lower trophic levels (the position an organism occupies in the food web). These top-down effects create a pattern of alternating biomass from high to low between trophic levels (e.g., Carpenter et al. 1987; fig. 3). Trophic cascades also alter the body size of herbivores. For example, the introduction of northern pike (Esox lucius) in a Canadian lake reduced the abundance of plankton-eating fish, increased the body size of zooplankton (microscopic invertebrates that live in the pelagic zone of lakes), and decreased phytoplankton (algae that live in the pelagic zone of lakes) biomass (Findlay et al. 2005). Introducing a species that occupies a new trophic level can alter the structure of the food web when interactions among trophic levels are strong.
Trophic cascades can occur when predators eat a variety of organisms, but predators can still affect lower trophic levels when they eat specific prey. For example, specialist fish predators preferentially fed on and drastically reduced specific prey taxa but had less of an effect on other benthic invertebrates (Brönmark 1994). Despite reducing only prey taxa, these fish indirectly increased benthic primary production. Current knowledge of benthic trophic cascades is based on enclosure manipulations (Brönmark et al. 1992; Brönmark 1994) and observations in ponds (Brönmark and Weisner 1996). Carpenter and Kitchell (1993) recommend conducting in situ studies on the lake benthos to better understand food web dynamics.
Yellowstone Lake ecosystem
Indigenous fish species within Yellowstone Lake include Yellowstone cutthroat trout (Onchorynchus clarkii bouveri) and longnose dace (Rhinichthys cataractae; Gresswell et al. 1997). Lake trout were illegally introduced into Yellowstone Lake around 1985 (Munro et al. 2005) and discovered in 1994 (Kaeding et al. 1996). In addition to lake trout, redside shiner (Richardsonius balteatus), lake chub (Couesius plumbeus), and longnose sucker (Catostomus catostornus; Gresswell and Varley 1988) have been introduced to Yellowstone Lake. Lake trout and cutthroat trout are the dominant fish in the lake and the other species occur in much lower abundances. After their introduction, lake trout flourished and decreased the abundance of native Yellowstone cutthroat trout through predation (Koel et al. 2005). Lake trout feed heavily upon cutthroat trout and can attain relatively large body sizes (e.g., 120 cm [47 in] and 11 kg [25 lb]; Behnke 2002), allowing them to eat more and larger cutthroat trout. Additionally, Ruzycki et al. (2003) estimated that lake trout can eat cutthroat trout up to 57% of their body length. In the Yellowstone Lake food web, lake trout filled a new niche (fourth trophic level) and induced a four-level trophic cascade in the pelagic zone of Yellowstone Lake (Tronstad et al. 2010; see fig. 3). The introduction of lake trout indirectly increased the biomass and body size of zooplankton, resulting in lower biomass of phytoplankton.
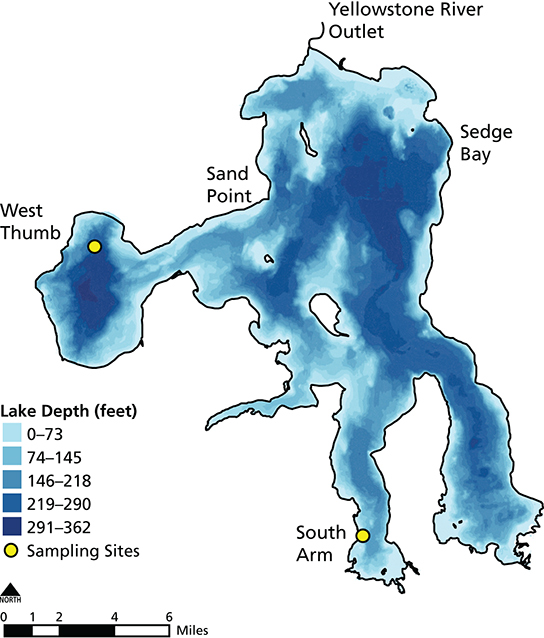
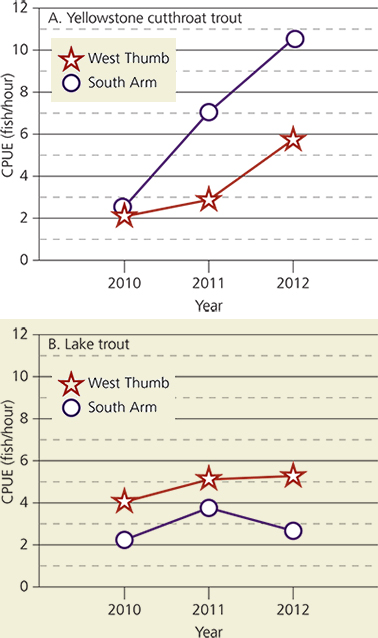
Despite an altered pelagic food web, the degree to which lake trout disrupted the benthic or lake bottom food web of Yellowstone Lake has not been studied before. Benthic invertebrates may have been altered indirectly by the lake trout invasion because cutthroat trout feed heavily on amphipods within the littoral or nearshore zone that is less than 20 m (66 ft) deep (Tronstad et al. 2015; see fig. 2). Amphipods or scuds are small crustaceans that are abundant in Yellowstone Lake. Gammarus is the most common amphipod in the lake. Our goal was to estimate the degree to which lake trout indirectly altered the benthic invertebrates of Yellowstone Lake. We studied two sites within Yellowstone Lake (figs. 4 and 5) with varying densities of cutthroat trout and lake trout. This was necessary as a space-for-time substitution because benthic invertebrates were not collected when cutthroat trout were abundant. South Arm has higher cutthroat trout densities than West Thumb (fig. 6) and is considered the last spatial refuge for this native trout within Yellowstone Lake (Koel et al. 2004). Our specific questions were: (1) How did the biomass of invertebrates compare between sites with different trout abundances? (2) To what degree did amphipod biomass and size differ between sites? (3) How did the assemblage and body mass of invertebrates in cutthroat trout diets compare with benthic samples? And (4) How strong were the interactions between lake trout, Yellowstone cutthroat trout, and amphipods?

Carrington Island: Todd Koel; South Arm: Lusha Tronstad
Material and methods
Study area
Yellowstone Lake is located in Yellowstone National Park in northwestern Wyoming and is the largest lake in North America above an elevation of 2,000 m (6,562 ft; Gresswell et al. 1997). The lake has a surface area of 340.0 km² (131.3 mi²) and a mean depth of 43 m (141 ft; Kaplinski 1991). The littoral zone of Yellowstone Lake occupies 81.0 km² (31.3 mi² ) and encompasses about 24% of the lake (Benson 1961). Ice covers the lake from December through May (Gresswell and Varley 1988) and the primary productivity is mesotrophic (moderate productivity by algae; Kilham et al. 1996).
Patterns of habitat use differ between lake trout and cutthroat trout. Lake trout live deep within the pelagic zone, feeding on invertebrates as juveniles and preying on fish as adults (Ruzycki et al. 2003). In Yellowstone Lake, lake trout have large home ranges and move throughout the lake in search of food (T. Koel and J. Arnold, personal observation). Juvenile cutthroat trout are thought to live in the pelagic zone (Gresswell and Varley 1988), which may make them more vulnerable to predation by lake trout. Adult cutthroat trout move into the littoral zone of the lake and feed on both zooplankton and benthic macroinvertebrates (Benson 1961).
Shortly after the discovery of lake trout in Yellowstone Lake, fisheries managers at Yellowstone National Park initiated an aggressive removal program in an attempt to conserve cutthroat trout (Koel et al. 2005). These efforts have progressively increased since implementation. Using gill nets, resource managers removed approximately 25,000 lake trout from Yellowstone Lake in 2004 and more than 200,000 in 2011 (Koel et al. 2012b)
Christine Fisher
Sampling and laboratory analysis
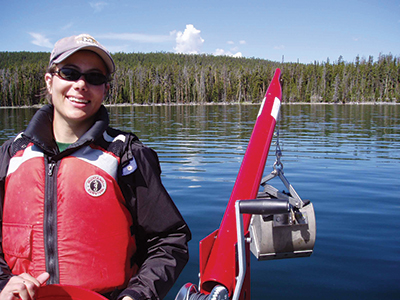
We collected invertebrate samples in the littoral zone of West Thumb and South Arm during the ice-free months of June to November 2004 to estimate their density and biomass. The West Thumb site was near Carrington Island and the South Arm site was near the southern end of the lake at the edge of the motorless zone (figs. 4 and 5). We collected four samples from each site on six dates: 30 June, 14 July, 29 July, 30 August, 23 September, and 21 October. We sampled the benthos using a Ponar grab sampler (524 cm² [81 in²] sampling area) attached to a winch and a crane mounted on a boat (fig. 7). We sieved samples with 500 µm (0.02 in) mesh and preserved samples in approximately 75% ethanol.
We removed invertebrates from the debris in the laboratory and identified individuals under a dissecting microscope using dichotomous keys (Merritt et al. 2008; Thorp and Covich 2010). We counted all individuals in each sample to calculate density. Additionally, we measured the first 20 haphazardly chosen individuals of each taxon to calculate biomass (ash-free dry mass [AFDM] of all animals per unit area of the lake bottom). We estimated invertebrate biomass for most taxa using previously published length-mass regressions (Benke et al. 1999; Johnson et al. 2012). For taxa that did not have published length-mass regressions, we calculated biomass using other methods. For leeches, we randomly selected five individuals from each species and dried them in an oven at 65°C (149°F) for 18 hours. The leeches were placed in a desiccator for 1 hour before weighing. To calculate biomass for oligochaetes, ostracods, copepods, nematodes, and acari we estimated a mean length and width based on individuals in the samples, and we assumed a specific gravity of 1.13 and a dry mass–to–wet mass conversion of 0.25 (Feller and Warwick 1988).
We measured the density and biomass of trout stomach contents to estimate the degree to which cutthroat trout feed on benthic invertebrates. We were unable to use historical information because biomass of stomach contents was not previously calculated (Benson 1961; Jones et al. 1990). We caught seven cutthroat trout at Sand Point in June 2004 and flushed their stomachs to identify and measure what they were eating. Invertebrates in stomach contents were identified to the lowest possible taxonomic level, counted, and measured. We examined gut contents under a dissecting microscope and calculated individual and total biomass of gut contents using the same principles as for the benthic fauna analysis above (e.g., Benke et al. 1999).
We used the method by Cross et al. (2011) to compare the species impact of cutthroat trout and lake trout on Gammarus. The species impact is the production of Gammarus (accumulation of Gammarus biomass over time) consumed by trout divided by Gammarus biomass in the benthos of Yellowstone Lake. Cross et al. (2011) found an annual production-to-biomass ratio of 3.3/year for rainbow trout (Onchorynchus mykiss) in Lake Powell (Glen Canyon National Recreational Area, Utah and Arizona). This finding means that rainbow trout produce 3.3 times as much mass in a year relative to the mass of all these fish at a given time. We assumed that this value was similar for cutthroat trout and lake trout in Yellowstone Lake.
We multiplied annual trout production-to-biomass ratio by trout biomass in each area of the lake (g/m²) to estimate annual fish consumption (g/m²/yr, or grams per meter squared per year). We used mean individual size to estimate trout biomass for cutthroat trout (350 mm [14 in] total length; 85 g [3 oz] dry mass; Tronstad et al. 2015) and lake trout (500 mm [20 in] total length; 264 g [9 oz] dry mass; Syslo et al. 2011) in Yellowstone Lake. We multiplied annual fish production by the proportion of Gammarus in trout stomach contents to estimate the production of trout from Gammarus (Pgam; g/m²/yr). In other words, we calculated the amount of trout biomass that is produced annually from eating Gammarus. Gammarus made up 9.8% of lake trout stomach contents by volume (Ruzycki et al. 2003). The proportion of cutthroat trout diet from Gammarus was calculated based on biomass of Gammarus in each stomach sample divided by total biomass in each stomach.
The number of lake trout and cutthroat trout in each study area was estimated based on total population size and catch in each area. In 2004, the total cutthroat trout population in Yellowstone Lake was estimated at 1.4 million individuals (Tronstad et al. 2015) and the total lake trout population was approximately 125,000 individuals (Syslo et al. 2011). We calculated the number of lake trout and cutthroat trout in West Thumb and South Arm using proportions based on catch per unit effort (CPUE) values throughout the lake in 2010 (Koel et al. 2012a); however, previous years did not have estimates of lake trout CPUE. The littoral zone area was calculated for South Arm (11.0 km² [4.2 mi²]) and West Thumb (8.6 km² [3.3 mi²]) using ArcMap and bathymetry (underwater depth; unpublished data, Yellowstone National Park). Using total cutthroat trout and lake trout biomass, we calculated total biomass for each species per unit area of the littoral zone for both study sites. We calculated the species impact for cutthroat trout and lake trout on Gammarus in West Thumb and South Arm by dividing the production of trout from Gammarus (Pgam) by the biomass of Gammarus from benthic samples (g/m²).
We used R version 3.0.0 (R Core Development Team 2013) for calculations and statistical analyses. We used the Wilcoxon signed rank test to test for differences in density, biomass, and individual body mass between South Arm and West Thumb, because our data were not normally distributed. We subtracted South Arm values from West Thumb values and tested whether the difference was significantly greater than zero, because we predicted that biomass and body size would be higher in West Thumb where lake trout are more abundant. We estimated error by “bootstrapping” 95% confidence intervals (CI; the region between the 2.5% and 97.5% quantiles), because our data were not normally distributed and contained many zeros for rare taxa (e.g., Huryn 1996). Bootstrapping uses the data we collected to estimate the uncertainty in our measures without making any assumptions about the distribution of our data. We sampled with replacement 10,000 times from the four replicate samples and six dates for each taxon at each site (i.e., 24 samples total from each site).
Results
We collected 23 taxa of invertebrates in three phyla in the benthos of Yellowstone Lake. Noninsects (6,100 individuals/m² [600 individuals/ft²]) had lower density than insects (8,900 individuals/m² [800 individuals/ft²]), but they also had much higher biomass (7,100 mg/m² [0.02 oz/ft²]) than insects (500 mg/m² [0.002 oz/ft²]; table 1). Of the noninsects, amphipods had the highest density (2,500 individuals/m² [200 individuals/ft²]) and biomass (2,500 mg/m² [0.008 oz ft²]), followed by oligochaetes (500 individuals/m² [50 individuals/ft²] and 1,200 mg/m² [0.004 oz/ft²]). We collected three orders of insects, including Ephemeroptera (mayflies), Trichoptera (caddisflies), and Diptera (true flies). The family Chironomidae (nonbiting midges) had by far the highest density (8,800 individuals/m² [800 individuals/ft²]) and biomass (400 mg/m² [0.001 oz/ft²]; table 1).
| Table 1. Mean density and biomass of benthic invertebrates in South Arm and West Thumb of Yellowstone Lake | ||||
|---|---|---|---|---|
| Taxona | Density (individuals/m²) | Biomass (mg/m²) | ||
| South Arm | West Thumb | South Arm | West Thumb | |
| Ephemeroptera | 11 (0–32) |
94 (0–248) |
10 (0–51) |
67 (0–206) |
| Trichoptera | 22 (0–76) |
38 (0–97) |
17 (0–91) |
15 (0–54) |
| Diptera | 9,289 (3,463–17,132) |
8,319 (2,738–20,108) |
522 (185–1,138) |
372 (106–857) |
| Chironomidae | 9,259 (3,420–16,949) |
8,223 (2,565–19,676) |
522 (185–1,137) |
372 (108–866) |
| Crustacea | 4,897 (2,359–7,749) |
5,216 (2,165–9,762) |
3,880 (1,340–7,402) |
5,998 (2,793–10,995) |
| Gammarus | 2,902 (1,342–5,163) |
3,452 (2,186–6,255) |
3,160 (957–6,597) |
5,500 (3,403–10,262) |
| Hyallela | 1,923 (498–3,788) |
1,699 (32–4,751) |
671 (99–2,113) |
486 (7–1,540) |
| Annelida | 657 (152–1,483) |
756 (173–1,710) |
1,848 (535–3,774) |
2,099 (594–4,254) |
| H. stagnalisb | 36 (0–119) |
70 (0–281) |
34 (0–115) |
68 (0–262) |
| N. obscurab | 105 (22–206) |
124 (54–303) |
670 (139–1,316) |
797 (346–1,939) |
| Oligochaeta | 514 (54–1,342) |
552 (76–1,483) |
1,141 (120–2,979) |
1,225 (168–3,316) |
| Mollusca | 283 (11–844) |
139 (0–541) |
171 (0–568) |
100 (0–473) |
| Sphaeriidae | 267 (0–823) |
114 (0–509) |
45 (0–223) |
6 (0–22) |
| Planorbidae | 14 (0–54) |
11 (0–54) |
126 (0–471) |
94 (0–471) |
| Insect | 9,321 (3,528–17,262) |
8,450 (2,813–20,022) |
549 (198–1,167) |
453 (152–954) |
| Noninsect | 6,044 (2,825–10,649) |
6,255 (2,565–11,970) |
5,901 (2,488–9,895) |
8,199 (3,929–14,208) |
| Total | 15,365 (7,835–24,535) |
14,705 (6,050–27,803) |
6,450 (2,869–10,542) |
8,652 (4,301–14,884) |
|
Note: Boldfaced taxa represent summed means for all individuals within a group. Bootstrapped confidence intervals are in parentheses and boldfaced values represent significant differences where p-values ≤ 0.05. Bootstrapping uses the data we collected to estimate the uncertainty in our measures without making any assumptions about the distribution of our data. aWe omitted taxa with biomass Glossiphonia complanata), Mollusca (Planorbidae and Physidae), and Arachnida. bHelobdella stagnalis and Nephelopsis obscura. |
||||
Although values for density and biomass of most taxa were higher in West Thumb than in South Arm, the differences were not statistically significant (p > 0.05). Total density (p = 0.81) and biomass (p = 0.10) of invertebrates was similar between sites (table 1). Conversely, Ephemeroptera density (p < 0.01) and biomass (p < 0.01) were greater in West Thumb than in South Arm. Noninsects had marginally higher biomass in West Thumb (p = 0.06; table 1). This pattern is driven primarily by slightly higher biomass of crustaceans (p = 0.04), and specifically Gammarus (p = 0.01), in West Thumb where lake trout are more abundant.
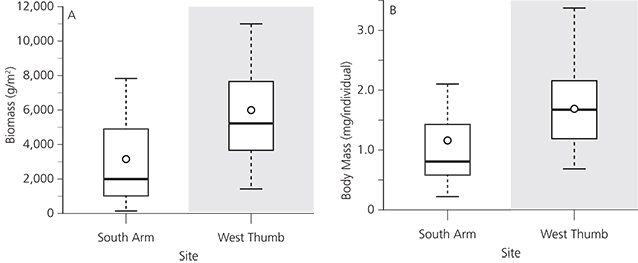
Gammarus was a dominant taxon in the benthos of Yellowstone Lake and their biomass differed between sites. Gammarus comprised 69% of the assemblage in West Thumb and 49% of the assemblage in South Arm based on biomass. We collected 75% higher biomass of Gammarus in West Thumb than in South Arm (p = 0.01; fig. 8A). Individual Gammarus body mass was 50% greater in West Thumb than in South Arm (p < 0.01; fig. 8B).
Gammarus makes up a large proportion of the invertebrates that cutthroat trout eat in Yellowstone Lake. This amphipod (52%) dominated invertebrate biomass in cutthroat trout stomachs, followed by Daphnia (water fleas; 29%), Chironomidae (midges; 12%), Ephemeroptera (mayflies; 2%), and Copepoda (copepods; 2%). The individual body mass of invertebrates in cutthroat trout stomachs was larger than in individuals in benthic samples. Mean Gammarus body mass was 9.6 mg/individual (0.0003 oz/individual) in cutthroat trout stomachs compared to 1.3 mg/individual (0.00005 oz/individual) in benthic samples. Mean body mass of Ephemeroptera in cutthroat trout stomachs was 2.7 mg/individual (0.0001 oz/individual) compared to 0.8 mg/individual (0.00003 oz/individual) in benthic samples. Chironomidae mean body mass in cutthroat trout stomachs was 0.3 mg/individual (0.000001 oz/individual) compared to 0.05 mg/individual (0.000002 mg/individual) in the benthos.
Cutthroat trout strongly interacted with Gammarus in South Arm where these fish are numerous. They had a larger species impact on Gammarus in South Arm than in West Thumb, as we predicted based on cutthroat trout numbers and food web dynamics (table 2). Conversely, lake trout had a much smaller species impact on Gammarus at both sites (table 2). Assuming the annual production-to-biomass ratio for Gammarus in Yellowstone Lake is 5 per year (Benke and Huryn 2007), cutthroat trout ate half of Gammarus production in South Arm and 17% of Gammarus production in West Thumb. Lake trout ate far less Gammarus production at both sites (< 5%).
| Table 2. Parameters for calculating species impact of Yellowstone cutthroat trout and lake trout on Gammarus in South Arm and West Thumb of Yellowstone Lake | |||||
|---|---|---|---|---|---|
| Fish Species | Site | Trout Biomassa in Littoral Zone (g DM/m²) | Gammarus consumed by trout (g DM/m²/yr) | Production of trout from Gammarus Consumption (g DM/m²/yr) | Species Impact |
| Yellowstone cutthroat trout | South Arm | 4.4 | 15 | 7.7 | 2.4 |
| West Thumb | 2.9 | 10 | 5.2 | 0.9 | |
| Lake trout | South Arm | 0.8 | 3 | 0.3 | 0.1 |
| West Thumb | 1.9 | 6 | 0.6 | 0.1 | |
| aBiomass is the dry weight of animals, production is the accumulation of biomass over time, and units are in dry mass (DM) (Syslo et al. 2011; Koel et al. 2012a). | |||||
Discussion
Invasive lake trout reduced the abundance of cutthroat trout in Yellowstone Lake (Koel et al. 2005), which increased the mean biomass and body size of cutthroat trout’s dominant food source, Gammarus. Lake trout directly reduced cutthroat trout through predation and indirectly released Gammarus from predation by cutthroat trout (fig. 3). Cutthroat trout reduced Gammarus biomass and body size in South Arm where these fish are still relatively abundant (fig. 8). In contrast, Gammarus populations show greater biomass and greater individual body mass in West Thumb where lake trout dominated.
Our results suggest that cutthroat trout are eating the largest Gammarus in Yellowstone Lake, inducing spatial variation in the benthic invertebrate assemblage. Cutthroat trout feed heavily on Gammarus and higher abundances of native trout mean fewer and smaller Gammarus. Unfortunately, benthic invertebrate samples were not collected in the past when cutthroat trout were abundant throughout the lake, but differences in Gammarus biomass and individual body mass may be even greater in pre– versus post–lake trout invasion samples had they been available for comparison. We collected samples after lake trout invaded Yellowstone Lake and cutthroat trout had drastically declined. We used variation in present trout densities to assess the degree to which a benthic trophic cascade may have occurred. Based on our results, lake trout likely induced a benthic trophic cascade whereby fewer cutthroat trout released Gammarus from predation.
Fish selectively feed on larger amphipods (Newman and Waters 1984; Wellborn 1994; Laudon et al. 2005). Newman and Waters (1984), for example, observed that brook trout, brown trout (Salmo trutta), rainbow trout, and sculpins (Cottus cognatus) selectively fed on larger Gammarus in a Minnesota stream, despite seasonal variation in mean body size of amphipods. Mean and median sizes of Gammarus in stomach samples from these fish species were much larger than those in the benthos. Similarly, invertebrates in the stomach contents of cutthroat trout were larger than invertebrates in benthic samples from Yellowstone Lake. Furthermore, Gammarus had greater mean individual body mass in West Thumb than in South Arm, suggesting that size-selective predation differed between sites. Cutthroat trout ate the largest available Gammarus in Yellowstone Lake, but these amphipods did not grow as large in South Arm because cutthroat trout were more abundant and collectively ate more.
The diet of cutthroat trout in Yellowstone Lake has been sampled extensively in the past. Despite our small sample size, past studies support our diet results. The stomach contents of cutthroat trout were collected in 1957 and 1958 (Benson 1961; n = 344 and 429 respectively), 1970 (Dean 1971; n = 81), 1974 (Scott 1977; n = 56), and 1989 (Jones et al. 1990; n = 132). These studies report that amphipods comprised between 4% and 40% of stomach contents based on number of individuals in each stomach sample. Tronstad et al. (2015) showed that percentage of amphipods in the diet of cutthroat trout was a function of cutthroat trout abundance. Cutthroat trout numbers varied over time from low abundances in the 1940s and 1950s, when egg-taking and liberal creel limits reduced the fish population, to the 1970s and 1980s, when the cutthroat trout abundance peaked (Koel et al. 2005). When cutthroat trout are less abundant they have more amphipods in their diet, perhaps because these crustaceans are more available. Similarly, our results showed that amphipods, specifically Gammarus, made up a large fraction of cutthroat trout diet and our results are similar to past studies when cutthroat trout were less abundant.
Most studies have investigated trophic cascades in the pelagic zone of lakes, but few studies have shown top-down effects on lake benthos. Trophic cascades were observed in benthic communities by manipulating organisms using enclosure and exclosure experiments in which the removal of pumpkinseeds (Lepomis gibbosus) altered the biomass of benthic algae in two Wisconsin lakes (Brönmark et al. 1992). While we did not artificially manipulate fish densities in Yellowstone Lake, we used variation in the present densities of cutthroat and lake trout in two study areas as a space-for-time substitution. We did this to draw conclusions about the degree to which the invasion of lake trout and the subsequent decline of cutthroat trout altered benthic invertebrates in Yellowstone Lake.
Benthic trophic cascades have been observed less frequently in natural ecosystems. Brönmark and Weisner (1996) surveyed 44 ponds with two to four trophic levels in southern Sweden. Ponds with two or three trophic levels had strong interactions among organisms, but piscivores (fourth trophic level) weakly interacted with lower trophic levels. This is likely because piscivorous fishes could not eat their prey because they were too large. In contrast, we observed strong interactions among trophic levels in Yellowstone Lake. Differences in the benthic fauna in our study suggest lake trout prey heavily upon cutthroat trout. Change in body size of benthic fauna provides strong evidence that a trophic cascade occurred (Carpenter et al. 2001; Findlay et al. 2005) and we observed the predicted changes in body size of Gammarus (i.e., smaller in areas of more intense predation) in the benthos of Yellowstone Lake.
Alternative hypotheses
Differences in the benthic invertebrate assemblages may be due to factors other than the introduction of lake trout. The differences we observed between our sites may be attributed to hydrothermal inputs. West Thumb is located within the Yellowstone caldera where the presence of hydrothermal activity alters the chemistry of the lake (Morgan et al. 2003), whereas South Arm is outside the caldera. Ammonium-nitrogen concentrations (464 ppb) from hydrothermal waters in Sedge Bay of Yellowstone Lake were much higher than in ambient lake water (2 ppb; Klump et al. 1988). This nutrient input affected the biota immediately surrounding the thermal vents where microorganisms and oligochaetes flourished (Klump et al. 1988). Additionally, amphipods have been observed at high densities around the hydrothermal vents located in shallow areas of Yellowstone Lake (Morgan et al. 2003). Balistrieri et al. (2007) estimated fluid input from hydrothermal vents to be 16–25 million liters/day (4.2–6.6 million gallons/day). Given the average discharge of the Yellowstone River was about 3.5 billion liters/day (9.2 billion gallons/day; U.S. Geological Survey data, available at https://waterdata.usgs.gov; gage 06186500), the contribution of hydrothermal water into the lake is relatively low (< 1%). Therefore, nitrogen inputs from hydrothermal vents probably do not contribute a substantial amount of nitrogen to the lake. Furthermore, hydrothermal water is transported and mixed throughout the lake (Balistrieri et al. 2007), suggesting that water chemistry does not vary significantly from location to location. We do not attribute higher biomass and larger body mass of Gammarus to hydrothermal activity in West Thumb.
Lake trout may alter the biomass and body size of amphipods because these fish also feed on invertebrates. Amphipods comprised 25% of the diet of juvenile lake trout in Yellowstone Lake (Ruzycki et al. 2003). Although juvenile lake trout feed upon amphipods, they do so only for the first few years of their lives. Conversely, cutthroat trout feed on amphipods throughout their lives, suggesting that these fish eat far more amphipods than do lake trout. These differences are reflected in the species impacts on Gammarus, whereby the interaction between Gammarus and cutthroat trout is much stronger than the interaction between lake trout and Gammarus. Lake trout ate about 2% of Gammarus production at both of our sites in Yellowstone Lake. Therefore, the difference in amphipod biomass between our sites is probably not due to lake trout feeding on amphipods.
Management implications
Lake trout can indirectly affect lower trophic levels in the pelagic (Tronstad et al. 2010) and benthic zones of Yellowstone Lake. However, the effects of introduced lake trout may reach much further and actually alter nutrient cycling in tributary streams (Tronstad et al. 2015). Lake trout spawn within the lake and live deep in the water column, making them relatively inaccessible to avian and terrestrial predators. Conversely, cutthroat trout spawn in the shallow tributary streams of Yellowstone Lake and are more vulnerable to these kinds of predators. Historically, avian and terrestrial predators relied heavily on cutthroat trout as a food source (Koel et al. 2005). Currently, lower abundances of spawning cutthroat trout correlate with declining bear activity around Yellowstone Lake (Koel et al. 2005). Evidence suggests that the introduction of lake trout caused a trophic cascade that began in Yellowstone Lake and rippled into tributary streams (Tronstad et al. 2015) and the surrounding terrestrial ecosystems (Middleton et al. 2013).
In an attempt to suppress the lake trout, the National Park Service implemented an aggressive removal program to conserve cutthroat trout. Although removal of lake trout has increased every year since their introduction (Koel et al. 2005), this highly invasive species has proven to be difficult to remove because they live deep in the pelagic zone, and Yellowstone Lake is relatively large and deep. Monitoring the benthic invertebrates of Yellowstone Lake, specifically Gammarus, may help managers to assess food web dynamics occurring at higher trophic levels. Combining benthic invertebrate and trout data will yield stronger and more informative results than either separately.
Acknowledgments
Thanks to Christine Fisher, Heather Thon, Jessie Julien, Bryan Tronstad, and Lisa Kunza for helping with sample collecting and processing. Pat Bigelow, Brian Ertel, Phil Doepke, Christine Hendrix, Christine Smith, and the seasonal fisheries staff of 2004 in Yellowstone National Park made this research possible. Thanks to Amy Krist, Tonya Chamberlain, and Chau Tran for comments that improved the manuscript.
References
Balistrieri, L. S., W. C. Shanks, R. L. Cuhel, C. Aguilar, and J. V. Klump. 2007. The influence of sublacustrine hydrothermal vent fluids on the geochemistry of Yellowstone Lake. Pages 169–199 in L. A. Morgan, editor. Integrated geoscience studies in the Greater Yellowstone Area—Volcanic, tectonic, and hydrothermal processes in the Yellowstone geoecosystem. U.S. Geological Survey Professional Paper 1717, Reston, Virginia, USA.
Behnke, R. J. 2002. Trout and salmon of North America. Pages 1–359. Free Press, New York, New York, USA.
Benke, A. C., and A. D. Huryn. 2007. Secondary production of macroinvertebrates. Pages 691–710 in F. R. Hauer and G. A. Lamberti, editors. Methods in stream ecology. Academic Press/Elsevier, Burlington, Massachusetts, USA.
Benke, A. C., A. D. Huryn, L. A. Smock, and J. B. Wallace. 1999. Length-mass relationship for freshwater macroinvertebrates in North America with particular reference to the southeastern United States. Journal of the North American Benthological Society 18:308–343.
Benson, N. G. 1961. Limnology of Yellowstone Lake in relation to the cutthroat trout. U.S. Government Printing Office O-595956, Washington, D.C., USA.
Brönmark, C. 1994. Effects of tench and perch on interactions in a freshwater, benthic foodchain. Ecology 75:1818–1828.
Brönmark, C., S. P. Klosiewski, and R. A. Stein. 1992. Indirect effects of predation in a freshwater, benthic foodchain. Ecology 73:1662–1674.
Brönmark, C., and S. E. B. Weisner. 1996. Decoupling of cascading trophic interactions in a freshwater, benthic food chain. Oecologia 108:534–541.
Carpenter, S., and K. F. Kitchell. 1993. The trophic cascade in lakes. Cambridge University Press, New York, New York, USA.
Carpenter, S. R., J. J. Cole, J. R. Hodgson, J. F. Kitchell, M. L. Pace, D. Bade, K. L. Cottingham, T. E. Essington, J. N. Houser, and D. E. Schindler. 2001. Trophic cascades, nutrients, and lake productivity: Whole-lake experiments. Ecological Monographs 71:163–186.
Carpenter, S. R., J. F. Kitchell, J. R. Hodgson, P. A. Cochran, J. J. Elser, M. M. Elser, D. M. Lodge, D. Kretchmer, X. He, and C. N. von Ende. 1987. Regulation of lake primary productivity by food web structure. Ecology 68:1863–1876.
Cross, W. F., C. V. Baxter, K. C. Donner, E. J. Rosi-Marshall, T. A. Kennedy, R. O. Hall Jr., H. A. W. Kelly, and R. S. Rogers. 2011. Ecosystem ecology meets adaptive management: Food web response to a controlled flood on the Colorado River, Glen Canyon. Ecological Applications 21:2016–2033.
Dean, J. L. 1971. Annual project report for 1970 Fishery Management Program. Yellowstone National Park, Wyoming, USA.
Feller, R. J., and R. M. Warwick. 1988. Energetics. Pages 181–196 in R. P. Higgins and H. Thiel, editors. Introduction to the study of meiofauna. Smithsonian Institution Press, Washington, D.C., USA.
Findlay, D. L., M. J. Vanni, M. Paterson, K. H. Mills, S. E. M. Kasian, W. J. Findlay, and A. G. Salki. 2005. Dynamics of a boreal lake ecosystem during a long-term manipulation of top predators. Ecosystems 8:603–618.
Gresswell, R. E., W. J. Liss, G. L. Larson, and P. J. Bartlein. 1997. Influence of basin-scale physical variables on life history characteristics of cutthroat trout in Yellowstone Lake. North American Journal of Fisheries Management 17:1046–1064.
Gresswell, R. E., and J. D. Varley. 1988. Effects of a century of human influence on the cutthroat trout of Yellowstone Lake. American Fisheries Society Symposium 4:45–52.
Huryn, A. D. 1996. An appraisal of the Allen Paradox in a New Zealand trout stream. Limnology and Oceanography 41:243–252.
Johnson, P. T. J., D. L. Preston, J. T. Hoverman, J. S. Henderson, S. H. Paull, K. L. D. Richgels, and M. D. Redmond. 2012. Species diversity reduces parasite infection through cross-generational effects on host abundance. Ecology 93:56–64.
Jones, R. D., R. Andrascik, D. G. Carty, E. M. Colvard, R. Ewing, W. R. Gould, R. E. Gresswell, D. L. Mahony, T. Olliff, and S. E. Relyea. 1990. Annual Project Technical Report for 1989 Fishery and Aquatic Management Program. Yellowstone National Park, Wyoming, USA.
Kaeding, L. R., G. D. Boltz, and D. G. Carty. 1996. Lake trout discovery in Yellowstone Lake threaten native cutthroat trout. Fisheries 21:16–20.
Kaplinski, M. A. 1991. Geomorphology and geology of Yellowstone Lake, Yellowstone National Park, Wyoming. Northern Arizona University, Flagstaff, Arizona, USA.
Kilham, S. S., E. C. Theriot, and S. C. Fritz. 1996. Linking planktonic diatoms and climate change in the large lakes of the Yellowstone ecosystem using resource theory. Limnology and Oceanography 41:1052–1062.
Klump, J. V., C. C. Remsen, and J. L. Kaster. 1988. The presence and potential impact of geothermal activity on the chemistry and biology of Yellowstone Lake. Global Venting, Midwater and Benthic Ecological Processes 88:81–98.
Koel, T. M., J. L. Arnold, P. E. Bigelow, C. R. Detjens, P. D. Doepke, B. D. Ertel, and M. E. Ruhl. 2015. Native fish conservation program, Yellowstone fisheries and aquatic sciences: Annual report, 2012–2014. Yellowstone National Park, Wyoming, USA.
Koel, T. M., J. L. Arnold, P. E. Bigelow, P. D. Doepke, B. D. Ertel, and M. E. Ruhl. 2004. Yellowstone fisheries and aquatic sciences: Annual report, 2003. Yellowstone National Park, Wyoming, USA.
———. 2012a. Yellowstone fisheries and aquatic sciences: Annual report, 2009–2010. Yellowstone National Park, Wyoming, USA.
———. 2012b. Yellowstone fisheries and aquatic sciences: Annual report, 2011. Yellowstone National Park, Wyoming, USA.
Koel, T. M., P. Bigelow, P. D. Doepke, B. D. Ertel, and D. L. Mahony. 2005. Nonnative lake trout result in Yellowstone cutthroat trout decline and impacts to bears and anglers. Fisheries 30:10–19.
Laudon, M. C., B. Vondracek, and J. K. H. Zimmerman. 2005. Prey selection by trout in a spring-fed stream: Terrestrial versus aquatic invertebrates. Journal of Freshwater Ecology 20:723–733.
Martinez, P. J., P. Bigelow, M. A. Deleray, W. A. Fredenberg, B. S. Hansen, N. J. Horner, S. K. Lehr, R. W. Schneidervin, S. A. Tolentino, and A. E. Viola. 2009. Western lake trout woes. Fisheries 34:424–442.
Merritt, R. W., K. W. Cummins, and M. B. Berg. 2008. An Introduction to the aquatic insects of North America. Kendall Hunt Publishing, Dubuque, Iowa, USA.
Middleton, A. D., T. A. Morrison, J. K. Fortin, C. T. Robbins, K. M. Proffitt, P. J. White, D. E. McWhirter, T. M. Koel, D. G. Brimeyer, W. S. Fairbanks, and M. J. Kauffman. 2013. Grizzly bear predation links the loss of native trout to the demography of migratory elk in Yellowstone. Proceedings of the Royal Society Biological Sciences Series B 280:1–8.
Morgan, L. A., P. Shanks, D. Lovalvo, K. Pierce, G. Lee, M. Webring, W. Stephenson, S. Johnson, C. Finn, B. Schulze, and S. Harlan. 2003. The floor of Yellowstone Lake is anything but quiet! Yellowstone Science 11:14–30.
Munro, A. R., T. E. McMahon, and J. R. Ruzycki. 2005. Natural chemical markers identify source and date of introduction of an exotic species: Lake trout (Salvelinus namaycush) in Yellowstone Lake. Canadian Journal of Fisheries and Aquatic Sciences 62:79–87.
Newman, R. M., and T. F. Waters. 1984. Size-selective predation on Gammarus pseudolimnaeus by trout and sculpins. Ecology 65:1535–1545.
Post, D. M., M. L. Pace, and N. G. Hairston. 2000. Ecosystem size determines food-chain length in lakes. Nature 405:1047–1049.
R Core Development Team. 2013. R: A language and environment for statistical computing. R Foundation for Statistical Computing, Vienna, Austria.
Ruzycki, J. R., D. A. Beauchamp, and D. L. Yule. 2003. Effects of introduced lake trout on native cutthroat trout in Yellowstone Lake. Ecological Applications 13:23–37.
Scott, J. C. 1977. A study of the Cladocera and Copepoda of Yellowstone Lake, and adjacent lagoons, Yellowstone National Park, Wyoming. University of Nebraska, Omaha, USA.
Syslo, J. M., C. S. Guy, P. E. Bigelow, P. D. Doepke, B. D. Ertel, and T. M. Koel. 2011. Response of non-native lake trout (Salvelinus namaycush) to 15 years of harvest in Yellowstone Lake, Yellowstone National Park. Canadian Journal of Fisheries and Aquatic Sciences 68:2132–2145.
Thorp, J. H., and A. P. Covich. 2010. Ecology and classification of North American freshwater invertebrates. Elsevier, New York, New York, USA.
Tronstad, L. M., R. O. Hall Jr., and T. M. Koel. 2015. Introduced lake trout alter nitrogen cycling beyond Yellowstone Lake. Ecosphere 6(11):224. doi:10.1890/ES14-00544.1.
Tronstad, L. M., R. O. Hall Jr., T. M. Koel, and K. G. Gerow. 2010. Introduced lake trout produced a four-level trophic cascade in Yellowstone Lake. Transactions of the American Fisheries Society 139:1536–1550.
Wellborn, G. A. 1994. Size-biased predation and prey life histories: A comparative study of freshwater amphipod populations. Ecology 75:2104–2117.
About the authors
Oliver Wilmot and Lusha Tronstad are with the Wyoming Natural Diversity Database, University of Wyoming, Laramie. Robert O. Hall, Jr., is with the Department of Zoology and Physiology at the University of Wyoming. Todd Koel and Jeff Arnold are with the Native Fish Conservation Program, Center for Resources, Yellowstone National Park, Wyoming. Please direct correspondence to the Lusha Tronstad.
Download: PDF of this article
This article published
Online: 6 May 2016; In print: 25 March 2016
URL
https://www.nps.gov/ParkScience/articles/parkscience32_2_25-35_wilmot_et_al_3833.htm
Suggested citation
Wilmot, O., L. Tronstad, R. O. Hall Jr., T. Koel, and J. Arnold. 2016. R Lake trout–induced spatial variation in the benthic invertebrates of Yellowstone Lake. Park Science 32(2):25–35.
This page updated
5 May 2016
Site navigation
• Back to Volume 32, Number 2
• Back to Park Science home page
Part of a series of articles titled Yellowstone Science - Volume 25 Issue 1: Native Fish Conservation.
Last updated: March 21, 2021
