NPS
Why do we pursue the work we do?
National Park Service policy and federal legislation requires our division to conserve acoustic environments and keep them unimpaired for the enjoyment of future generations. Director's Order #47 specifically addresses soundscape preservation and noise management. Park visitors and wildlife interact with each other and park resources through their senses. The restoration of these resources creates many benefits, including healthy ecosystems and quality visitor experiences.
What metric is used to describe the sound level?
The L50 sound pressure level (dBA re 20μPa) is the metric used to calculate our sound maps. Sounds exceed this level half of the time. “A-weighting” is an adjustment that reflects how the human ear perceives sound. All conditions are predicted for a typical daytime hour during the summer with calm weather conditions. Sound levels are often lower at night and during the winter.
Field technicians make a second A-weighted, time-averaged sound level measurement (LAeq, 1s). They collect all of the summer daytime seconds recorded at a site, sort these values, and report the median value. For any given second at that site, there is a 50% chance that the sound level will be greater than or equal to the reported value. A-weighting is the commonly used method for combining sounds across the entire audio spectrum. It accounts for decreased sensitivity of human hearing at low (<1 kHz) and very high (>6 kHz) frequencies.
Decibels (dB) are measured on a logarithmic scale. A 3 dB increase corresponds to a doubling of sound energy, and a 10 dB increase corresponds to a tenfold increase in sound energy. Those pairings of numbers have another interpretation. A 3 dB increase in background sound levels will reduce the area from which you could previously have heard a natural sound by 50%. A 10 dB increase in background sound level decreases your "listening area" by 90%.
What are "existing" and "natural" conditions?
Audio gathered in parks reflect existing sound level conditions. The data reveal all sounds recorded from natural (e.g. wind, human voices) and non-natural (e.g. machines) sources. Geospatial sound models show this relationship. The models can also predict scenarios by adjusting known conditions in relationship with other variables. For example, by subtracting human sounds and leaving sources like wind, water, precipitation, animals, and geological events, we are able to create a “natural scenario” model that shows what the park would sound like in these other conditions.
Where are measurements made?
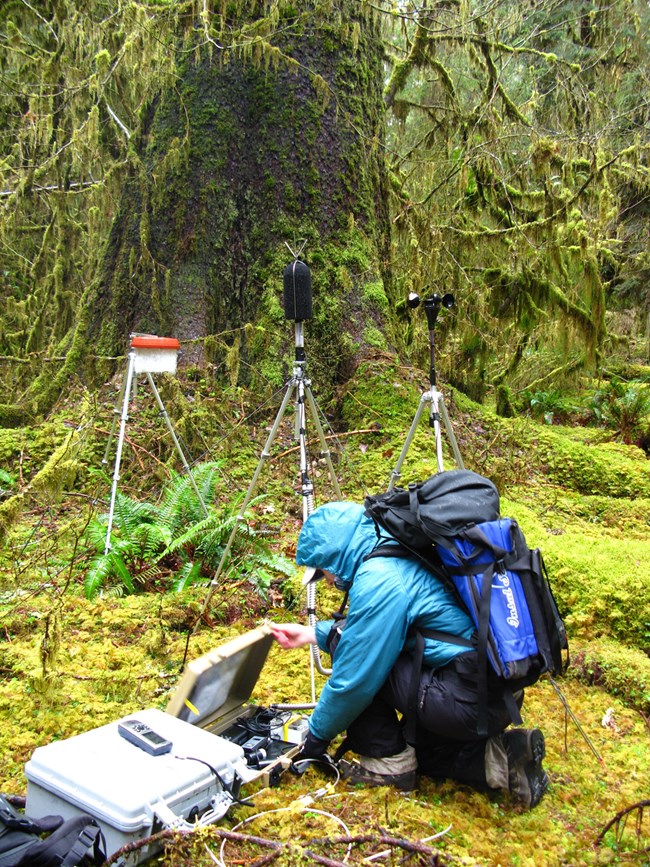
The sound map uses both audio measurements and geospatial data. NPS technicians measured sound levels in national parks across the country, with additional measurements from urban and suburban areas. Recordings are typically gathered for 25 days or more to capture a range of activity and weather conditions at each site. The model is based on 479 unique site locations. Some sites were sampled in more than one season, for a total of 966 observations. Overall, the map includes approximately 1,500,000 hours of sound data.
How accurate are the sound level maps?
In general, urban areas can be predicted more accurately than natural areas. This is because urban areas are dominated by human activity, whereas natural soundscapes are a complex mix of many sources, including human activity. Natural areas are also quieter, so sounds can be heard from much farther away. And natural soundscapes can encompass large areas.
Accuracy was rigorously evaluated using a "leave-one-out" cross validation. At half of the natural sites, levels are predicted within 3.1 dB. Urban sites are predicted within 1.7 dB (the median absolute deviation). Errors are larger at other sites. The most errors result due to the geospatial data being unable to factor powerful acoustic sources like nearby rivers and roads. For example, at one site in Olympic National Park, levels were much lower than expected because a nearby road was closed during the measurement period. The sound maps accurately describe the expected long term conditions in most places.
There are more places where we haven't sampled than where we have. Some of these sites likely have extreme sonic environments.
Are the data available?
The dataset is publicly available for download through the NPS Data Store. Available products include georeferenced raster data for the contiguous United States, Alaska, and Hawaii as well as explanatory data and related metadata.
Additional references
D. J. Mennitt and K. Fristrup, "Influential factors and spatiotemporal patterns of environmental sound levels," Proceedings of INTER-NOISE 2015 San Francisco, CA (2015). [PDF]
D. J. Mennitt, K. Fristrup, and K. Sherrill, "A geospatial model of ambient sound pressure levels in the contiguous United States," The Journal of the Acoustical Society of America, 135, pp. 2746-2764, 2014. http://dx.doi.org/10.1121/1.4870481
D. J. Mennitt, K. Fristrup, K. Sherrill, and L. Nelson, "Mapping sound pressure levels on continental scales using a geospatial sound model," Proceedings of INTER-NOISE 2013, Innsbruck, Austria (2013). [PDF]
D. J. Mennitt, K. Fristrup, and L. Nelson, "Mapping the extent of noise on a national scale using geospatial models," Presented at the 166th meeting of the Acoustical Society of America, San Francisco, USA (2013).
Last updated: December 26, 2024
