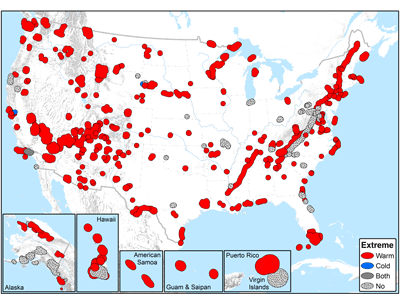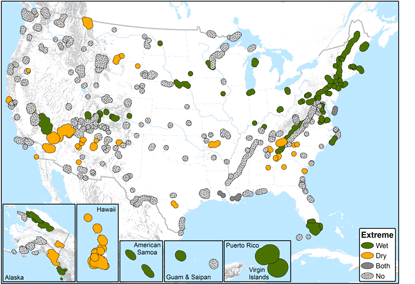
The study explored which parks experienced “extreme” recent conditions (past 10, 20, and 30 year intervals) relative to the 1901–2012 historical range of variability for seven temperature variables (annual mean, maximum of the warmest month, minimum of the coldest month, mean of the wettest quarter, mean of the driest quarter, mean of the warmest quarter, and mean of the coldest quarter) and seven precipitation variables (annual total, wettest month, driest month, wettest quarter, driest quarter, warmest quarter, coldest quarter). Parks were categorized as “extreme” for temperature or precipitation if the most recent 10, 20, and 30 year intervals, on average, exceeded 95% of the historical range of conditions for any of the seven associated climate variables. As an example, at Everglades National Park, annual mean temperature measured over the past 10, 20, and 30 year intervals has on average been warmer than 97% of all periods of equal length since 1901. Analyses for each park included areas within 30-km (18.6-mi) of the park’s boundary to evaluate recent climate changes in a landscape context.
Open the panel below to download individual briefs for each park in this project, or continue reading for study highlights.
Source: NPS DataStore Collection 5502. To search for additional information, visit the NPS DataStore.

Study highlights
Results for “extreme” temperature:- 235 of 289 parks (81%) were categorized as “extreme warm”, 2 parks (1%) as “extreme cold,” 1 park (<1%) was both “extreme warm and cold,” and 51 parks (17%) did not have any recent extreme temperature variables.
- The two most common extreme warm variables for parks were mean temperature of the warmest quarter (170 parks, 59%) and annual mean temperature (158 parks, 55%).
- 78 parks (27%) were “extreme wet,” 43 parks (15%) were “extreme dry," 2 parks (2%) were both “extreme wet and dry,” and 166 parks (57%) did not have any recent extreme precipitation variables.
- The most common extreme wet variables were annual precipitation (44 parks, 15%) and precipitation of the wettest quarter (44 parks, 15%), while the most common extreme dry variables were precipitation of the driest quarter (17 parks, 6%) and wettest quarter (16 parks, 6%).
The findings from this research can also inform climate change adaptation by helping park managers, planners, and interpreters to understand how recent climates compare to past conditions. For example, these findings may be used to characterize park exposure to recent climate change in a vulnerability assessment; develop plausible and divergent futures for use in a climate change scenario planning workshop; and synthesize desired future conditions (i.e., reference conditions) for use management plans.

Gonzalez et al. 2018
Disproportionate warming of the National Park System
A 2018 study demostrates the impact of human-caused climate change to parks. Since 1895, the U.S. National Park System has seen greater increases in heat and aridity than the country as a whole. This is because extensive areas of the National Park System are located in extreme environments in Alaska and the American West.
Continued carbon emissions will bring higher temperatures to the National Park System over the next century. But reducing emissions from cars, power plants, and other human sources can help. Doing so would reduce the projected temperature increases by one-third to one-half.
Last updated: January 13, 2025
