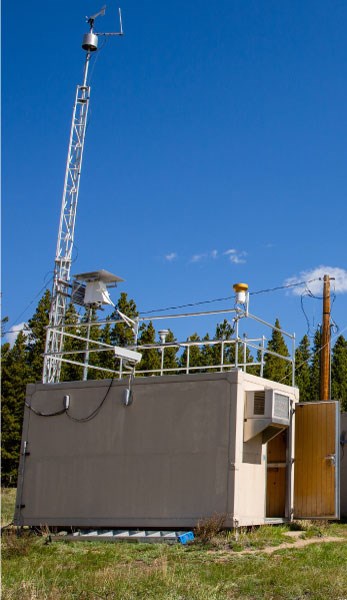
Ground-level ozone (O3) forms when volatile organic compounds (VOCs) react with nitrogen oxide emissions in the presence of sunlight. Ozone is harmful to humans when they breathe it in and to plants when they respire. Monitoring ozone concentrations in parks helps us to determine air quality trends, provide public health alerts, and assess compliance with national standards. It is federal law for the National Park Service (NPS) to protect air quality resources in parks.

Photo courtesy of Mackenize Reed
Who is monitoring and where?
Ozone monitoring data are collected in or near 102 national parks! NPS staff and partners operate the monitors in 36 of these locations. Across the United States ozone monitoring is conducted by the Environmental Protection Agency (EPA), states, and other agencies. These groups and the NPS contribute to a nation-wide ozone monitoring network by observing common standards and reporting requirements. EPA’s Clean Air Status and Trends Network (CASTNET) is largely responsible for site audits and data are reported to the EPA Air Quality System (AQS).
When selecting ozone monitoring locations the NPS considers:
- Air quality concerns
- Regional representation
- Data gaps
Several national parks also use ozone gardens to monitor the ecological effects of ozone on sensitive plant species.
How often do we measure?
Ozone data are collected continuously (1-minute averages) and reported in one-hour intervals. Because ozone is not stable, it must be measured onsite to accurately determine its concentration in the atmosphere. This also allows us to provide real-time ozone conditions to the public.
What equipment do we use and how does it work?
An ozone analyzer measures the real-time ozone concentration in the air. Ambient air is drawn through a sampler inlet from the top of a 10-meter tipping tower by a pump. A filter located at the top of the tipping tower removes particles like dust and pollen from the air sample to prevent them from reacting with ozone before it reaches the analyzer.
- Duration:
- 1 minute, 7 seconds
An air quality expert explains how we measure ozone concentrations in the air and use the data to assess air quality.
Once the air enters the ozone analyzer it splits into two paths. One path is the ambient air, pulled in directly from outside. This is the sample air that we will use to measure ozone concentration. The other path pulls ambient air through an ozone scrubber, which removes all of the ozone. This air is now ozone-free and is called the background air.
Ozone has a peak absorption at a wavelength of 254 nanometers (nm), which is in the ultraviolet (UV) light region of the electromagnetic spectrum (between visible light and x-rays). Light energy emitted at this wavelength is not able to pass through ozone. That is why ozone in the stratosphere protects the earth from the sun’s harmful UV radiation. Inside the ozone analyzer, the sample and background air are both exposed to UV light. The sample air and background air are alternately pumped through either cell A or cell B. Both cells have a sensor that measures the intensity of light that passes through the air.
- Duration:
- 26 seconds
Animation showing how an ozone monitor uses ultraviolet (UV) light to measure ozone concentrations in the air.
The ratio of the intensity of light detected between the background and sample air reveals the concentration of ozone in the air. This is because the amount of light absorbed is directly related to the concentration of ozone present in the sample (in chemistry, this is called the Beer-Lambert Law).
How are the data used?
Real time ozone data are important for providing health alerts to the public. The alerts help people make informed decisions about what to do when ozone levels are high. The data are also used for:
- Documenting ozone conditions in a park
- Determining ground-level ozone trends
- Assessing compliance with air quality standards
- For example by identifying parks with ozone exceedances
- Improving atmospheric modeling
- Informing emission reduction policies
Last updated: August 11, 2025
