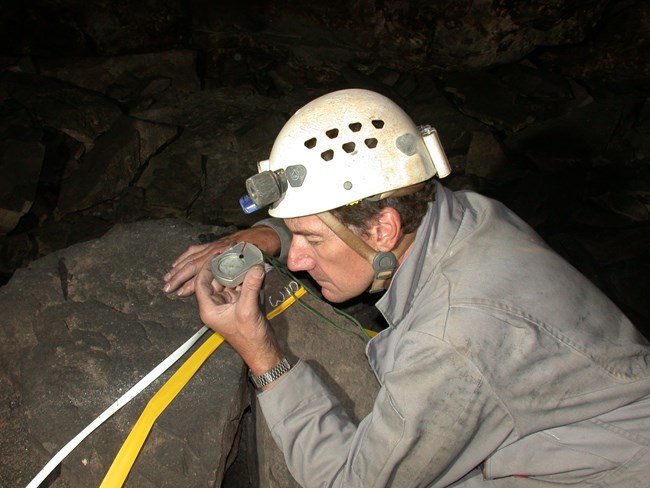
NPS Photo/ Rick Olson Caves are mysterious. New openings hide in the darkness under rockpiles or beyond narrow crevices. Naturally, we wonder where do all the passages lead? This is especially true in new, never before discovered, areas of Mammoth Cave. Each year, volunteers from the Cave Research Foundation come to the park to map newly discovered passages, to help us learn just how far it stretches. But how do they go about mapping the cave? Using Tools to Get the LayoutTo figure out how the passage lies underground, survey teams generally use
However, survey tape is only so long and lasers cannot bend around corners so survey data must be collected from station to station. A station is just a point in the passage where data is taken. When you link several of these stations, or points, together it looks something like playing connect the dots. 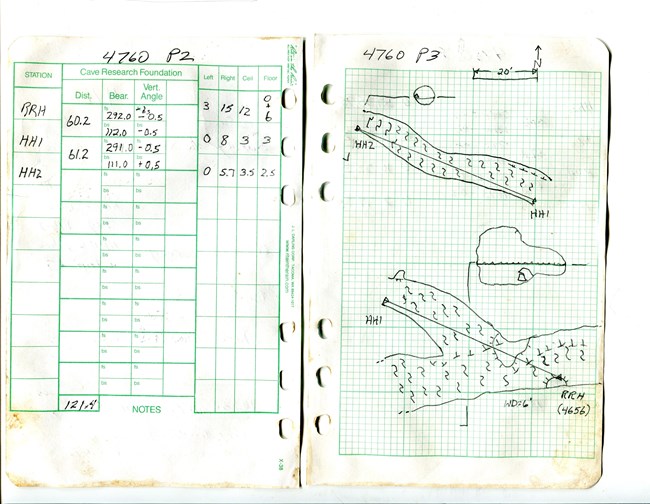
NPS Photo Passage DetailsSome passages are huge, and others are very small, so passage dimensions are measured at each station. Cave passages may have interesting features such as rock piles, cracks, artifacts or formations, so the surveyor sketches these features, along with the entire passage, to scale in the survey book along with measurments that are collected. Passage shapes also vary, so at almost every station a cross section of the cave is drawn. This shows what the cave looks like if you were standing in it, looking down the passage. In many cases, a running profile is also plotted on the sketch, that shows what the passage looks like when viewed from the side. 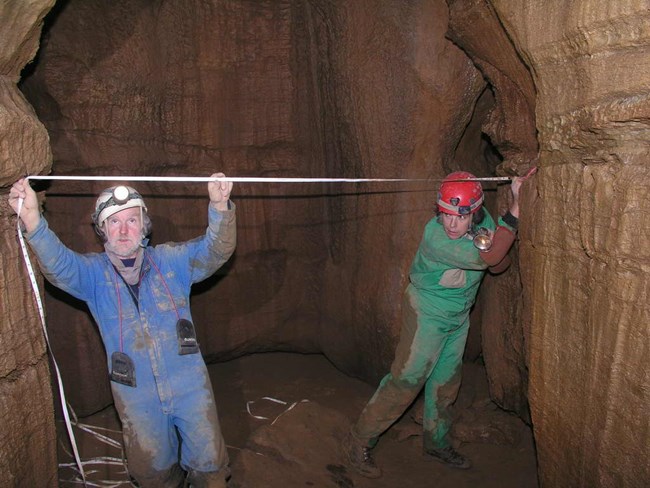
NPS Photo TeamworkThe process is a little complicated and takes practice, but working as a team helps to get the job done. Typically, one person sets stations, another reads instruments, and a third person keeps the survey book with the data and sketch information. Then, as a team, the group defines a segmented line, from station to station, and describes the cave around that line. 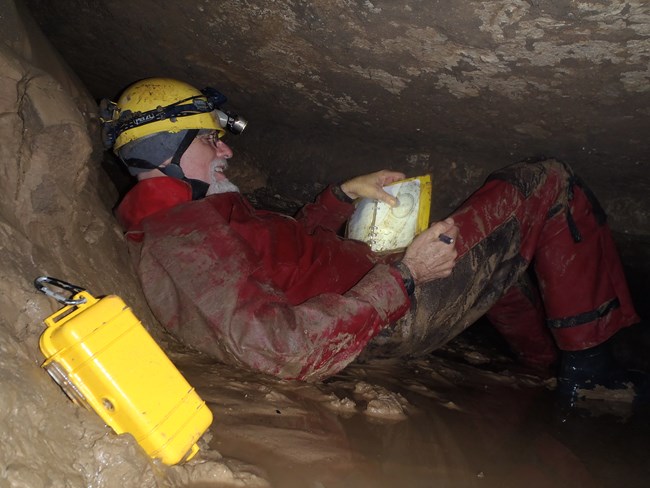
NPS Photo/ Mary Schubert Reading the DataAfter the survey data is gathered it is time to turn it into a cave map. Nowadays, people enter the data into a computer program that will automatically perform the math that ultimately determines a line plot for a cave. For instance, if you surveyed up or down a steep slope, the true horizontal distance would be quite a bit less than the measured distance. This difference must be corrected with trigonometry or else the map would have significant errors. Computers are helpful in making sure this process is done correctly. Compasses are magnetic and magnetic north is rarely the same as geographic north. Even worse, magnetic north drifts with time! This difference is called declination, and each compass must be checked before it is used so the computer can make corrections as needed. An example of this important factor is in mapping Floyd Collins Crystal Cave. In 1954, during the week-long expedition in the cave the declination was 2.2 degrees east of north. In 2021 it is 4.6 degrees west of north. So magnetic north has drifted 6.8 degrees over these 67 years. Think of what this would do to the map if it was not corrected! 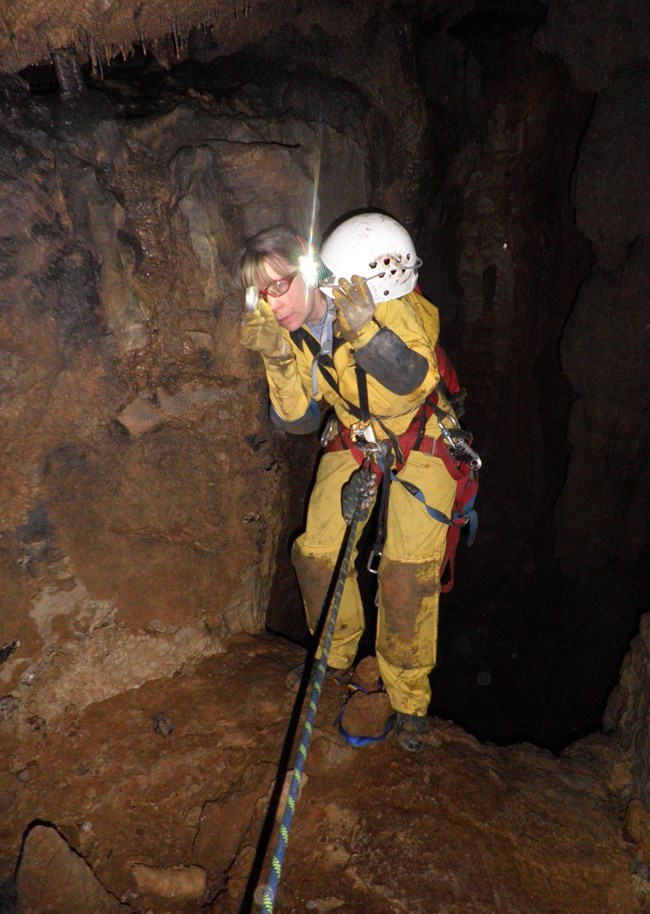
NPS Photo/ Rick Olson Checking the WorkTry as they might, surveyors still make mistakes, but steps in the surveying process are included to detect and correct errors. Utilizing survey loops are a big help in making sure the data is correct. Ideally, if a survey team circles back in the passage to where they started, then the end station would plot exactly on the same point as the first station. This is quite unusual, though, so the computer will divide up errors among the survey shots and correct the survey line to close up the loop. If there is a big discrepancy in the data, then those errors must be corrected by going back in the cave and reshooting the data where the faulty measurements were made. Making the MapOnce the survey data have been verified and an accurate line is plotted, then the surveyor can scan the sketches of the cave that were drawn to scale in the survey book, and electronically superimpose it over the line plot. They use an electronic pen on a graphics pad, using the sketch as a guide to draw the cave in plan view, which is how it would look from above if a person could magically see through all the rocks and dirt that sits over the top of the cave passage. Then drawings of cross sections and running profiles are added where they best fit on the map to show what the cave looks like from those perspectives. Finally, a scale bar, north arrow, date, names of those who worked on the map, and a legend of symbols are added to complete the map. 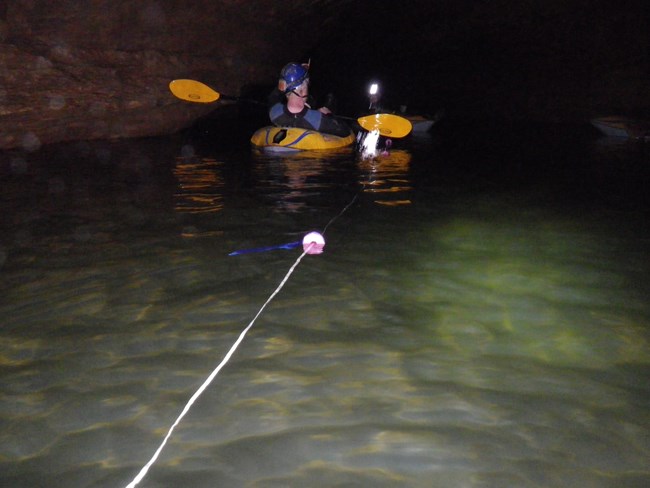
NPS Photo/ Mary Schubert The Importance of Cave MapsThere are two primary reasons why cave maps are needed: research and management. Mapping, or cartography, is really the first step in researching a cave. All subsequent data about a cave can be related to survey stations. It is important to know the location of where things are inside of a cave. By utilizing a cave map, we know exactly where a mineral, insect population, air current, or prehistoric artifacts are located, and therefore where future research efforts could take place. The maps also help us in the management of caves and the park. The National Park Service is tasked with managing park resources so they will remain unimpaired now and for future generations. Mapping the cave systems allows the park to see what parts of a cave might be vulnerable to a highway chemical spill, or where park trail improvement plans should use additional caution because of the location of historic artifacts. Similarly, knowing where caves lie helps us to manage projects that take place outside of the cave, too. For example: If we know where a cave with hibernating bats is located, then we can be careful to avoid excess smoke from prescribed fires that would disturb the bats from the activity. |
Last updated: March 31, 2023
