These warmer-than-average January temperatures are not in themselves unusual, what’s really odd is how long they’ve stuck around. Warm air advection events, sometimes called the ‘Pineapple Express’ or ‘Chinooks’, are not uncommon during Alaskan winters – but they usually only last a few days before a return to more normal and cooler temperatures.
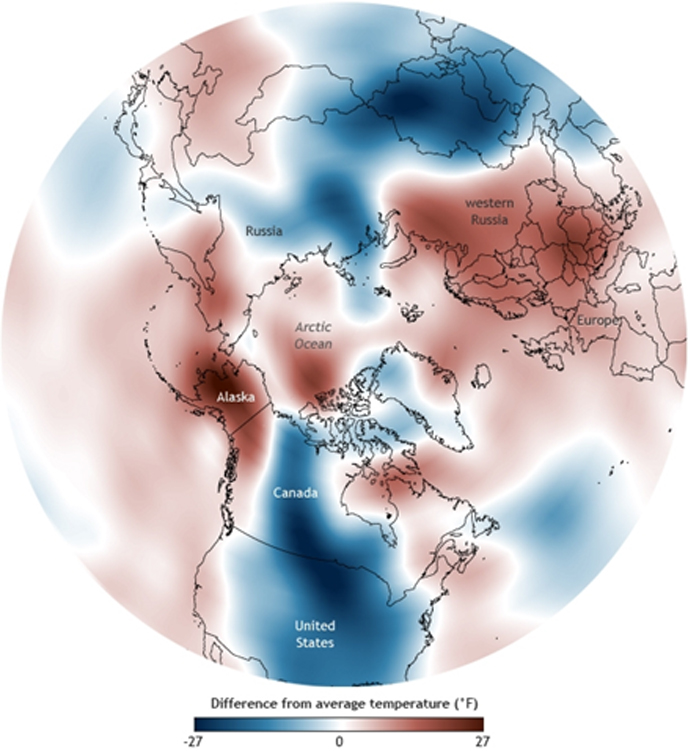
This map from climate.gov shows the differences in average air temperature across the northern hemisphere for early January. Temperatures far below average are dark blue; temperatures far above average are dark red (with average being defined as the 1981-2010 30-yr 'climate normal').
So, what’s to blame for these long-lasting contrasting temperature extremes? Tough to say, but climate researchers have been pointing the finger at undulations of the jet stream, and the much-hyped polar vortex.
If you live and work in south central Alaska, you might be interested in some local climate data for the past month (through Jan 23). The following climate plots are for long-term weather stations in south central Alaska. What they show are observed daily temperatures (red=daily high, blue=daily average, green=daily low), the range of ‘normal temperatures’ (grey area), and cumulative precipitation (dotted line), which has mostly been in the form of rain. The range of ‘normal temperatures’ represents long-term average high/low temperatures for the 30-year period 1981-2010.
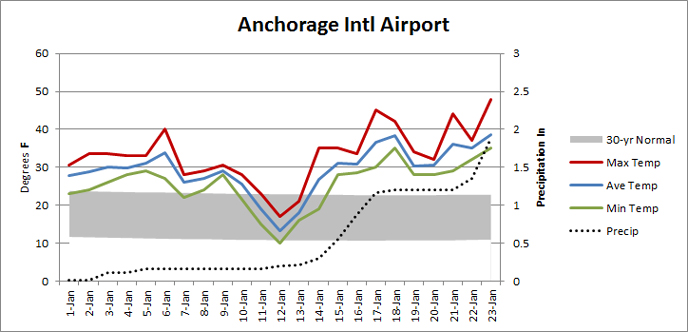
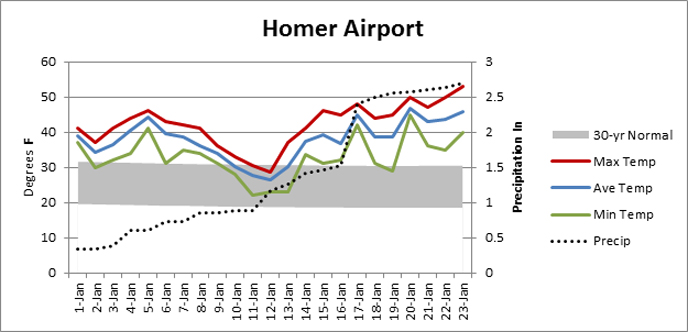
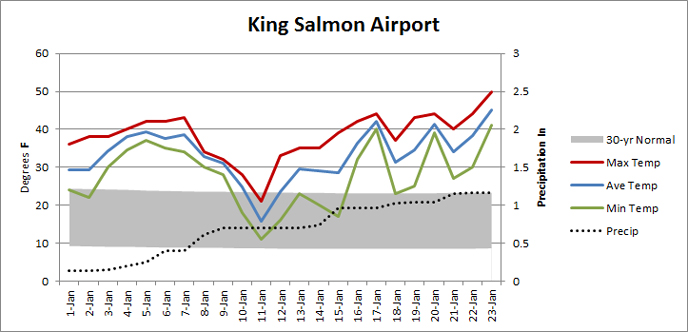
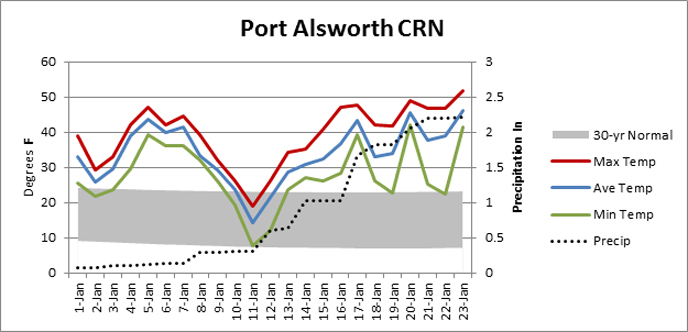
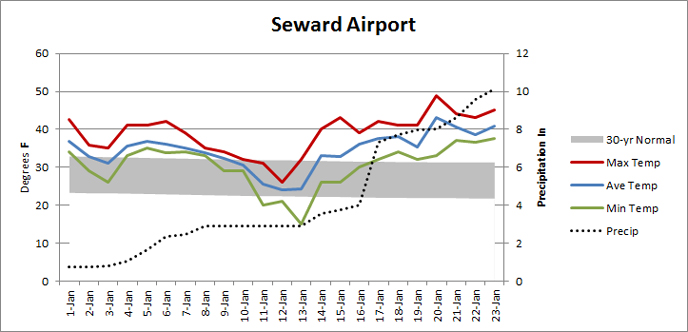
There are some interesting things to note in the plots above. The average daily temperatures in Anchorage was 12 degrees F above 'normal'. In Homer, it was 13 degrees F above 'normal', Port Alsworth recorded temperatures 18 F degrees above 'normal'. King Salmon almost matched that with temperatures 17 F degrees above 'normal'. Seward was 7 degrees F above 'normal'. Southwest and south central Alaska has also been experiencing really warm low temperatures that, on several days, were only a few degrees lower than the daily average temperature. Lots of precipitation has fallen (Seward has already gotten over 10 inches this month - 125% of normal), but unfortunately not much snow at low elevations.
Stay cool out there!

