The volume of monitoring data collected by network staff continues to increase each year. Often we can better communicate the content of these data sets through a visual display. Visualization tools help us see patterns, variations, or changes over time that may not be obvious when looking at rows of numbers and data tables.
The Upper Columbia Basin Network has been developing visualization tools in collaboration neighboring networks, partners, and also on a national scale. Below are three of them.

VegViz
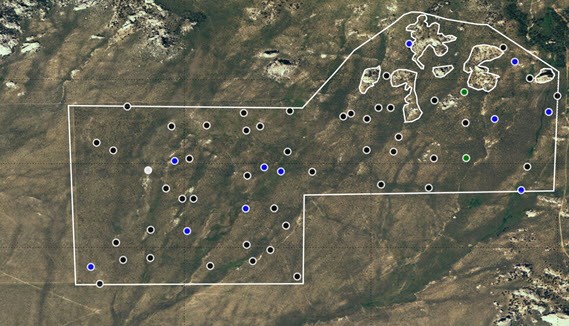
VegViz is a web portal for visualizing and exporting Sagebrush Steppe monitoring data across the Upper Columbia Basin and Greater Yellowstone networks. This is a multi-year project going into its third year of development. In addition to the networks, collaborators include the National Inventory & Monitoring office and Walking Shadow Ecology.
Aquarius
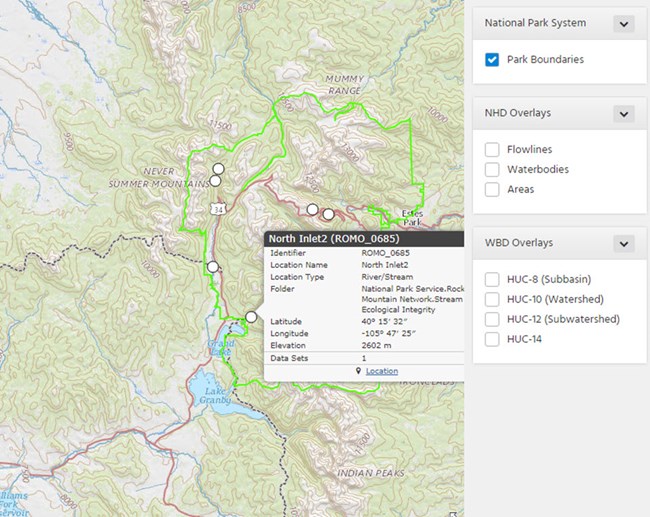
The Aquarius Integrated Water Quality Data Portal includes network water quality data across 13 monitoring sites in the Upper Columbia Basin Network. Data is available for graphical display and data download on the Natural Resource Stewardship and Science Aquarius web portal. UCBN continuous water quality data in Aquarius includes water temperature, pH, specific conductance, turbidity, and dissolved oxygen.
Climate Analyzer
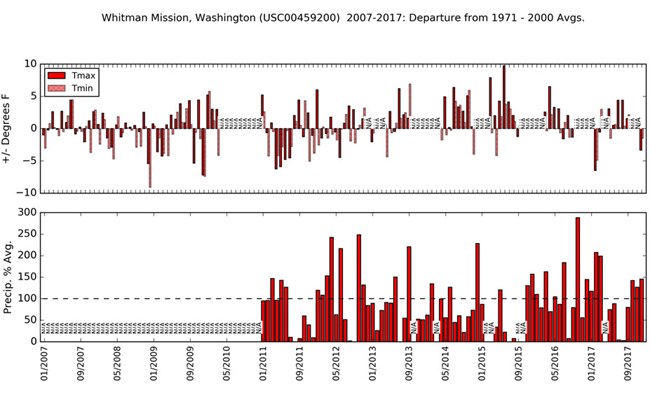
The Climate Analyzer data portal provides tools to access climate data across UCBN parks. Data sources available for display and analyses include data from the National Weather Service (COOP/GHCN data), NRCS Snow-Telemetry (SNOTEL), Remote Automated Weather Stations (RAWS), and Hydrological data from USGS stream and lake gages. Climate Analyzer has been developed by Walking Shadow Ecology, and is currently used by many I&M networks and parks.
Last updated: June 5, 2018
