Importance and Issues
Climate is a dominant factor driving the physical and ecologic processes affecting the Mid-Atlantic Network (MIDN). Climate variations are responsible for short- and long-term changes in ecosystem fluxes of energy and matter and have profound effects on underlying geomorphic and biogeochemical processes.
Individual storm events do occasionally impact and alter the structure of plant and animal communities in the MIDN. Future climate changes will likely cause migrations of plant and animal communities both northward and to higher elevations. Superimposed on this is a long history of human use in the region, with accompanying land-use patterns that have fragmented the original MIDN landscape of wetlands and upland forests and will influence the ability of the plant and animal communities of the MIDN to adapt to climate changes.
Monitoring Procedures and Reporting History
Weather and climate was formally identified as a MIDN vital sign in 2008 because of its influence on the ecology of Mid-Atlantic Network park units and the surrounding areas. A monitoring protocol was published in 2012.Publications prior to 2012 are similar to later reports but may differ slightly from formal protocol procedures. Publications from 2012 to 2018 include annual reports and resource briefs and follow published protocol methods. In 2019, implementation of the MIDN weather and climate protocol was suspended. Nevertheless, since that time MIDN has provided short annual weather summaries (resource briefs and web articles, see below) that rely on NOAA analyses derived from the NClimDiv dataset and NOAA's Climate-at-a-glance program.
Where We Monitor
- Appomattox Court House National Historical Park
- Booker T. Washington National Monument
- Eisenhower National Historic Site
- Fredericksburg & Spotsylvania National Military Park
- Gettysburg National Military Park
- Hopewell Furnace National Historic Site
- Petersburg National Battlefield Park
- Richmond National Battlefield
- Shenandoah National Park
- Valley Forge National Historical Park
Climate Change
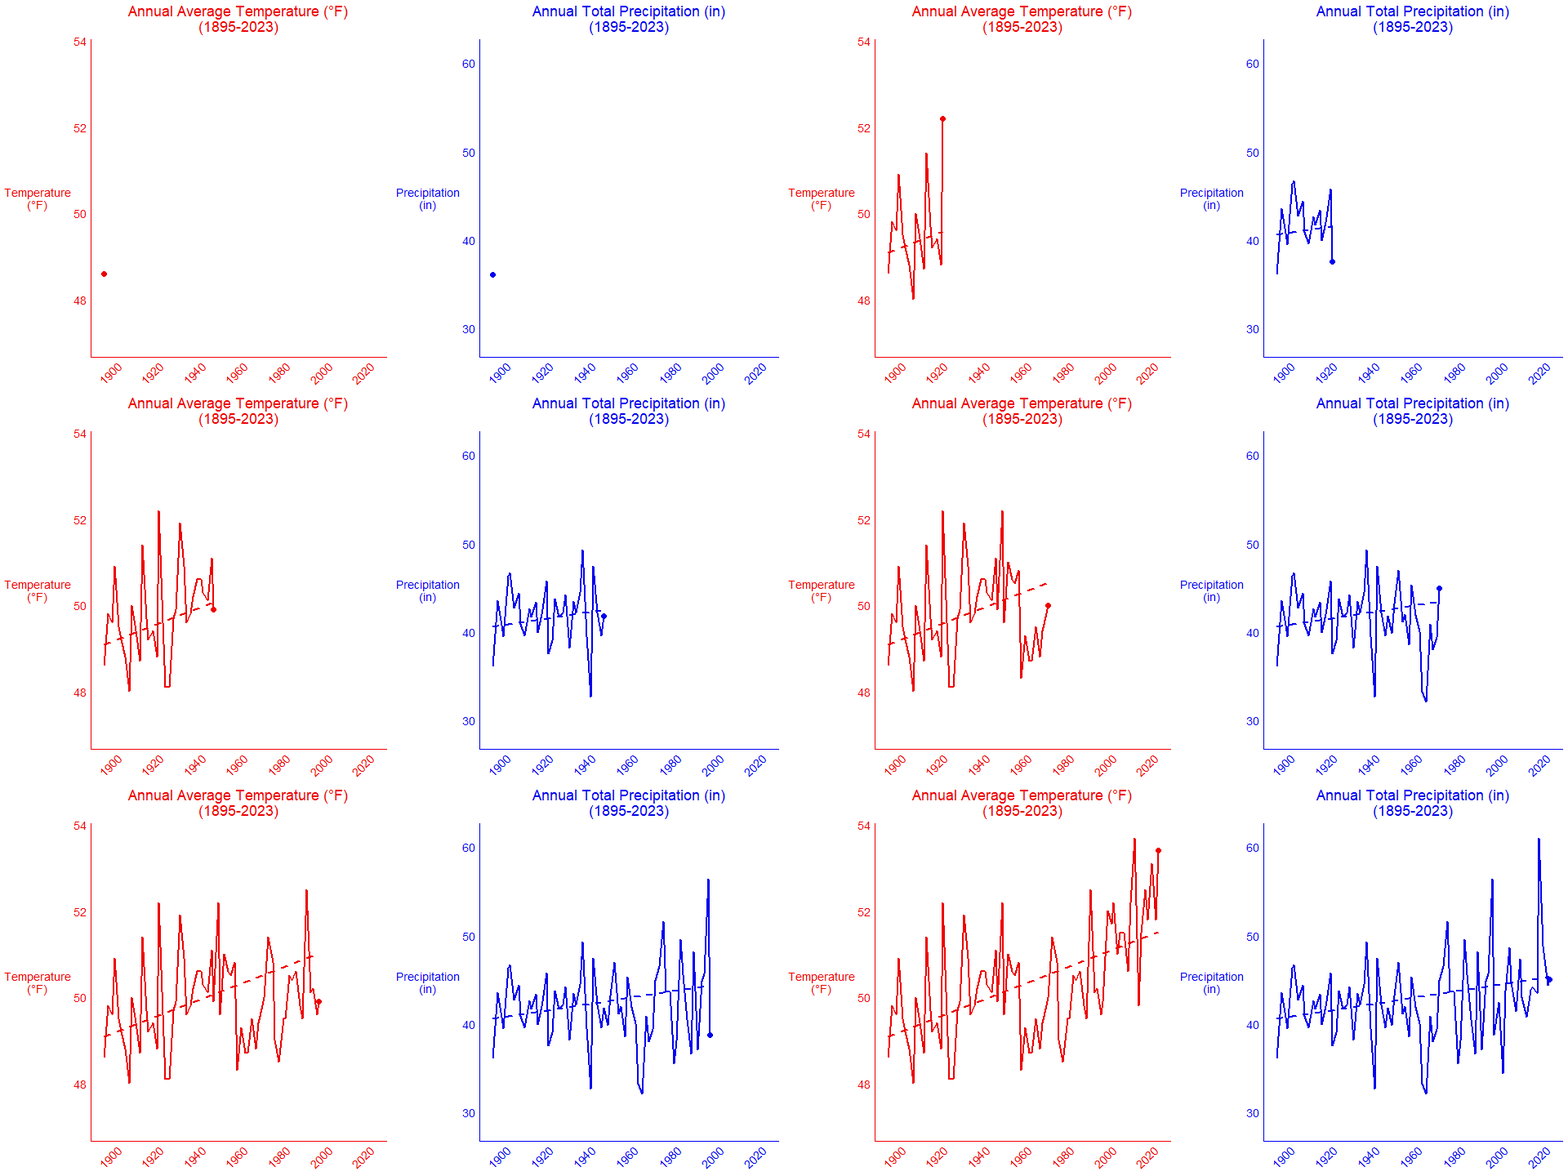
Data from 1895–2023 show that annual average temperature and annual total precipitation have increased across the Mid-Atlantic (Figure 1; Mid-Atlantic basin). Changes in climate can alter vegetation, animal migrations, and ecosystem processes in national parks. See the video below to understand how the National Park Service is preparing for climate change across the Northeast.
- Duration:
- 6 minutes, 54 seconds
National Parks protect amazing places and organisms for all Americans. As climate changes, learn how Inventory & Monitoring helps parks track its effects on populations of Shenandoah salamander, life in the rocky intertidal zone, and brook trout in freshwater streams.
Summaries of historical weather conditions in MIDN parks
Monitoring Documents
Resource briefs are short PDFs summarizing our monitoring programs or results.
Source: NPS DataStore Saved Search 693. To search for additional information, visit the NPS DataStore.
Periodically, we publish reports that describe what we are learning in the field. These monitoring reports are more in-depth than resource briefs and include data analysis and a discussion of our findings.
Source: NPS DataStore Saved Search 692. To search for additional information, visit the NPS DataStore.
Protocols describe how we monitor. They include a descriptive narrative of what we monitor and why, our field methods, how we analyze and manage our data, and more. All of our protocols are peer reviewed.
Source: NPS DataStore Saved Search 710. To search for additional information, visit the NPS DataStore.
For More Information
Contact Mid-Atlantic Network Biologist, Jeb WoffordLast updated: January 22, 2024
