Photo by Bob Carr
Overview
Great Smoky Mountains National Park encompasses over 2,000 square kilometers (772 square miles) divided almost equally between North Carolina and Tennessee, and is one of the largest fully-protected areas in the eastern United States. Elevations in the park range from about 300 meters (984 feet) to over 2,000 meters (over 6,500 feet), and include several of the highest peaks in eastern North America. World renowned for its diversity of plant and animal life, the beauty of its ancient mountains, and the quality of its remnants of Southern Appalachian mountain culture, this is America's most visited national park. It has been recognized as both an International Biosphere Reserve and a World Heritage Site.
The park’s resources are affected by strong natural ecological events and processes such as precipitation, temperature, and vegetation succession (the growth of plant communities over time), and natural disturbances such as fire. However the park is also subject to human impacts caused by acidification, introduction of invasive species, loss and fragmentation of habitats, and possible climatic changes. The park has had a long-term ecological monitoring program since the early 1990s. A wealth of scientific information has been gained since then, which allows for evaulation of the park's current status.
The original Great Smoky Mountains NP monitoring program was developed in the early 1990s. When the Service-wide Inventory and Monitoring program initiated development of 32 networks across the nation in 2002, the park was included in the Appalachian Highlands Network. Although part of the Appalachian Highlands Network, Great Smoky Mountains NP is a prototype Inventory and Monitoring park and operates its program out of the park's base funding. For more information about I&M in Great Smoky Mountains National Park, contact Tom Remaley, I&M Program Manager.
Vital Signs Monitoring
In 2013, Great Smoky Mountains National Park I&M division completed the conceptual plan for vital signs monitoring. Six vital signs were chosen to be the core focus of monitoring efforts: Acid Deposition, Vegetation Communities, Soil Quality, Water Chemistry, Freshwater Communities, and Climate Change. For more information, see the Conceptual Plan for Vital Signs Monitoring - Great Smoky Mountains National Park.

NPS photo
Acid Deposition
The park air-quality section operates one of the most comprehensive air quality monitoring programs in the US, including monitoring ozone and trace gases, deposition, visibility, particle pollution, and meteorology. Air quality data is collected and summarized annually from seven established air monitoring stations in the park.
The goal of air-quality monitoring is to track the status and trends of air quality, and its effect on:
-
Water- and land-based natural resources (both plants and wildlife)
-
Water quality in park streams
-
Progress towards ecological restoration
Park I&M staff use several scientific methods to track air quality in the park, including:
- Collecting weekly wet (including precipitation) and dry chemistry and deposition samples
- Creating park-wide GIS models of nitrogen and sulfur deposition
- Updating and re-evaluating park-wide acid deposition models to incorporate changing climate, landscape features, and deposition rates
For more information on air quality in Great Smoky Mountains National Park (and other parks) visit the Air Quality in Parks datastore collection or the NPS Air Quality in Parks website.

NPS photo
Long-term Vegetation Monitoring
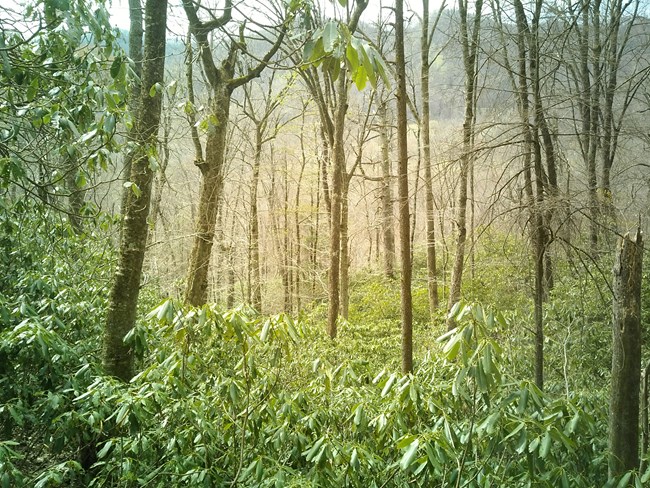
Great Smoky Mountains National Park is internationally renowned as a center of biological diversity within North America. Elevations in the park range from 850 to over 6,000 feet; a change in elevation that mimics the climate and habitat variations found from Georgia to Maine. Plants and animals common in the southern US thrive in the lowlands. Species common in the northern states find suitable habitats at the higher elevations. The crest of the Great Smokies runs in an unbroken chain of peaks for over 36 miles. The park's abundant rainfall and high summertime humidity provide excellent growing conditions. These factors combine to provide habitat to over 1,300 native species.
The goal of long-term vegetation monitoring is to:
-
Determine park-wide statuses and trends of forest, shrubland, grassland, and herbaceous communities to determine how they are changing with regards to habitat size and shape.
-
Determine how these communities are changing with regard to abundance, productivity, and composition.
-
See how changes in these vegetation communities are linked to other vital signs such as climate change, acid deposition, soil quality, water chemistry, freshwater communities, and to other natural resources.
For more information on the monitoring protocols, data, and standard operating procesures, please see the Great Smoky Mountains Long-term Plot Vegetation Monitoring project.

NPS photo / Wendy Wright
Soil-Quality Monitoring
Soils in Great Smoky Mountains National Park are highly weathered compared with many other regions of the eastern United States. Weathering is the process by which soils are broken down over time by weather, acid deposition, erosion, and other physical and chemical factors. The geologic formations in the park are predominately sandstone with some areas of exposed slate and a few small areas underlain by limestone formations. The types of underlying geology affect how soils weather over time, which can affect other natural resources.
The goal of soil-quality monitoring is to:
-
Determine park-wide statuses and trends in the physical and chemical characteristics of soil
-
Determine to what extent changes in soil quality are linked to changes in other vital signs, such as climate change, acid deposition, vegetation communities, water chemistry, and freshwater communities, and to other natural resources
- Determine trends in soil physical and chemical characteristics in areas with episodic or exotic species disturbances (e.g., Fraser fir, hemlock, and beech forests, wildland fire sites, exotic earthworm infestation sites)
Soil-quality monitoring is performed by collecting soil samples from all permanent vegetation monitoring plots (where appropriate).
Source: NPS DataStore Collection 537. To search for additional information, visit the NPS DataStore.

NPS photo / Wendy Wright

Photo by Bob Carr
Water Chemistry
Great Smoky Mountains National Park contains over 3,300 kilometers (2,051 miles) of streams, almost all of which originate within the boundaries of the park. There are 45 major watersheds (greater than 5 square kilometers [1,235 acres]) encompassing these streams, as well as hundreds of riverine, forest/shrub, and emergent wetlands, and ponds. The park is unique because it has almost no direct adverse water-quality impacts coming from human development or siltation upriver, as is often the case in other parks across the country where headwaters are outside the park. Five park streams are recognized as pristine by the Tennessee Department of Environment and Conservation and designated as Outstanding Natural Resource Waters.
The goal of water chemistry monitoring is to determine:
-
Park-wide status and trends of water quality and water chemistry
-
How water quality/chemistry changes are linked to changes in other vital signs, such as climate change, acid deposition, vegetation communities, soil quality and freshwater communities
Source: NPS DataStore Collection 901. To search for additional information, visit the NPS DataStore.

NPS photo
Freshwater Communities
In addition to streams, other aquatic resources within the park include small wetlands, ponds, springs, seeps, cave pools, and two large reservoirs along the southern and western park boundary. Aquatic communities within these habitats are diverse, and include fish, insects, algae, mollusks, crustaceans, and amphibians.
The goal of freshwater community monitoring is to determine:
-
Park-wide status and trends of macroinvertebrate and fish communities
-
To what extent changes in other vital signs, such as acid deposition, vegetation communities, soil quality, water chemistry, and climate changes affect freshwater communities
-
How freshwater communities (including algae, amphibians, and aquatic vascular plants) are impacted by site-specific biological threats, such as non-native fish, chytrid fungus, Ranavirus, and Didymosphenia
Freshwater communities are monitored by:
-
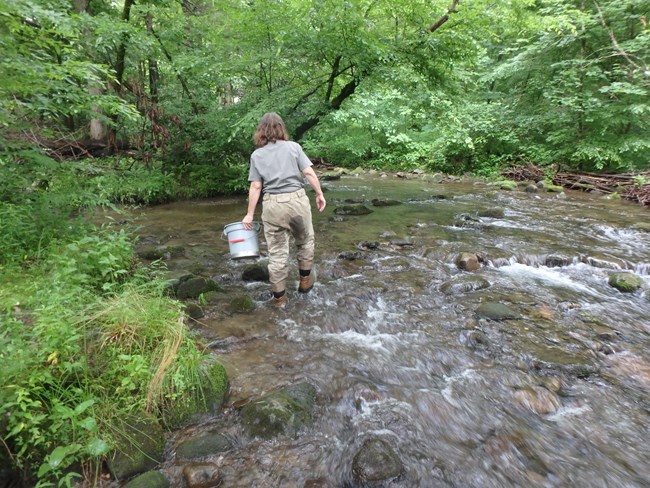
Collecting benthic macroinvertebrates (small animals that live in aquatic habitats), monitoring their abundance, and evaluating how tolerant they are to pollution and changes in water quality indicate the overall stream health over time.
-
Measuring the species richness, condition, distribution and relative abundance of native and non-native fish species at permanent aquatic monitoring sites. Fish data are analyzed using the Index of Biotic Integrity (IBI) method. The number, type and quality of species at these sampling locations gives an indication of stream health over time.
-
Other sampling sites will provide distribution data and will inform managers of species composition changes. In select headwater brook trout monitoring sites, depletion estimates will be used in order to evaluate long-term trends and detect composition and species assemblage changes in relation to historic data.
Source: NPS DataStore Collection 897. To search for additional information, visit the NPS DataStore.
Source: NPS DataStore Collection 855. To search for additional information, visit the NPS DataStore.
Climate Changes
The climate has always changed naturally, in annual, decadal and much longer cycles. These cycles are driven by a complex set of factors. Climate operates as a strong driver in every ecosystem in the park. It drives general patterns of species composition and distribution and also affects ecosystems at various geographic scales.
The goal of climate change monitoring is to determine:
-
Park-wide trends of climate, as indicated by changes in temperature, precipitation, winds, humidity, solar energy input, and phenology of species
-
How measured trends compare to historical regional and in-park averages and trends
-
How changes in climate metrics correlate with disturbance regimes, forest productivity, carbon storage and cycles, special status resources, and biodiversity
The park uses many methods to monitor climate change in the park:
-
The park maintains several stations that collect climate data. Currently, five historic National Weather Service climate stations, two NPS remote fire weather stations, seven NPS air quality sites, and 11 flood warning precipitation gauges exist in the park.
-
Remote sensors are used at selected permanent monitoring plots. Small, remotely deployed recording instruments (e.g., HOBO, iButton) are inexpensive and have been used in the park to efficiently collect air, water and soil temperature, soil moisture, and relative humidity.
-
The park is currently developing a model for park-wide precipitation. National Weather Service Doppler radar will soon have upgraded capabilities. These upgrades will allow improved typing of precipitation, better estimation of amounts, and better performance in mountainous areas.
-
Permanent plots are established in several natural areas near cooperator, partner, and park-staffed facilities to permit regular monitoring during targeted phenological windows. Within plots, several attributes for each of the targeted species are measured, including vernalization and first reproduction benchmarks, peak reproduction dates, and cessation of growth/occurrence, as appropriate.
-
Currently, remote sensing from regular satellite passes can measure and model many aspects of vegetation growth in 250 meter (820 feet) pixels. An evaluation of different satellite-based methods will be undertaken to select the best method for the park.
-
Park-wide temperature modeling will be continued and compared with plot and satellite data.
-
Park-wide phenological changes (how plant and animal life are affected by things such as seasonal variation, climate variation and elevation) will be estimated by comparing plot data with park-wide, regional, and global phenological remote sensing and climatic data.
-
The park will utilize remote sensing data, using appropriate imagery/sensors and seasons, to detect landscape changes. In addition to satellite phenology measurements, periodic remote sensing will measure changes in several categories of disturbance related to climate change: wind-damaged forest canopy, landslides, detection of forest insect and disease occurrences, defoliation/mortality areas, and conversion of natural areas outside the park boundary. Depending on the type of sensors chosen, forest productivity and snow pack may eventually be assessed using satellite or other remote sensing platforms. Results from the park’s wind, precipitation, temperature, and other climate data will be evaluated for their ability to explain the changes documented.
Great Smoky Mountains National Park Species Lists
Select a Park:
Select a Species Category (optional):
Visit NPSpecies for more comprehensive information and advanced search capability. Have a suggestion or comment on this list? Let us know.
Last updated: August 30, 2018
