Last updated: April 15, 2025
Article
Understanding Fire Danger
This article is part of the Wildland Fire Learning In Depth series. It is designed for anyone who want to learn more about wildland fire.
Fire danger is a description of the combination of both constant and variable factors that affect the initiation, spread, and ease of controlling a wildfire on an area.
Many systems and schemes attempt to provide accurate and reliable predictions of fire danger; analyze the fuel, topography, and weather; and integrate their effects into a set of numbers that fire managers can use to meet their needs.
National Fire Danger Rating System
Managers use the National Fire Danger Rating System (NFDRS) to input data and to receive information used to determine fire danger in their area. Based on the fire danger, managers may impose restrictions or closures to public lands, plan for or pre-position staff and equipment to fight new fires, and make decisions whether to suppress or allow fires to burn under prescribed conditions.

NPS
Since 1974, five rating levels have been used to describe danger levels in public information releases and fire prevention signing:
Low (Green)—Fire starts are unlikely. Weather and fuel conditions will lead to slow fire spread, low intensity, and relatively easy control with light mop up. Controlled burns can usually be executed with reasonable safety.
Moderate (Blue)—Some wildfires may be expected. Expect moderate flame length and rate of spread. Control is usually not difficult and light to moderate mop up can be expected. Although controlled burning can be done without creating a hazard, routine caution should be taken.
High (Yellow)—Wildfires are likely. Fires in heavy, continuous fuel, such as mature grassland, weed fields, and forest litter, will be difficult to control under windy conditions. Control through direct attack may be difficult but possible, and mop up will be required. Outdoor burning should be restricted to early morning and late evening hours.
Very High (Orange)—Fires start easily from all causes and may spread faster than suppression resources can travel. Flame lengths will be long with high intensity, making control very difficult. Both suppression and mop up will require an extended and very thorough effort. Outdoor burning is not recommended.
Extreme (Red)—Fires will start and spread rapidly. Every fire start has the potential to become large. Expect extreme, erratic fire behavior. NO OUTDOOR BURNING SHOULD TAKE PLACE IN AREAS WITH EXTREME FIRE DANGER.
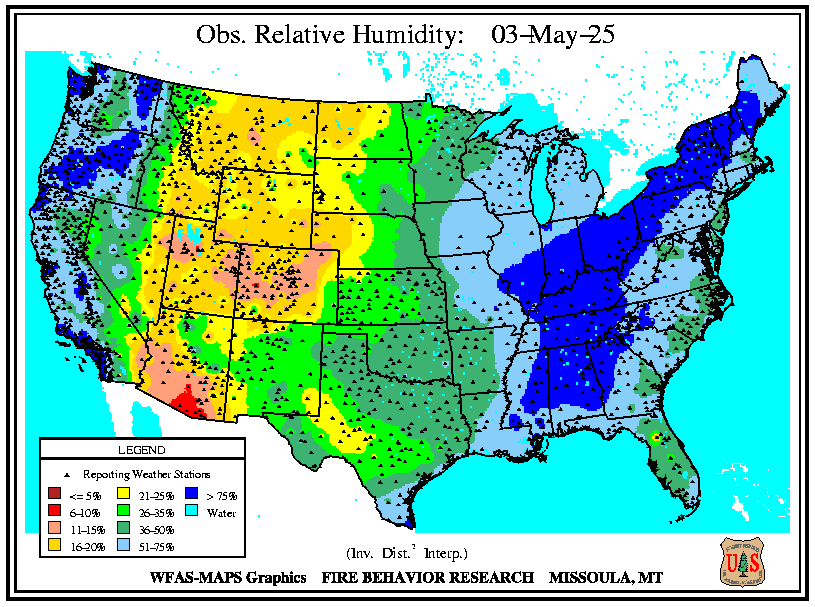
Relative Humidity
Relative humidity (RH) is the ratio of the amount of moisture in the air to the amount of moisture necessary to saturate the air at the same temperature and pressure. Relative humidity is expressed in percent. RH is measured directly by automated weather stations or manually by wet and dry bulb readings taken with a psychrometer and applying the National Weather Service psychrometric tables applicable to the elevations where the reading were taken.
Relative humidity is important because dead forest fuels and the air are always exchanging moisture. Low humidity takes moisture from the fuels, and fuels in turn, take moisture from the air when the humidity is high. Light fuels, such as grass and pine needles, gain and lose moisture quickly with changes in relative humidity. When the RH drops, fire behavior increases because these fine fuels become drier. Heavy fuels, on the other hand, respond to humidity changes more slowly. To see significant changes in heavy fuel moisture, there must be significant moisture, usually from more than a single storm.
Fuel Moisture
Fuel moisture is measured for live herbaceous (annual and perennial) and woody (shrubs, branches, and foliage) fuels and dry (dead) fuels. These are calculated values representing approximate moisture content of the fuel. Fuel moisture in live fuels varies through the growing season and between different climate classes. There are 20 different fuel models, representing the variety of vegetation in the area, that a manager can use when calculating fire danger.
Dead fuel moisture is the moisture content of dead organic fuels, expressed as a percentage of the oven-dry weight of the sample. Dead fuel moisture is controlled solely by exposure to environmental conditions and is critical in determining fire potential. Dead fuel moistures are classed by timelag. A fuel’s timelag is the time necessary for a fuel particle of a particular size to reach 63% of equilibrium between its initial moisture content and its current environment.
Dead fuels in NFDRS have four time lag classes:
- 1 hour—Fine flashy fuels, dried herbaceous plants or round wood less than 1/4" diameter. Also includes the uppermost layer of litter on the forest floor. Responds quickly to weather changes. Moisture in these fuels varies greatly throughout the calendar day and is principally responsible for diurnal changes in fire danger. It is computed from observation, time, temperature, humidity and cloudiness.
- 10 hour—Round wood 3/4" to 1" diameterand the layer of litter that extends to 3" to 4" below the surface. Moisture in these fuels is computed from observation, time, temperature, humidity, and cloudiness, or may be a standard set of "10-Hr Fuel Sticks" that are weighed as part of the fire weather observation.
- 100 hour—1" to 3" diameter.Moisture in these fuels is computed from 24 hour average boundary condition composed of day length, hours of rain, and daily temperature and humidity ranges.
- 1000 hour—3" to 6" diameter.Moisture in these fuels is computed from a 7-day average boundary condition composed of day length, hours of rain, and daily temperature and humidity ranges.
Live Fuel Moisture
Live fuel moisture is the water content of live herbaceous plants expressed as a percentage of the oven-dry weight of the plant. Typical herbaceous fuel moisture values start low and increase rapidly as the growing season progresses. Lower values indicate drier materials and higher fire danger. View the Fuel Moisture Database
Fire Weather Maps
View fire weather maps on the WFAS website.
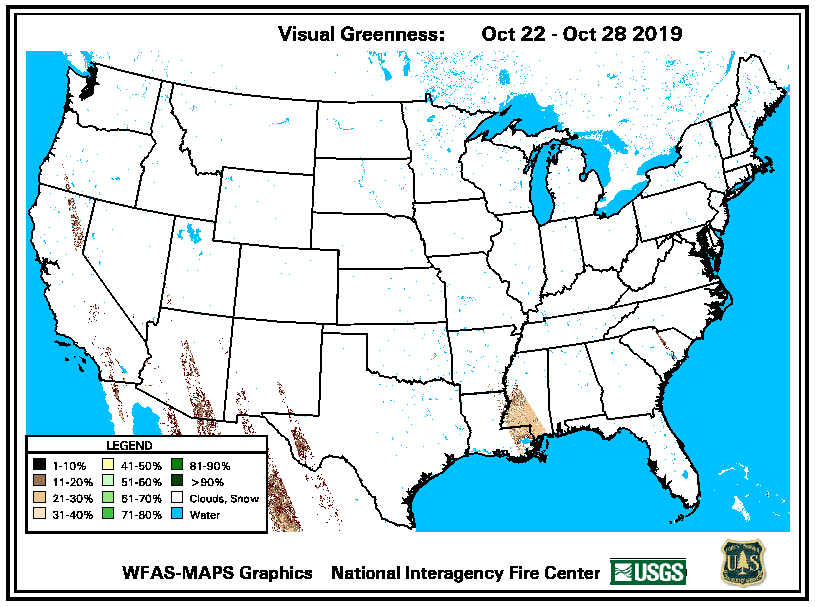
Greenness Maps
Greenness maps provide a visual representation of live fuel moisture. Four vegetation greenness maps are derived weekly from Normalized Difference Vegetation Index (NDVI) data observed by satellites and provided by the Earth Sciences Observation and Science (EROS) Data Center, U.S. Geological Survey.
These maps have a 1-kilometer (.6 mile) spatial resolution. Maps with historical references (RG and DA) are based on the years 1989 through 1995. The derived maps are:
- Visual Greenness Maps—portray vegetation greenness compared to a very green reference such as an alfalfa field or a golf course. The resulting image is similar to what you would expect to see from the air. Normally dry areas will never show as green as normally wetter areas.
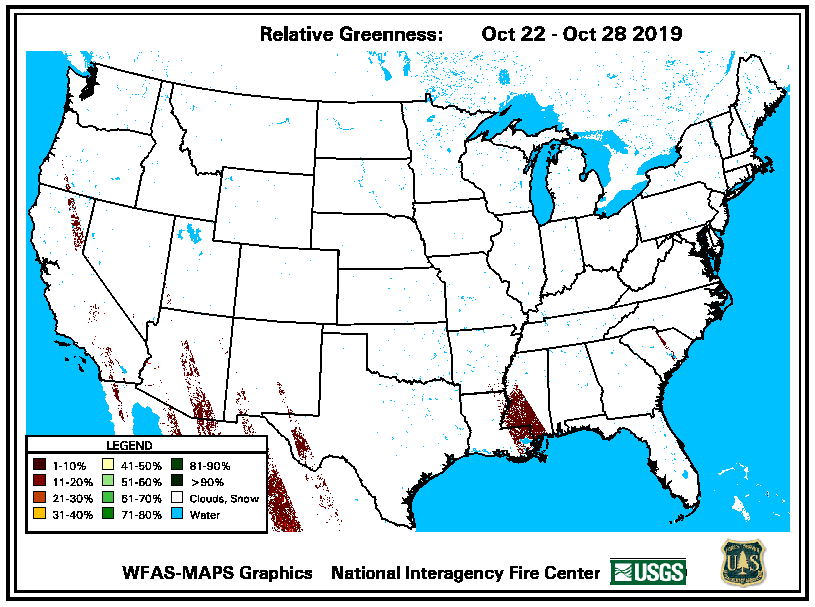
- Relative Greenness Maps—portray how green the vegetation is compared to how green it has been historically (since 1989). Because each pixel is normalized to its own historical range, all areas (dry to wet) can appear fully green at some time during the growing season.
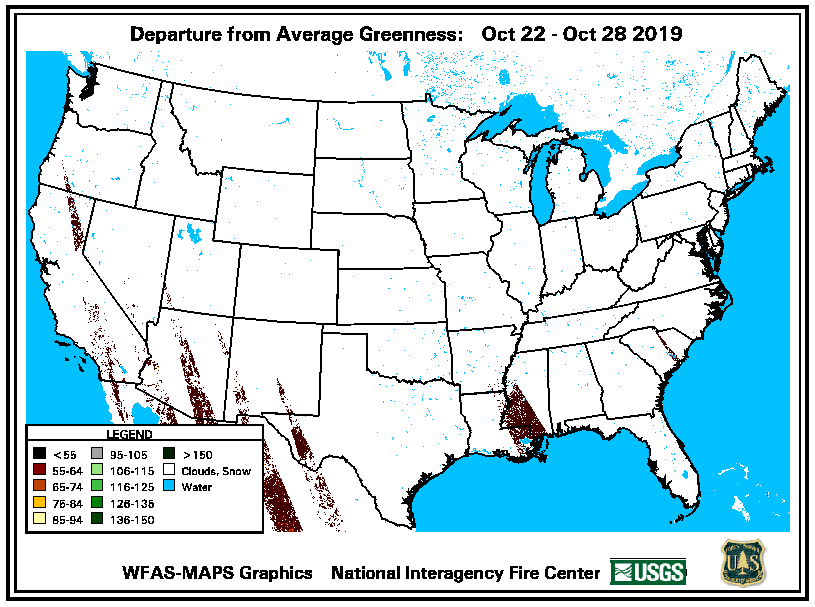
- Departure from Average Greenness Maps—portray how green each pixel is compared to its average greenness for the current week of the year.
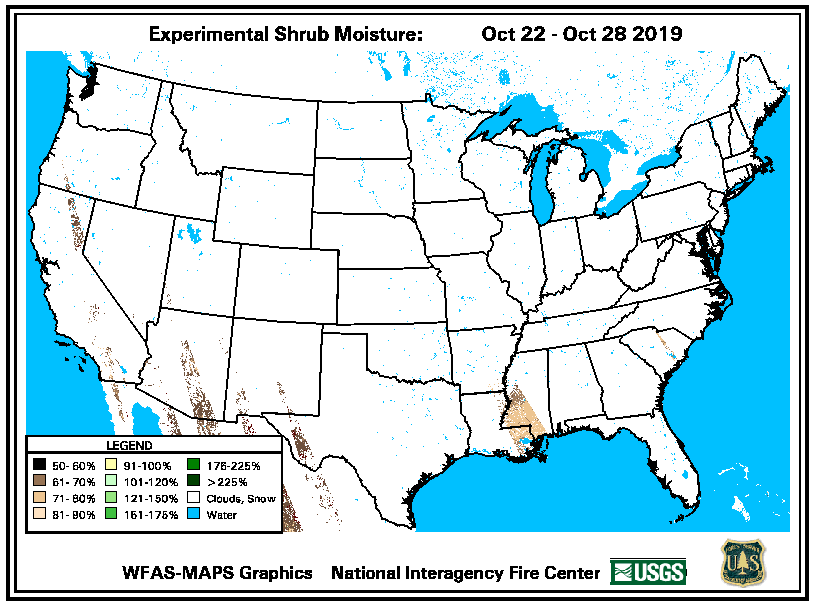
- Live Moisture Maps—portray experimental live vegetation moisture with values ranging from 50 to 250 percent of dry weight.
Drought Maps
Keetch-Byram Drought Index (KBDI)—This can be used to measure the effects of seasonal drought on fire potential. The actual numeric value of the index is an estimate of the amount of precipitation (in 100ths of inches) needed to bring soil back to saturation (a value of 0 being saturated). The index deals with the top 8 inches of soil profile so the maximum KBDI value is 800 (8 inches), the amount of precipitation needed to bring the soil back to saturation. The index’s relationship to fire is that as the index values increase, the vegetation is subjected to greater stress because of moisture deficiency. At higher values living plants die and become fuel, and the duff/litter layer becomes more susceptible to fire.
KBDI = 0–200—Soil moisture and large class fuel moistures are high and do not contribute much to fire intensity. This is typical of spring dormant season following winter precipitation.
KBDI = 200–400—Typical of late spring, early growing season. Lower litter and duff layers are drying and beginning to contribute to fire intensity.
KBDI = 400–600—Typical of late summer, early fall. Lower litter and duff layers actively contribute to fire intensity and will burn actively.
KBDI = 600–800—Often associated with more severe drought with increased wildfire occurrence. Intense, deep burning fires with significant downwind spotting can be expected. Live fuels can also be expected to burn actively at these levels.
Lightning Ignition Efficiency
Lightning fires are started by strikes to ground that have a component called a continuing current. All positive discharges have a continuing current, and about 20% of negative discharges have one. Ignition depends on the duration of the current and the kind of fuel the lightning hits. Ignitions in fuels with long- and medium-length needles, such as ponderosa pine and lodgepole pine, depend on fuel moisture. Ignitions in short-needled species, such as Douglas fir, depend far more on the depth of the duff layer than on the moisture. Spread of the fire after ignition usually depends on fuel moisture.
In all cases the ignition efficiency on a 1-km pixel is given on a per discharge basis. That is, if the efficiency is high, then about nine discharges will result in one ignition; if the efficiency is extreme, about five or fewer discharges will result in an ignition. The ratio of positive and negative discharges is built into the calculation. Latham and Schleiter (1989) documented the algorithm. The fuel type and depth are conversions of the 1-km-resolution current cover type (Hardy and others, 1999) for this specific calculation. The moisture input is the 100-hr dead fuel moisture above.
Energy Release Component (ERC)
The Energy Release Component is defined as the potential available energy per square foot of flaming fire at the head of the fire and is expressed in units of British Thermal Units (BTU) per square foot. Like the Spread Component, the Energy Release Component is calculated using tables unique to each fuel model. The rate of combustion is almost totally dependent on the same fuel properties as are considered in the SC calculation. However, the principal difference in the calculation of the two components is that SC is determined primarily by the finer fuels, whereas ERC calculations require moisture inputs for the entire fuel complex, i.e., 1-hr. , 10-hr. , 100-hr. , 1000-hr. , and the live fuel moisture.
Class Day
Class day describes the potential for wildland fires. For example, the Georgia Forestry Commission uses Table 3 as the determination percentile for all the class day. Since the Burning Index (BI) is fuel model dependent, different BI determination points are arrived.
Ignition Component (IC)
The Ignition Component is a number that relates the probability that a fire will result if a firebrand is introduced into a fine fuel complex. The ignition component can range from 0 when conditions are cool and damp, to 100 on days when the weather is dry and windy. Theoretically, on a day when the ignition component registers a 60 approximately 60% of all firebrands that come into contact with wildland fuels will require suppression action.
- A firebrand must come into contact with the dead fuel,
- the fuel particle must be dry, and
- the temperature of the fuel particle must be raised to the kindling point which is about 380 degrees Celsius.
Living material in the fine fuel complex reduces the efficiency of ignition. Therefore, an adjustment to the ignition component is made based on the percentage of live fuel (herbaceous vegetation) in the fine fuel complex.
The moisture content of the dead component of the fine fuel (1-hr. timelag fuel moisture) is determined by the state of the weather (sunny or cloudy), air temperature, and relative humidity at the time of the 2 p.m. fire weather observation.
The condition of the herbaceous (live) vegetation and the 1-hour time lag fuel moisture are then integrated in the calculation the fine fuel moisture (FFM) which expresses the effective moisture content of the fine fuels.
The closer the initial temperature of the fuel is to the ignition temperature, the more likely a fire will result when a firebrand is introduced into the fine fuel complex, since not a much energy is required to raise the fuel particle to its ignition temperature.
Spread Component (SC)
The Spread Component is a numerical value derived from a mathematical model that integrates the effects of wind and slope with fuel bed and fuel particle properties to compute the forward rate of spread at the head of the fire. Output is in units of feet per minute. A Spread Component of 31 indicates a worst-case, forward rate of spread of approximately 31 feet per minute. The inputs required in to calculate the SC are wind speed, slope, fine fuel moisture (including the effects of green herbaceous plants), and the moisture content of the foliage and twigs of living, woody plants. Since the characteristics through which the fire is burning are so basic in determining the forward rate of spread of the fire front, a unique SC table is required for each fuel type.