Part of a series of articles titled Yellowstone Science - Volume 27 Issue 1: Vital Signs - Monitoring Yellowstone's Ecosystem Health.
Article
Patterns of Primary Production & Ecological Drought in Yellowstone
NPS Photo - N. HERBERT
Patterns of Primary Production & Ecological Drought in Yellowstone
by David P. Thoma, Seth M. Munson, Ann W. Rodman, Roy Renkin, Heidi M. Anderson, & Stefanie D. Wacker
Photosynthesis converts sunlight into stored energy in millions of leaves, flowers, and seeds that maintain the web of life in Yellowstone. This transformation of energy fixes carbon, supplies organic matter to soils, and creates fuel for wildfire. As the first link of the food chain, new plant biomass is called primary production and provides energy to consumers, including wildlife. While Yellowstone is a mountain environment with deep winter snowpack, the park can get very dry in some years as evidenced by massive wildfires in 1988 and 2016. Droughts like these not only contribute to fire potential, but they affect primary production and the food chain and likely will play an increasingly important role in transforming vegetation structure and composition in the future. Meteorological, agricultural, and hydrological drought have been assessed quantitatively for many years, but key indicators of drought in wildland ecosystems have not been formally defined until recently (Crausbay et al. 2017). One promising new method to do this is by measuring how vegetation responds negatively to drought, and positively to favorable conditions that offset drought impacts. The balance of drought stress and growth has important implications for future vegetation condition as the climate of Yellowstone changes.
Monitoring primary production and predicting future vegetation changes are needed to provide a comprehensive view of park health and anticipate future ecosystem changes (Crabtree et al. 2009, Nemani et al. 2009). Although an important indicator of ecosystem condition, primary production can be time and resource-intensive to monitor in wildland settings using traditional ground-based methods such as clipping and weighing vegetation biomass. Fortunately, ground-based methods can be complemented and enhanced by monitoring primary production with satellite imagery. Measurements of solar radiation reflectance in visible and near infra-red wavelengths can indicate primary production at frequent intervals from the Moderate Resolution Imaging Spectrometer (MODIS) on satellites operated by National Aeronautics and Space Administration (NASA). The Greater Yellowstone Inventory and Monitoring Network (GRYN) staff uses this information to track changes in primary production across Yellowstone over time. They link these measurements to vegetation types, soils, and climate to understand where and when changes in production have occurred and may occur in the future.
Habitats as Targets for Monitoring
Plants are finely tuned to Yellowstone’s climate and soils, and it’s these adaptations that enable persistence under stressful conditions. In the absence of disturbance, when all four photosynthetic ingredients (sunshine, carbon dioxide, soil nutrients and water) are abundant, plants grow relatively quickly at their full potential to capture and store energy. However if any of these ingredients are limited, growth slows and can stop entirely if limitations become severe. Plants also adapt to other selective factors including competition, predation, and disturbance such as fire. The response of plant populations to their resources and other growth limitations characterizes the niche where they survive. The resulting assemblage of plants form communities or habitats that support insects, mammals and birds that in turn selectively use these habitats to meet their needs (Garroutte et al. 2016, Phillips et al.). Habitats integrate physical and biological aspects of the environment, occur in repeating patterns, and often form relatively large patches across the landscape that can be monitored by sensors on satellites.
What Limits Primary Production?
Generally sunshine and carbon dioxide are plentiful in Yellowstone, but there is a prominent pattern of soil nutrients linked to bedrock geology and soil type. Lodgepole pine and associated understory species are adapted to sandy, rocky, and low fertility soils found on the rhyolite plateaus. Subalpine fir, Douglas-fir and Englemann spruce are found on more fertile soils with greater water holding capacity (Rodman et al. 1996). In satellite-based monitoring, we can account for these variations by sampling pixel values from habitat units that have similar soil nutrient and water holding capacity. By accounting for vegetation composition and soil properties, and assuming that sunlight and CO2 are rarely growth limiting factors, we are left with climate and disturbance as the two most important factors that affect primary production in Yellowstone. Disturbances like beetle kill and wildfire in forests are inextricably linked to climate and in some non-forested areas production is also influenced by grazing animals (Frank et al. 2002, Despain 1990).
Disturbance of any kind affects primary production and is considered an important change agent acting with climate to affect primary production.
Satellite Monitoring 101
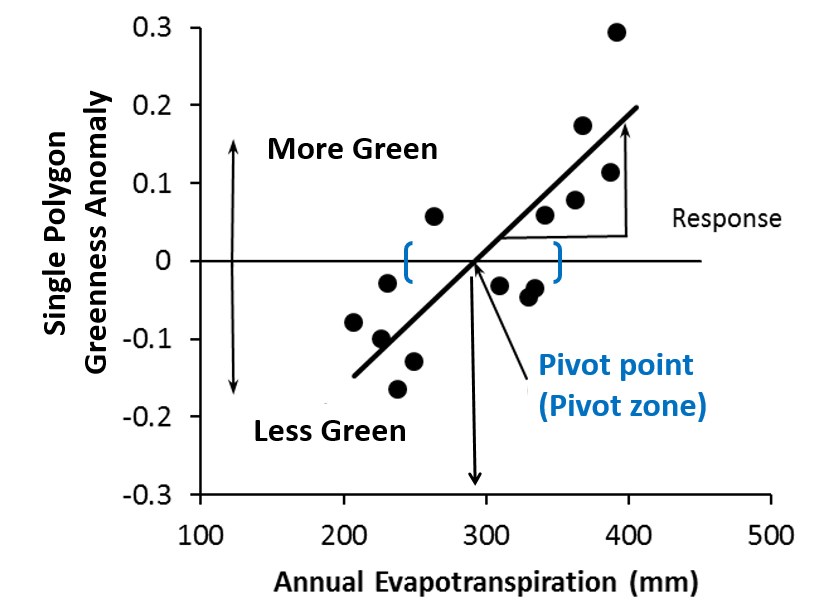
We measured vegetation greenness using the normalized difference vegetation index (NDVI) which is calculated from reflectance in red and near infrared wavelengths measured by the moderate resolution imaging spectroradiometer on the Terra satellite. In each habitat we summed monthly NDVI values across each year from 2000 to 2016 to develop a proxy for annual primary production in each year. We then calculated the annual anomaly or difference above or below average for each year. These fluctuations in annual production were compared against plant water use and plant water need calculated from a water balance model. Evapotranspiration is water used by plants plus a small amount of soil evaporation. Deficit is a measure of drought stress, or unmet water need. By relating primary production to water balance, we calculated two important ecological factors that describe sensitivity to climate and the water balance requirements for different habitats. First, the rate of growth indicates the vegetation sensitivity to evapotranspiration and deficit. It tells us how much primary production changes with variation in water use and need. Second, the average condition in each habitat determines its position along a moisture gradient. We call this a climate pivot point, where vegetation production teeters above and below average (figure 1). Together, sensitivity and pivot points indicate where climate is suitable for each habitat type and what aspects of climate are most likely to cause change at that location. In other words, these factors determine where and when vegetation performs well or experiences stress. Sustained or extreme water balance conditions beyond a pivot point may result in a transition to new vegetation type (Munson 2013).
What Did We Learn?
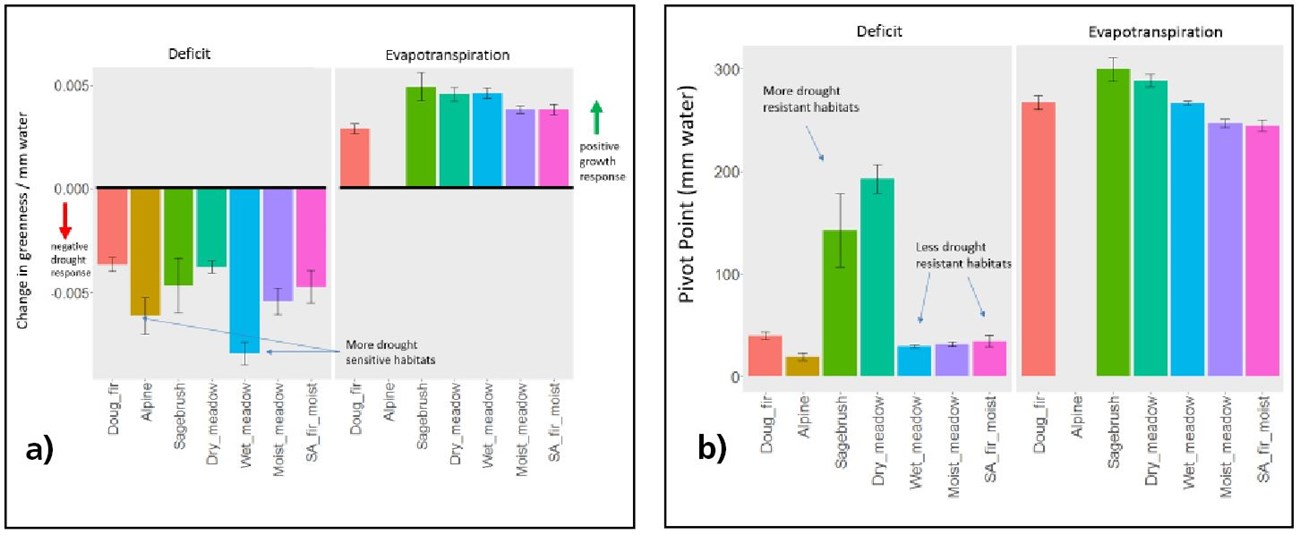
We found important differences in sensitivity to water deficit that varied by habitat (figure 2a). In particular, wet meadows and alpine habitats were among the most responsive to water deficit, strongly decreasing in greenness as drought stress increased. Conversely, sagebrush, dry meadow, and wet meadow were the habitats most responsive to evapotranspiration in the positive direction.
Habitats differed in their production potential and were distributed in predictable ways along moisture gradients. That is, dry meadows and sagebrush habitats were located in the driest parts of the park where deficit pivot points were higher indicating they were more drought resistant (figure 2b). These drier habitats also had higher evapotranspiration pivot points, meaning they used more water to maintain above average production. Wet meadows, moist meadows, and moist subalpine fir maintained productivity at lower evapotranspiration values.
Opposites React
Collectively our findings show that wetter habitats respond most strongly to dry years. For example, wet meadows and alpine areas are typically wet during the growing season so they don’t respond positively to more water. However, when drought stress increases even a little, they suffer greatly. In other words, they react most strongly to the condition opposite of the condition to which they are adapted. Vegetation accustomed to dry conditions responded positively to wet conditions, but this sensitivity was not as dramatic as the negative response of wet habitats to dry conditions.Tradeoffs
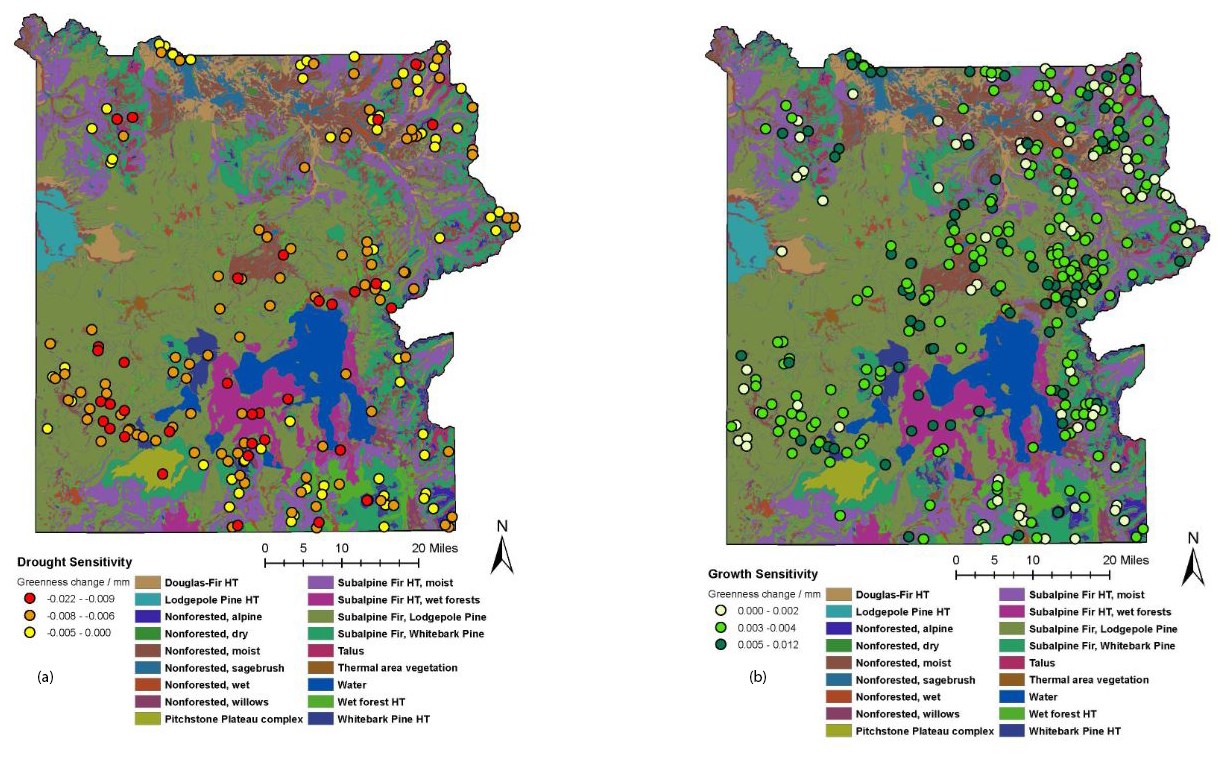
Our finding that habitat sensitivity differs along a moisture gradient is explained by a cost-benefit or tradeoff that allows vegetation to survive (Noy-Meir 1973, Munson 2013). Plant traits associated with drought resistance are balanced against the benefits of rapid growth. In dry environments plant adaptations like small leaves and more roots help resist drought, whereas species with larger leaves and more above ground leaves can’t survive. In wet environments leafy vegetation is adapted to grow robustly, which crowds out competitors that grow more slowly. Thus plant traits result in a tradeoff between resistance to drought and strong response to good growing conditions. Generally plant traits are adapted to resist drought or respond strongly to water, which results in differentiation among habitat types and provides an indication of why some habitat types are more sensitive to drought than others. At landscape scales, satellite observations help identify habitats that show sensitivity to drought which may be experiencing stress or warrant attention or additional monitoring to confirm if the cause of change is related to climate, disturbance, or both (figure 3).Ecological & Management Relevance
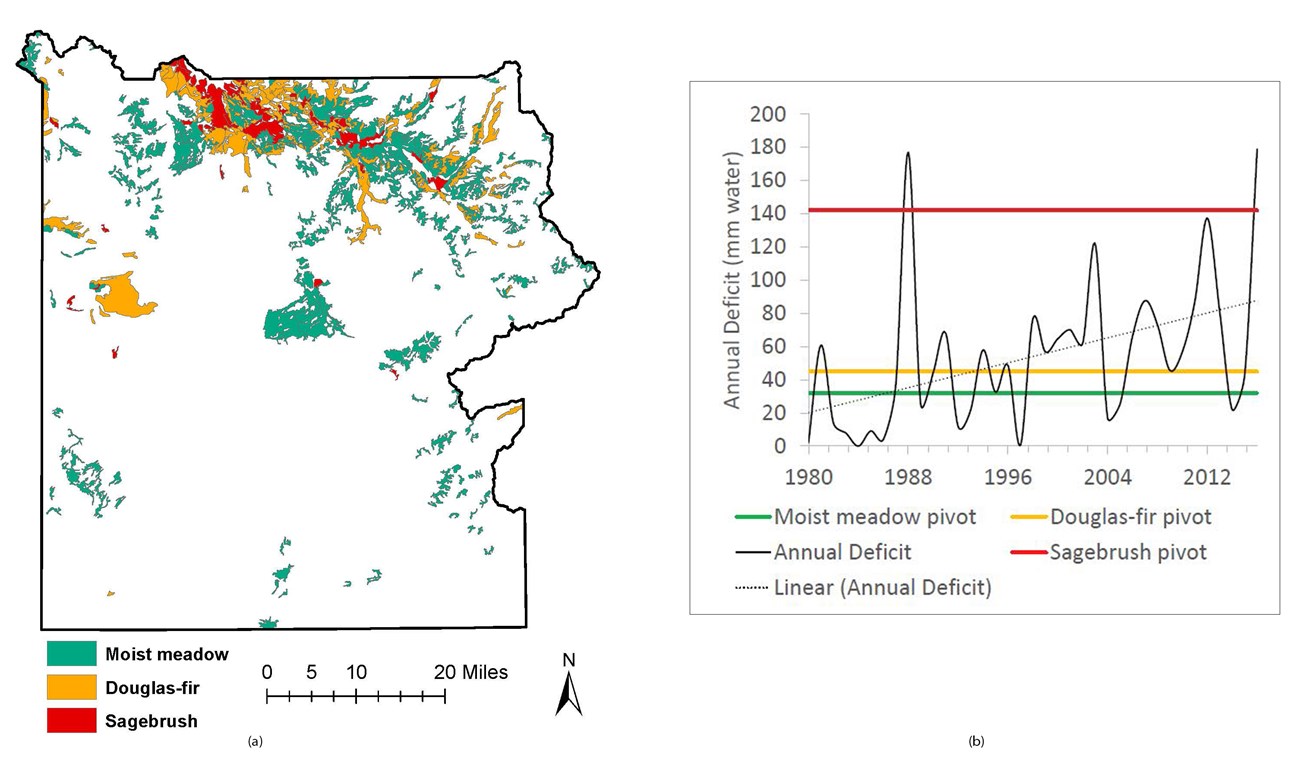
The relevance of these findings lies in our ability to identify where and when habitats may become susceptible to drought and climate change anywhere in the park. This can help determine where and when to look more carefully for evidence of change and perhaps determine ways to mitigate undesirable change. Not all change is undesirable, and not all change will be caused by climate. For instance, areas experiencing an invasion of non-native species like cheatgrass could also experience additional drought induced stress and be high priority areas for management action.As a practical example, we consider three habitat types that are common in the Tower Junction area that demonstrate how vegetation traits interacting with similar climate may result in very different localized stress responses (figure 4a). On the northern range moist meadows, Douglas-fir and sagebrush habitats are common and experience similar temperature and precipitation patterns. However, the topographic and soil properties where they grow are quite different. Moist meadows occur in fine textured soils, Douglas-fir grow on north aspects, and sagebrush grow in well drained soils on flats or south facing hill sides (Rodman et al. 1996). The interactions between vegetation traits, climate, and site position can result in a different drought stress experience for each habitat (figure 4b). At Tower Junction, annual water deficit has increased by approximately 2.4 inches (60 mm) since 1980. Annual deficit exceeded sagebrush pivot points only two times since 1980, notably in 1988 and 2016, which were so dry they were also extreme wildfire years. However since 1980, annual deficit exceeded the Douglas-fir and moist meadow pivot points 20 and 24 times, respectively. Because vegetation is adapted to handle interannual variation in water availability (within limits) it can recover from drought stress in successive years when growing conditions improve, but persistent stress above deficit pivot points will eventually result in loss of production that includes down-turns in energy and nutrient cycling that will affect animals dependent on these habitats (Garroute et al. 2016). The relationship between positive responses to evapotranspiration and negative responses to deficit during our study indicated a small net positive response in sagebrush and Douglas-fir and a stronger net negative response in moist meadows. This suggests a careful look at species composition and cover in these habitats may be warranted to understand if our observations from space are an early warning indicator of change on the ground.
Conclusions
The changes expected due to climate change will play out from the plant availability of water and photosynthetic potential in leaves, to landscape-scale primary production. We need to understand how plant and landscape-scale changes are linked by physical and biological processes to understand management options and how to effectively manage inevitable transitions. Our remote sensing approach to understanding drought and recovery provides a window into broad-scale processes that we can’t always detect in plot based measurements. Linking these findings to ground-based monitoring programs will provide even greater insight to climate impacts.The effect of drought can be dampened or amplified depending on plant trait interactions with climate-mediating factors like slope, aspect, and soil water holding capacity. Collectively, these complex interactions determine the severity of ecological drought which, for example, may be more influential in moist meadows than sagebrush habitats on the northern range. Our method demonstrates an efficient means to track drought effects and recovery in important Yellowstone habitats. Tracking the shifting spatial and temporal patterns of drought in wildlands will provide clues to bottom-up processes that shaped the habitats we see today and will continue to have profound effects on plants and animals in the future.
Literature Cited
Crabtree, R., C. Potter,R. Mullen, J. Sheldon, S. Huang, J. Harmsen, A. Rodman, C. Jean. 2009. A modeling and patio-temporal analysis framework for monitoring environmental change using NPP as an ecosystem indicator. Remote Sensing of Environment 113:1486–1496.
Crausbay, S.D., A.R. Ramirez, S.L. Carter, M.S. Cross, K.R. Hall, D.J. Bathke, et al. 2017. Defining ecological drought for the 21st century. Bulletin of the American Meteorological Society 98:2543-2550.
Despain, D. 1990. Yellowstone vegetation: consequences of environment and history in a natural setting. Roberts Rinehart, Inc., Boulder, Colorado, USA.
Frank, D.A., M.M. Kuns, D.R. Guido, S. Ecology, and N. Mar. 2002. Consumer control of grassland plant production. Ecology 83:602–606.
Garroutte, E., A. Hansen, and R. Lawrence. 2016. Using NDVI and EVI to map spatiotemporal variation in the biomass and quality of forage for migratory elk in the Greater Yellowstone Ecosystem. Remote Sensing 8:404.
Munson, S.M. 2013. Plant responses, climate pivot points, and trade-offs in water-limited ecosystems. Ecosphere 4:109.
Nemani, R., H. Hashimoto, P. Votava, F. Melton, W. Wang, A. Michaelis, L. Mutch, C. Milesi, S. Hiatt, and M. White. 2009. Monitoring and forecasting ecosystem dynamics using the Terrestrial Observation and Prediction System (TOPS). Remote Sensing of Environment 113:1497–1509.
Noy-Meir, I. 1973. Desert ecosystems: environment and producers. Annual Review of Ecology and Systematics 4: 25–51.
Phillips, L., A. Hansen, and C. Flather. 2008. Evaluating the species energy relationship with the newest measures of ecosystem energy: NDVI versus MODIS primary production. Remote Sensing of Environment 112:4381–4392.
Rodman, A., H.F. Shovic, and D. Thoma. 1996. Soils of Yellowstone National Park. YCR-NRSR- 96-2. Yellowstone National Park, Yellowstone Center for Resources, Mammoth, Wyoming, USA.
Thoma, D.P., S.M. Munson, and D.L. Witwicki. 2018. Landscape pivot points and responses to water balance in national parks of the southwest U.S. Journal of Applied Ecology. http://doi.org/10.1111/1365-2664.13250
David Thoma is a scientist with the National Park Service Inventory and Monitoring Program in Bozeman, MT. He uses a water balance model and satellite remote sensing to understand broad-scale relationships between climate and biology.
Seth Munson is an ecologist with the U. S. Geological Survey Southwest Biological Science Center in Flagstaff, Arizona. His research focuses on plant-soil interactions in dryland ecosystems and how these interactions are affected by climate and land use changes. Much of his research aims to understand the dynamics of dryland ecosystems at long temporal and broad spatial scales and employs a multidisciplinary approach. His work seeks to improve the management of arid and semiarid lands and is done in close collaboration with several land management agencies.
Last updated: June 8, 2021
