Last updated: March 19, 2021
Article
Assessing the relative vulnerability of sensitive karst habitats containing rare, threatened, and endangered species in the Chesapeake and Ohio Canal National Historical Park
By Dorothy J. Vesper, David Smaldone, and Daniel J. Feller
The Chesapeake and Ohio Canal National Historical Park is the most important tract of land for the preservation of rare, threatened, and endangered (RTE) subterranean macroinvertebrates in Maryland (Feller 1997). The park is home to more than 10 RTE groundwater species such as cave-dwelling amphipods and isopods that live in sensitive karst areas. The park extends 184.5 miles (297 km) along the Potomac River in Maryland and the District of Columbia, with an average width of only 290 yards (265 m). One hundred and sixty-one (161) perennial and hundreds of intermittent streams cross through the park on their way to the Potomac River. An unknown number of groundwater and surface water sources also flow from surrounding lands through the park. In a landscape undergoing rapid conversion from rural agriculture to exurban and suburban residential development, the narrow shape of this canal-based park contributes to its vulnerability to groundwater pollution originating outside the park.
Enabling legislation and National Park Service policies require that the karst features and resources be managed and preserved. The Federal Cave Resources Protection Act of 1988 (FCRPA; 43 CFR Part 37.16 USC 4301) mandates the inventory, documentation, and protection of karstic groundwaters and resources on federal lands. Such sites managed by the National Park Service need to balance public cave access with specific protections afforded under the act, including prohibiting disclosure of cave locations that protect sensitive species. The park contracted our research team to develop information and guidance for protecting and managing karst-related RTE species on park land. This article highlights the development of a vulnerability risk matrix, intended to help park staff prioritize the management needs of the park?s numerous karst features.
Karst landscapes evolve because of the solubility of the underlying rocks and are characterized by caves, springs, seeps, sinking streams, and dynamic storm responses. These features are common in the park in the regions underlain by limestone, and many of these features—especially springs and cave pools—are important habitats for aquatic invertebrates (fig. 1). Unfortunately, this results in settings where surface water can be rapidly transmitted into the groundwater system, leaving the underground environment highly vulnerable to impacts such as pollution from the terrain above. Release of organic materials into these areas (livestock manure, human sewage, leaves dumped into sinkholes or caves), introduction of toxic materials (from trash dumped into sinkholes and pesticide runoff) and pathogens (leaks from septic tanks and animal waste), increased sediment in runoff, paving over of recharge areas, or pumping of groundwater for human use may adversely affect subterranean aquatic habitats and jeopardize the continued existence of these species (Dilamarter and Csallany 1986; LeGrand 1973). This may affect both water quality and quantity, which in turn can affect the sustainability of subterranean ecosystems. Except for precipitation, the quantity and quality of water that enters the park are almost completely dependent upon the land use activities adjacent to the park, which are primarily on private lands. Additionally, visitation effects, including soil disturbance from recreational cavers, are also evident at multiple caves.
Because cave and spring habitats are isolated from one another, the associated fauna has evolved into invertebrate communities with RTE species. Previous research has examined many park springs, caves, and mines for macroinvertebrates. Significant discoveries include rare species of amphipods, snails, and isopods. Biological characteristics such as low population densities, low reproductive rates, and increased longevity or the necessity of subterranean habitat for these species make karst-dependent groundwater fauna particularly vulnerable to environmental change (Culver 1982). Overall, cave- and groundwater-adapted animals represent more than 50% of the imperiled (G1 or G2 Global Conservation Status Rank as determined by NatureServe,1) species tracked by state natural heritage programs in the United States.
The protection of recharge (source) areas for the springs, caves, and mines occurring on park land is important to the well-being of these species. We determined that the potential risks needed to be evaluated in an integrated scientific framework that involved the physical, chemical, and biological sciences. The assessment had to include an estimation of habitat and biota vulnerability from potential impacts and an evaluation of the severity of a problem if it were to occur. We developed the vulnerability risk matrix as a tool for managers to prioritize management strategies to address this difficult problem. Our approach was based on information from a number of projects, including (1) an inventory of karst resources in the park, (2) collection of water chemistry data, and (3) an RTE assessment.

(A-B) NPS Photos / John Tudek, (C-D) Photos courtesy of Dorothy Vesper
Integrating project data
The karst inventory focused on 76 sites of which 59 are on park land; the sites included springs, seeps, streams, caves, and mines (Tudek and Vesper 2011). Based on our field observations, the sites ranged from permanently dry to permanently flowing water features, with numerous intermittently flowing sites. The inventory also cataloged other significant geologic, cultural, and biologic resources (e.g., barrage tufa sites, a historical signature, snow trillium) as determined by the park.
A total of 45 water samples were collected from the karst features at the park to support the karst study. The samples were analyzed for inorganic elements and compounds to help with identifying water sources. Chloride and nitrate were included as indicators of surface input from roads and agriculture. Full details were provided in the final report to the park (Vesper et al. 2016). The water chemistry for major elements was similar across the sites and did not indicate the presence of water quality issues from inorganic constituents.
The RTE assessment focused heavily on RTE macroinvertebrates found in the park's karst subterranean habitats. Investigation of these macroinvertebrates dates back to 1968 (Franz and Slifer 1971). Subsequent surveys in the 1980s discovered additional species locality records, range extensions, and new species to science (Feller 1992, 1994, 1997; Fong et al. 2007; Lewis and Bowman 2010). We incorporated biotic surveys of these macroinvertebrates into the current study to provide more complete documentation of the groundwater fauna in the study area and to update the status of historical populations. We selected priority sites to include those supporting state and globally listed rare species (S1–S2 and G1–G3), undescribed species, undetermined species, and infrequently sampled sites. We conducted surveys primarily in the spring of 2012, with additional sampling in various seasons through 2015.
We surveyed 20 sites, including 19 seeps or springs and 3 caves, for cave-obligate (cave-dependent) invertebrates with a focus on aquatic species. We sampled select sites on multiple occasions for a total of 28 sampling efforts. Sampling conditions were sometimes suboptimal (due to weather events or access issues) during dates available for fieldwork. Despite the challenges presented by sampling conditions, we made significant accomplishments. We updated records for 11 RTE species and, perhaps most significantly, discovered seven new locality records for troglobites (cave-dwelling fauna). However, we did not find several of the rarest species that had been previously documented in the park. This may be due to loss of these species or suboptimal conditions at the time of the survey.
Developing the vulnerability risk matrix model
Our approach to prioritizing karst sites for management action allowed us to focus on the most vulnerable sites rather than attempting to fully characterize recharge areas for all sites. For example, sites without water (e.g., dry caves) are unlikely to be influenced by outside-the-park contamination and, therefore, did not warrant basin mapping. Even in the case of the vulnerable wet sites, we focused on major inputs rather than identifying exact boundaries and complete recharge areas. We also provided a baseline assessment of all sites that can be used for future conservation and management decisions. The goals of the vulnerability risk matrix were to (1) prioritize sensitive karst sites based on risk level and magnitude of impacts, (2) obtain detailed information for high-risk sites to enable planning, and (3) identify needs and potential solutions for establishing protection of these habitats.
Overall matrix description and strategy
The vulnerability matrix is a means by which different locations at the park can be prioritized for management needs. There are two main components of the matrix (fig. 2):
RISK: a score that represents the potential for contamination, and assesses three key factors. The higher the risk score, the greater the potential for contamination to occur.
IMPACT: a score that represents how contamination or harmful events (e.g., vandalism) may affect or harm the RTE species. The higher the impact score, the greater the potential for damage to RTE species.
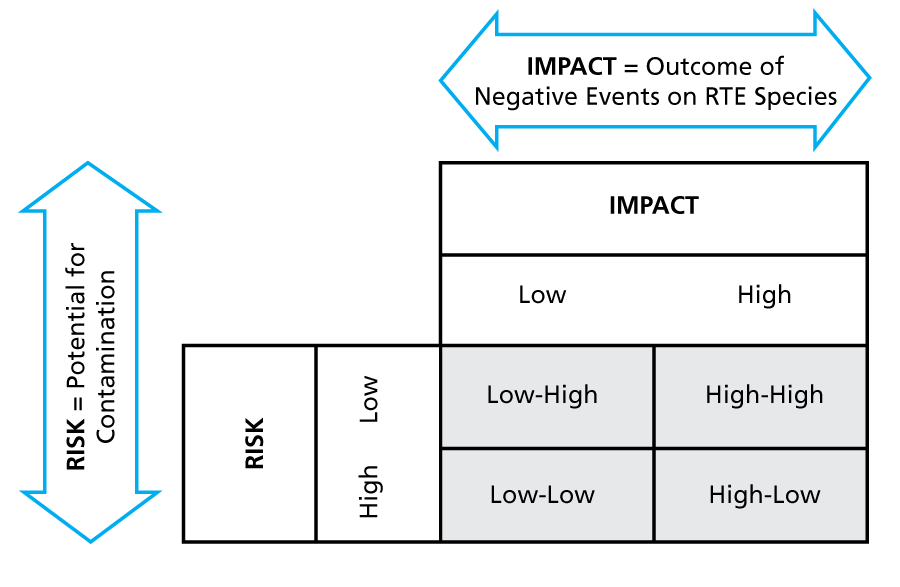
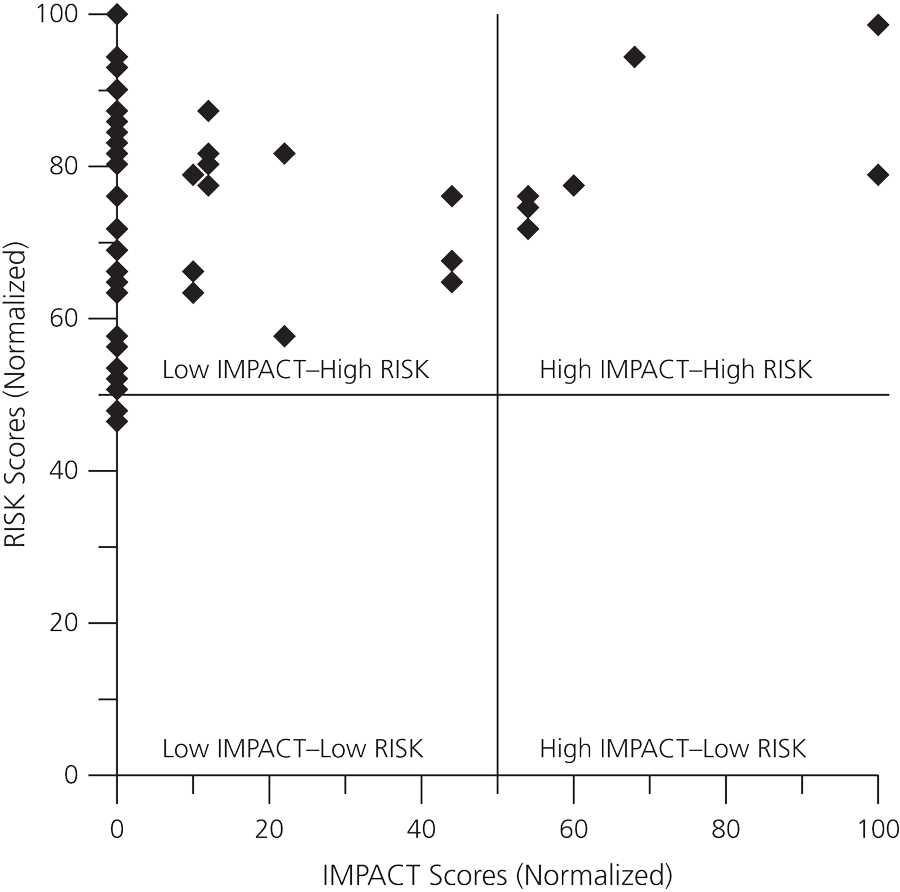
By comparing these two factors in matrix form, we identified four quadrants for management (fig. 2). These quadrants define the sites most important to protect (high risk–high impact), those needing the least protection (low risk–low impact), and those requiring further evaluation (mixed high and low impact).
We created this model in spreadsheet format for easy editing. It can be modified easily as priorities and project goals change.
Scoring of potential risks
We assessed the relative risk of important environmental and visitor-related categories identified by the project team (fig. 3). Given the lack of information about individual sites (e.g., area of contribution to springs, frequency of water flowing in caves), we selected topics that were general in scope.
| Issue | Risk Factor | Score | Condition | Comment |
|---|---|---|---|---|
| Water | Presence of Water | 0 | Dry | Qualitative determination made by research team experts. |
| 4 | Flow not seen but indications present | |||
| 6 | Pooled | |||
| 8 | Intermittent flow | |||
| 10 | Permanent flow | |||
| Water Quality | 0 | Not sampled or all chemicals below MCLs | Number of chemicals/contaminants present above EPA maximum contaminant levels (MCLs). Determined for all locations sampled for water quality during the study. Maximum contaminant levels used as the standard for comparison. Only inorganic substances were analyzed in this study, yet none were detected above their MCL. | |
| 2 | 1 chemical above MCL | |||
| 4 | 2 chemicals above MCLs | |||
| 6 | 3 chemicals above MCLs | |||
| 8 | 4 chemicals above MCLs | |||
| 10 | 5 or more chemicals above MCLs | |||
| Land Use | Agriculture | 0 | 0–9% of buffer area classified as agricultural | The percentage of agricultural land cover in buffer areas. Percentages ranged from 11% to 65% for park sites. |
| 2 | 10–19% | |||
| 4 | 20–29% | |||
| 6 | 30–39% | |||
| 8 | 40–49% | |||
| 10 | 50% or more | |||
| Industry | 0 | 0–9% of buffer area classified as industrial use | The percentage of land in the buffer zone mapped as industrial use. Values were less than 1% for all park sites. | |
| 2 | 10–19% | |||
| 4 | 20–29% | |||
| 6 | 30–39% | |||
| 8 | 40–49% | |||
| 10 | 50% or more | |||
| Sewer | 0 | 100% of residents in buffer zone on existing sewer | Washington County has not mapped its sewer system; however, regions are mapped. More than 90% of the buffer area adjacent to park sites was categorized as “no plans for future sewer systems.” | |
| 2–4 | 20–50% of residents on sewer; others programmed | |||
| 6 | 10–20% of residents on sewer | |||
| 8 | Less than 10% of residents on sewer, but long-term plans are for sewer installation | |||
| 10 | No plans for future sewer system | |||
| Stormwater | 0 | No information | Maps for stormwater systems were not available for Washington County, but information about locations of permitted stormwater control structures was. These ranged from 0 to 6 structures within a 1 mi radius of the defined areas. | |
| 2 | More than 5 structures | |||
| 4 | 4–5 structures | |||
| 6 | 2–3 structures | |||
| 8 | 1 structure | |||
| 10 | No structures | |||
| Visitor-related | Visitor Frequency | 0 | No site disturbance | Qualitative determinations were made by researchers based on field observations for all three visitor-related risk factors. |
| 1 | Mostly undisturbed | |||
| 2 | Visitation noted but no sign of litter or vandalism | |||
| 4 | Minor damage from visitors | |||
| 8 | Litter and vandalism present | |||
| 10 | Heavily vandalized | |||
| Access to Visitors | 0 | No information | ||
| 1 | Access sealed | |||
| 2 | Locked gate | |||
| 5 | Open access but hard to reach | |||
| 6 | Open access | |||
| 10 | Open access and visible from towpath | |||
| Danger to Visitors | 0 | Appears safe, no water present | Hazards include all sites with water except for those designated as low-volume "seeps," pits, rockfall, and potential for a fall or for flooding. | |
| 5 | Minor hazards | |||
| 10 | Major hazards |
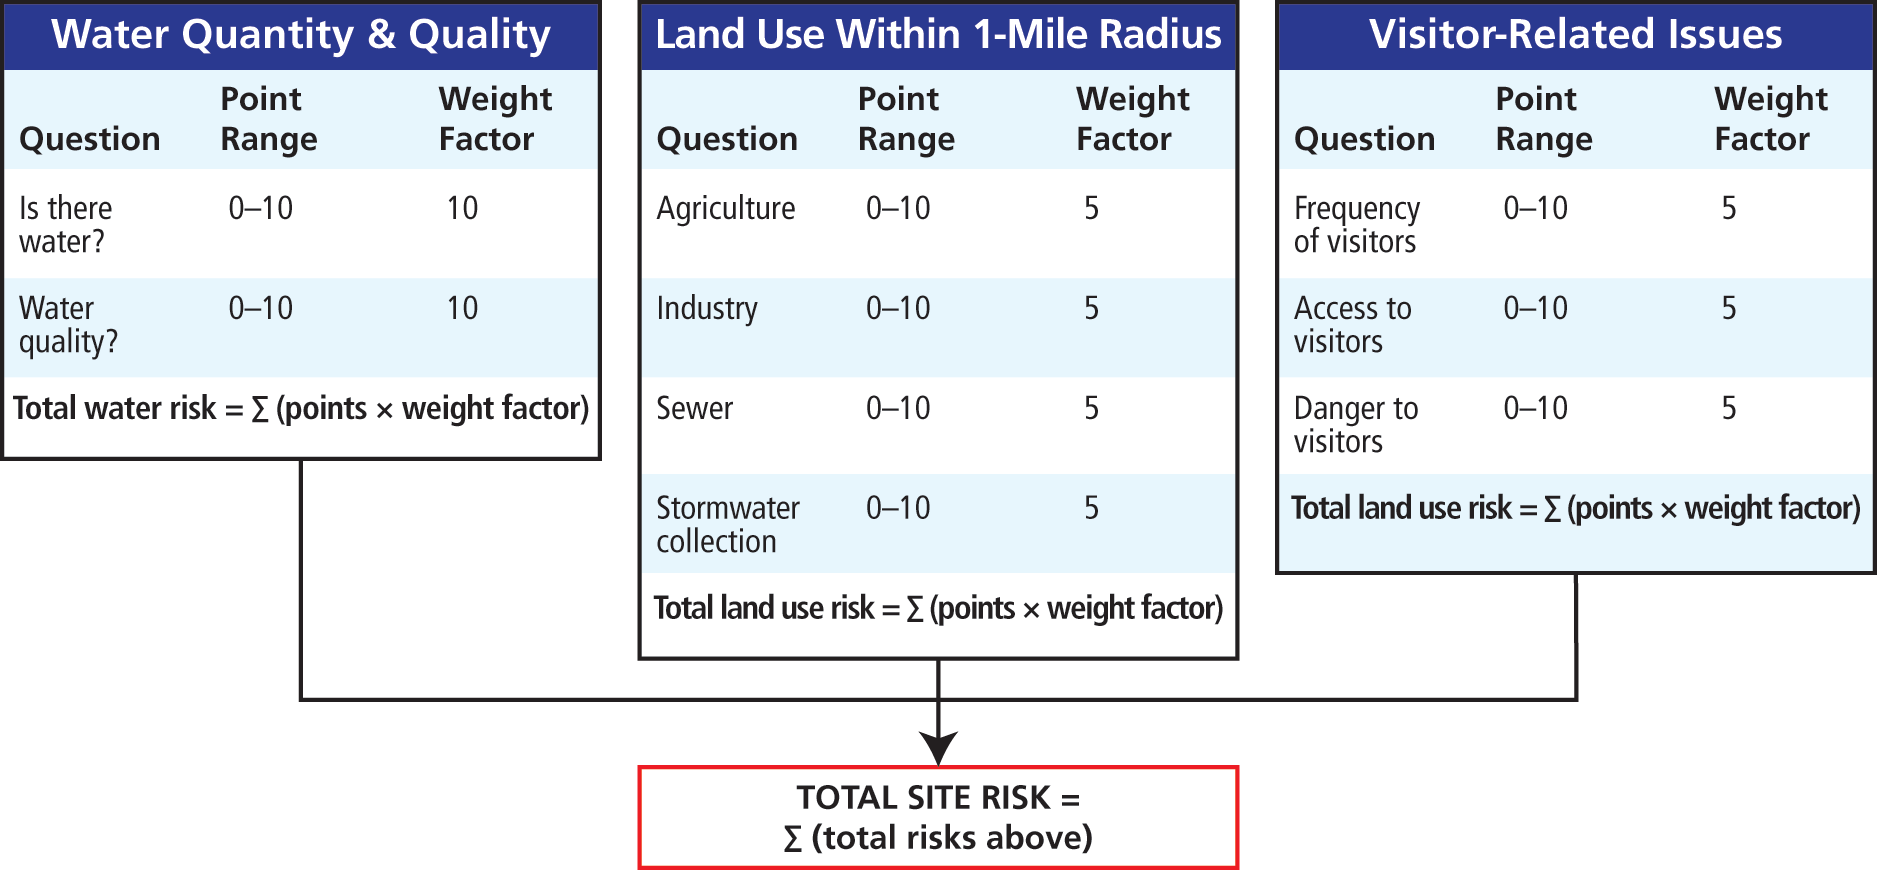
The team decided that critical factors to include related to water quality and quantity, land use and infrastructure, and visitor-related issues. We selected final categories and adopted a strategy that would enable us to compare the different types of risks and sites. This was at times a challenge, as the following examples illustrate:
Issue 1. Groundwater basins that contribute to springs in the park and water in park caves are extraordinarily difficult to define because very few have perennial waterflow and nearly all of the upgradient locations are outside of the park. Additionally there are few sinkholes or possible locations where we could inject tracing dye to identify what up-gradient source areas contribute to downstream impacts. We addressed this issue by (1) defining up-gradient locations by a one-mile radius “buffer zone” surrounding each feature, but only the area on the north side of the Potomac River, and (2) including dry, intermittently flowing, and permanently flowing sources.
Issue 2. Land use data are limited for the region. Our scoring approach was based on data that were available from the Washington County Department of Information Technology. To account for the distribution of public sewers, we relied on planning information for the county; to understand the impact of stormwater, we considered the number of permitted stormwater collection and treatment structures in each buffer zone.
For example, these data provided information on the amount of agricultural and industrial land use and the number of residents with sewer systems within the buffer zone for each karst site. We considered all agricultural and industrial land uses and the presence of septic systems (approximated by the lack of public wastewater treatment) to be potential contaminant sources that could have detrimental impacts on park karst features.
We developed an array of relative risk scores ranging from 0 to 10 points (10 being worst case) for each site risk factor (e.g., the presence of water, the lack of public wastewater treatment) based on the best available data. When data were not available and to determine relative weighting factors among the risks, we relied on professional judgment. After consultation with park specialists, we came to agreement on each risk and its associated weighting factor (table 1 and figs. 2–3). Once scores had been assigned, we multiplied each risk factor score by the corresponding weighting factor to come up with a series of risk scores for each risk category (i.e., water, land use, visitor issues). We then summed these values to get a single site risk score for each location in the park. Table 1 describes each risk category and how it was assessed. After scoring all of the sites, we divided each overall risk score by the maximum for any one site so that each score ranged between 0 and 100 and could be compared with the others. This is a process called normalization. Although the risk scores and weighting values are not absolute, the matrix approach allows for comparison of relative risks among the sites and helps identify those that may be a high priority for management action.
Scoring of potential impacts for RTE species
The impact score indicates the magnitude of a potential problem for RTE species. For example, the loss of a single habitat for a species in its “Only Known Occurrence” (OKO) has a greater impact than the loss of a single habitat for a species that is present in many locations.
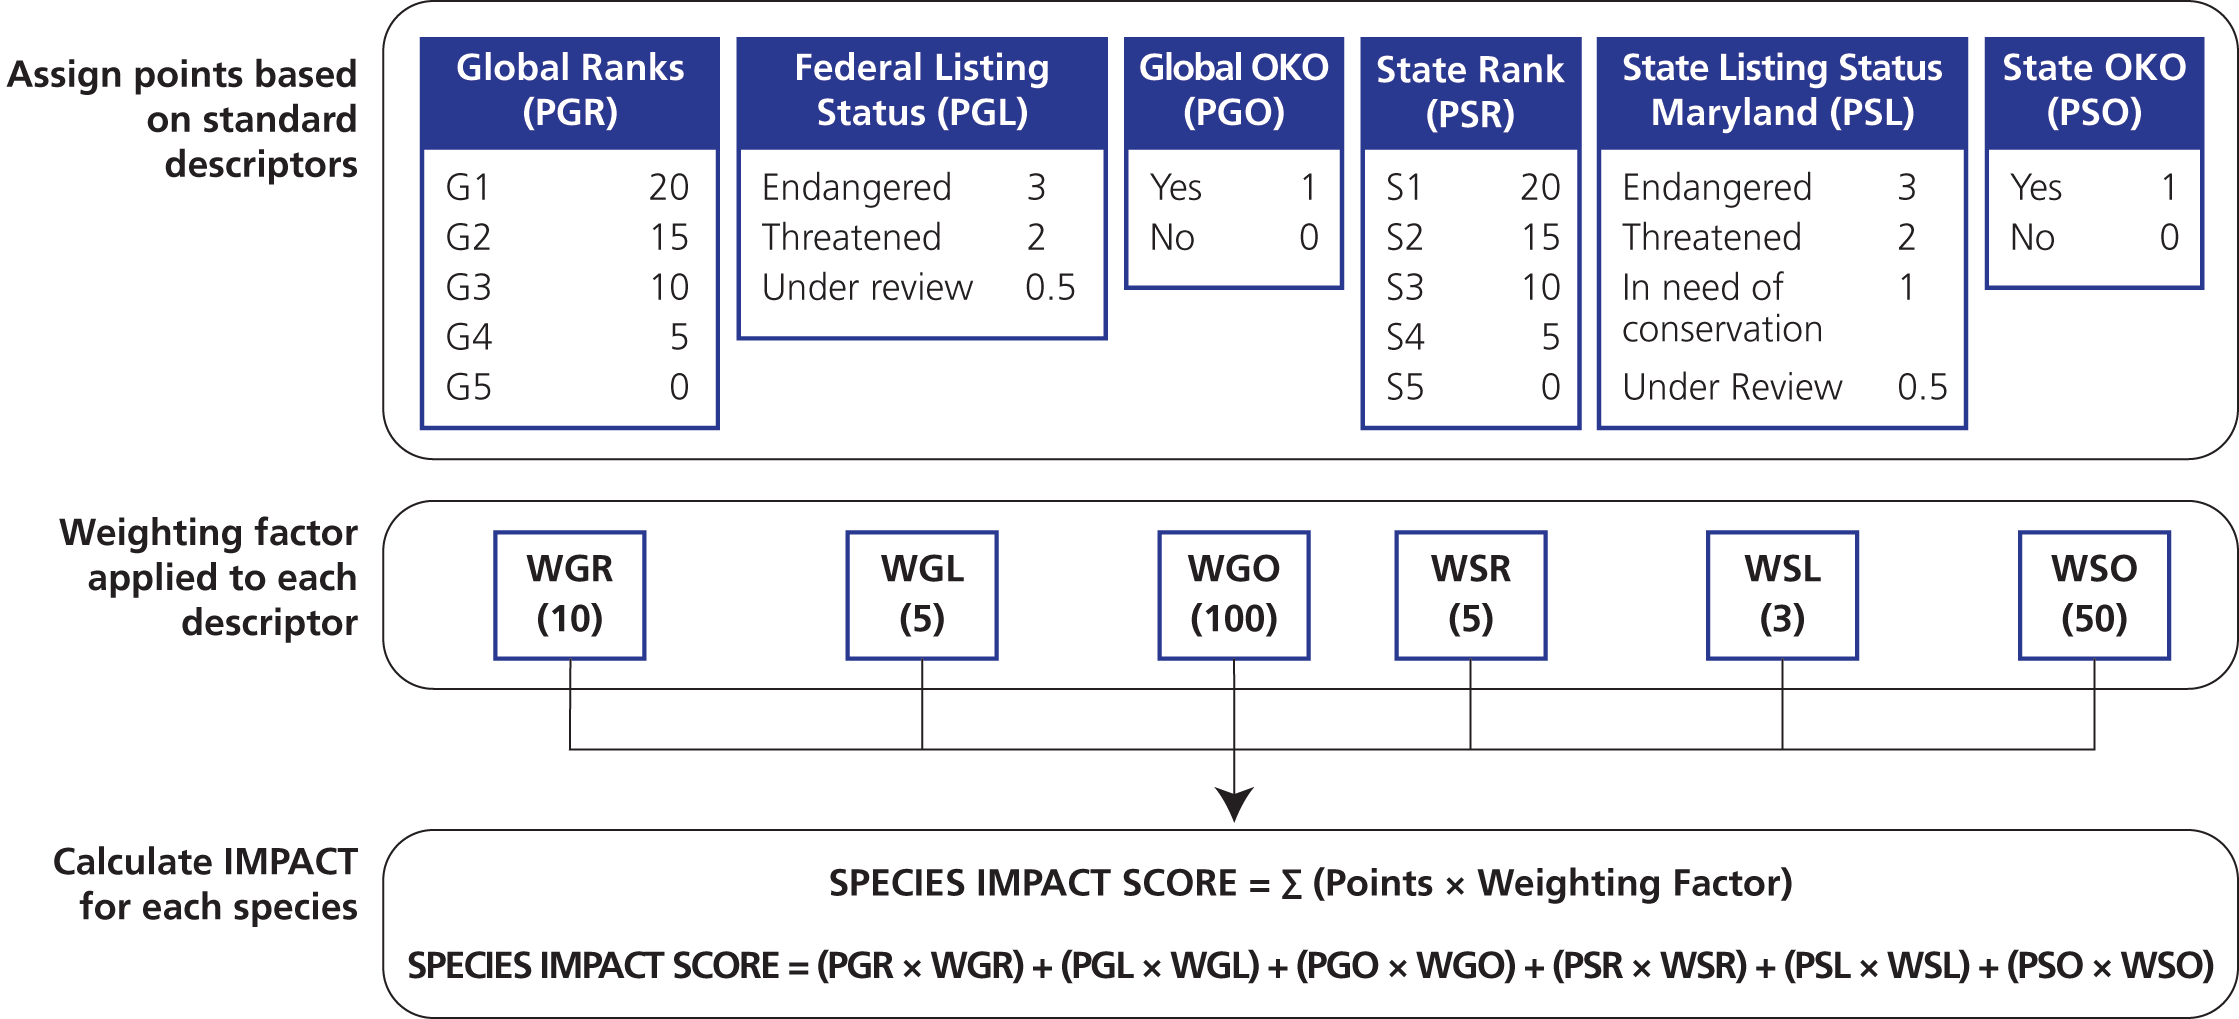
To quantify impact, we considered three standard ecological descriptors for both global and state standpoints: species rank, status of species listing, and species designation as OKO. These parameters are used commonly to assess species rarity (NatureServe Explorer 2016) and are defined as follows:
- Global species rank ranges from G1 to G5, with G1 being critically imperiled and G5 being globally secure. State species ranks S1 to S5 are analogous in Maryland.
- Federal listing status defines the legal status of the species according to the US Endangered Species Act. The listing status for Maryland is similar except that the state also defines a category of “in need of conservation” that does not exist on the federal level.
- “Only Known Occurrence” is a separate category that calls special attention to these species in the evaluation process. It identifies the species that are only known to occur in one place—on either a state or global scale.
We then assigned a weighting factor to each descriptor so that their relative importance could be established. The outcome was a single impact score for each species identified at the park (fig. 4).
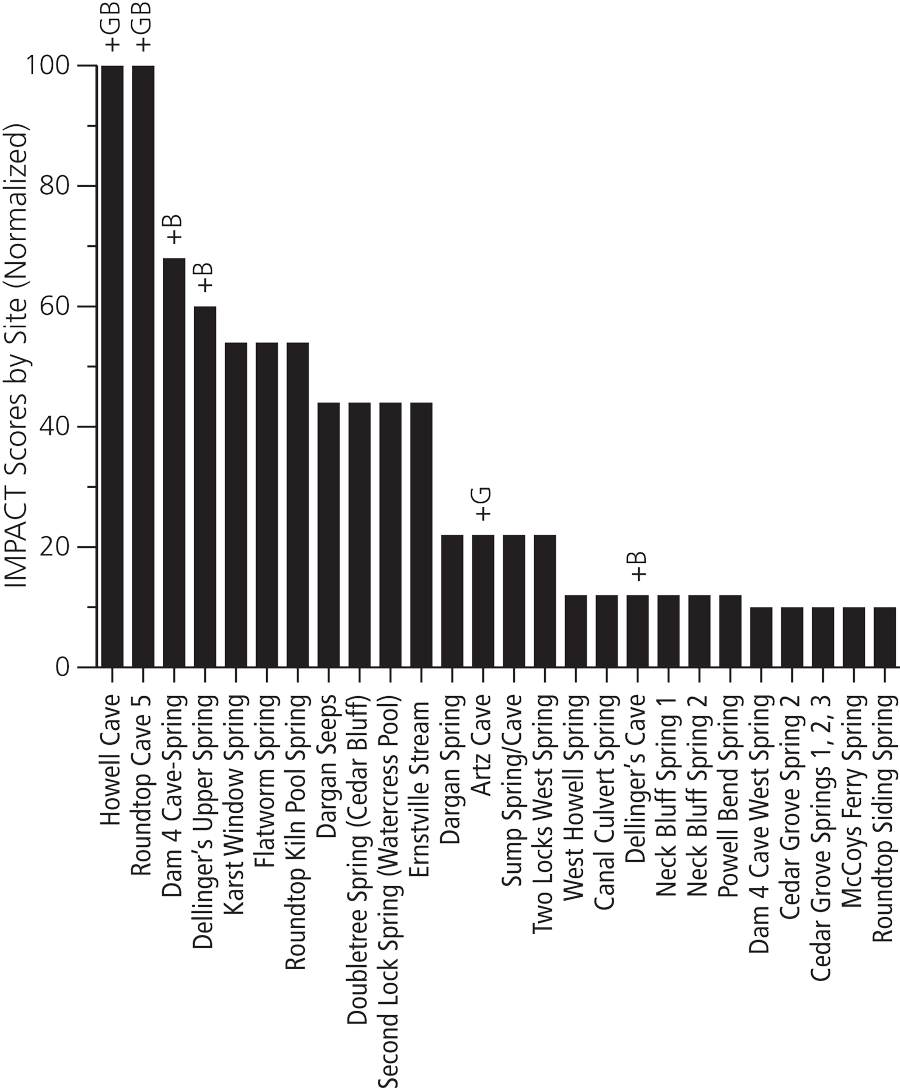
Once we had assigned scores to individual species, we calculated the site impact score for each location by summing the scores for all species present at that location. These scores were the basis for the vulnerability matrix. After scoring all species, we normalized each value to the maximum number so that all scores ranged from 0 to 100.
Special designations for sites
Scoring of the RTE species did not capture all potential impacts. We identified three additional types of resources that were worth tracking:
Cultural resources—Items such as a historical signature found at one site. We designated these with a “*C”.
Geologic resources—Noteworthy or pristine speleothems or unusual crystals are examples. These were designated with a “*G”.
Biological resources (other than RTE)—Bat hibernacula and botanical resources (e.g., an S1 endangered plant species), for example, that are not otherwise included in the site inventory. These were designated with a “*B” .
Outcomes of the potential risk assessment
Based on karst resource inventory data and additional resource information, all of the park karst sites scored from high (100) to low (46) for risk with a mean of 75 (fig. 5). These values indicate that sites range from highly vulnerable (closer to 100) to much less vulnerable (lower values). The values should be treated as relative numbers for comparison among sites.
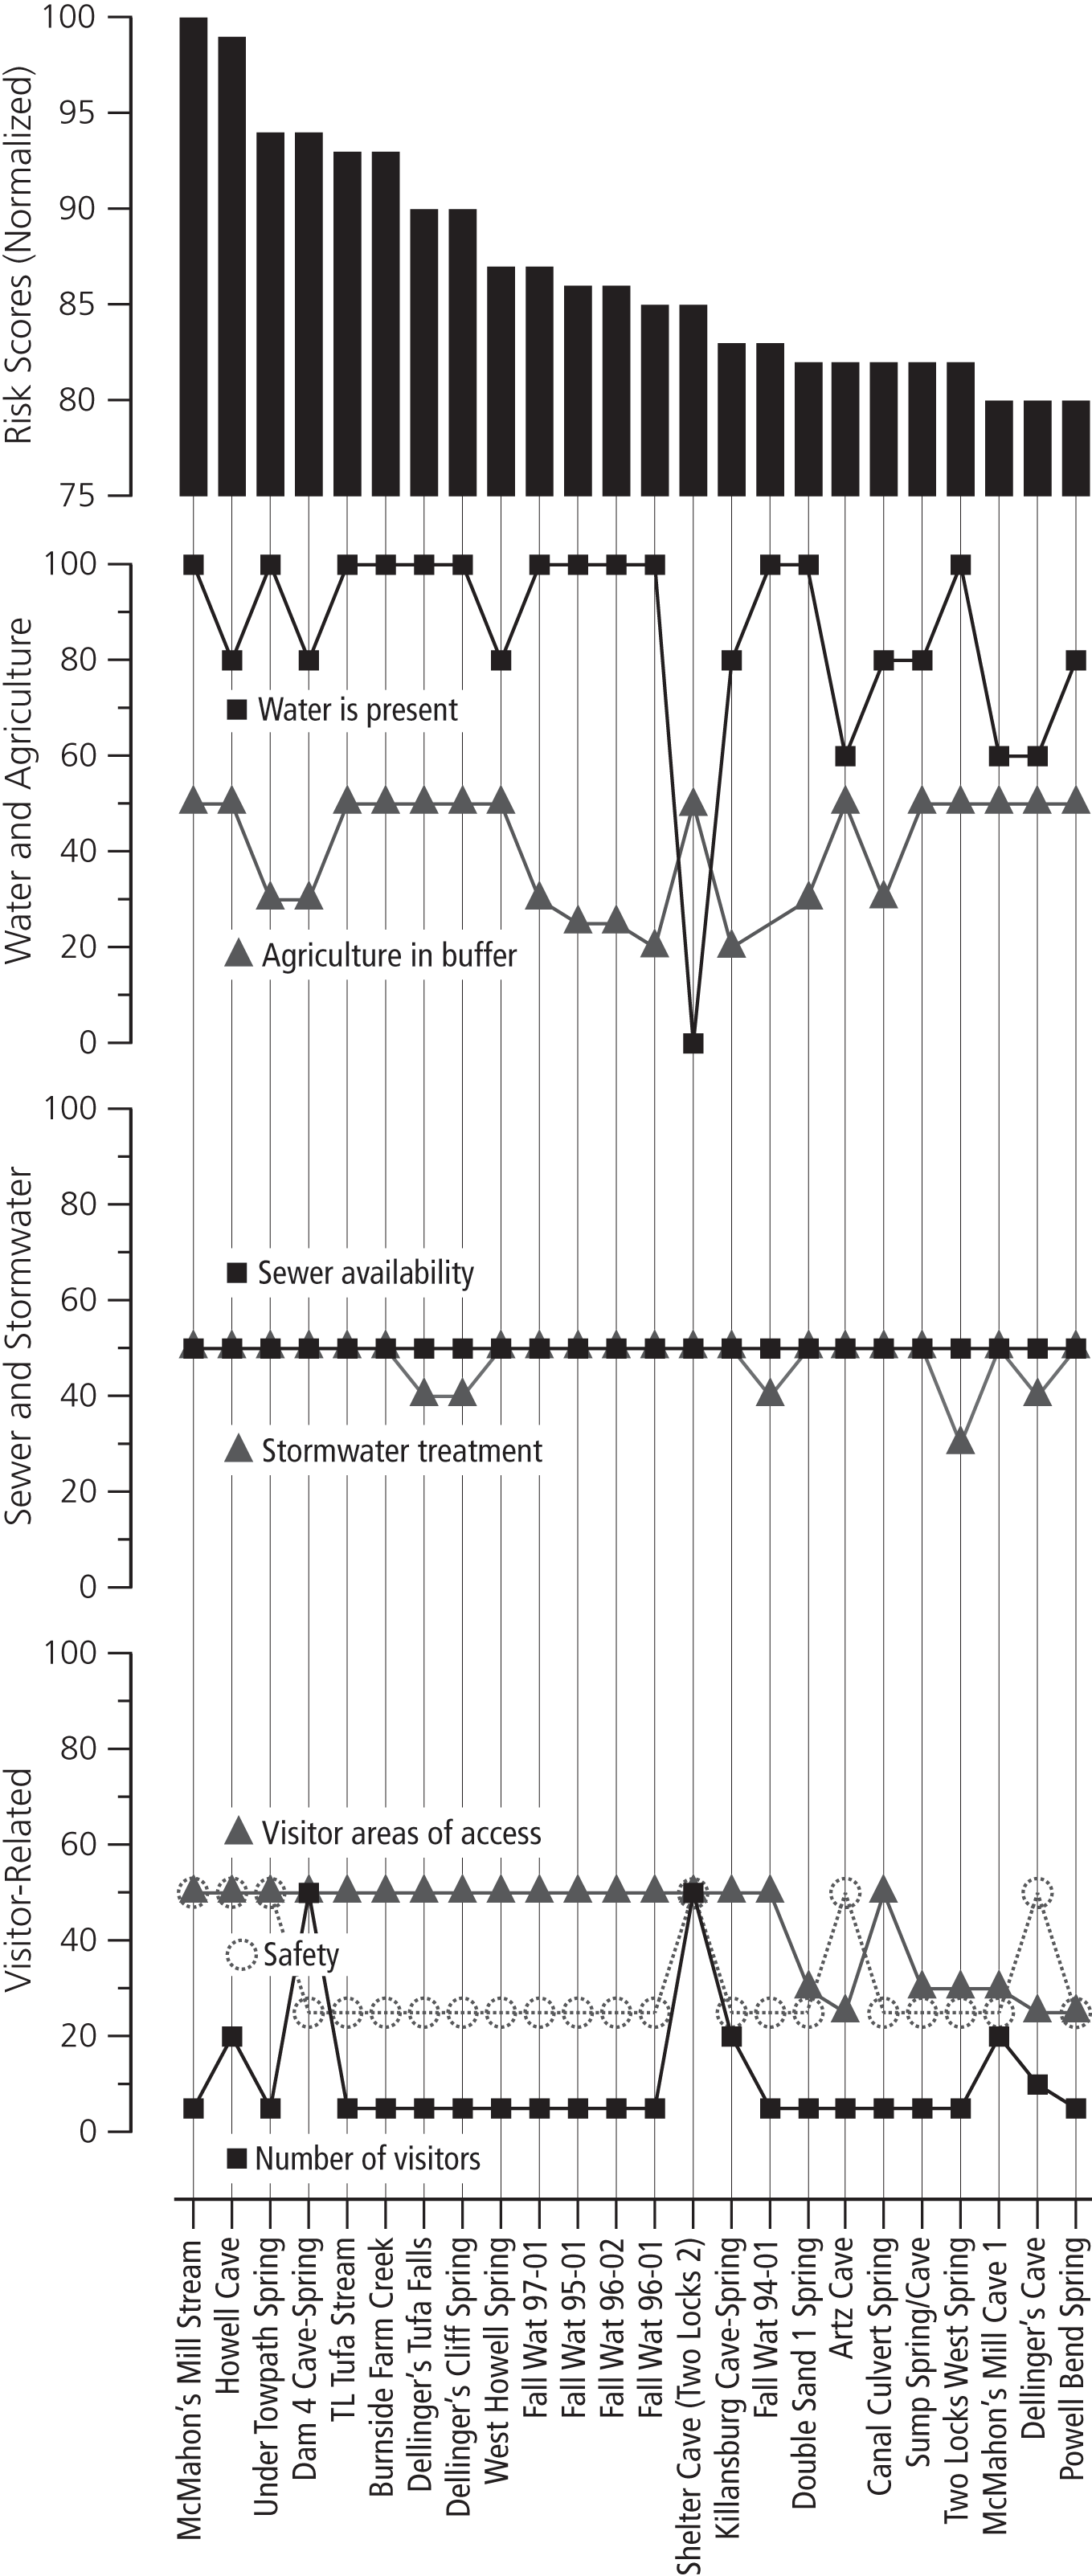
Figure 5 illustrates the contribution of five risk factors to the highest-risk sites. Water chemistry and industrial land use categories are not shown because all park sites scored zero for these categories. For nearly all of the sites in this high-scoring group water was present along with agricultural land use in the buffer zone. The presence of sewage and stormwater was nearly uniform across all sites and therefore did not contribute significantly to the differences among them. Visitor access also scored high for the top half of this group. Overall, these results suggest that the risk at any given site is from a combination of factors, with the presence of water being critical.
Outcomes of the impact assessment
Impact scores for RTE species
We based impact scores on the state and global rankings of RTE species individually and then combined them for each site. We awarded points to individual species ranging from 125 to 450, with a mean value of 338 and a median of 375 (fig. 6). Four of the five highest-ranked species are designated OKO at either the state or global level; we observed the other species as many as 18 times at the park. After calculating these initial values, we normalized the impact scores so that they could more easily be compared to the risk points.
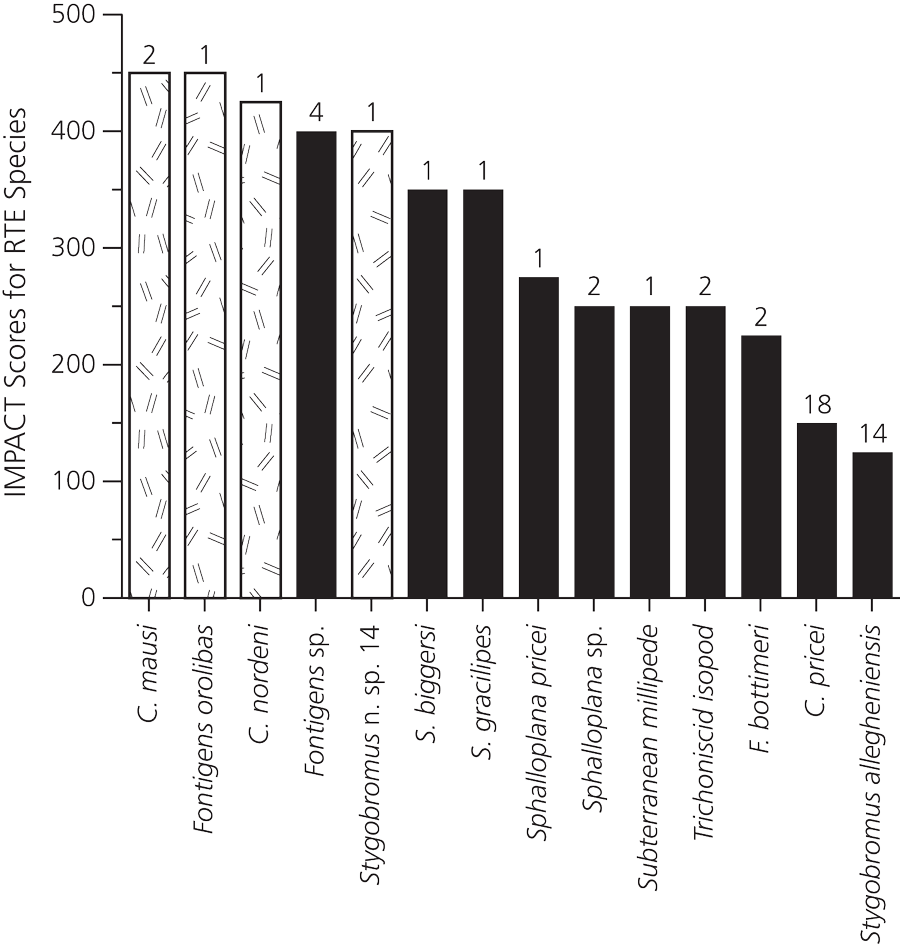
This assessment underscores the problem of undetermined and undescribed species. For example, we scored the species known as Stygobromus (an amphipod) n sp. 14, Sphalloplana sp. (a planarian or flatworm), and the subterranean millipede (species unknown) based on their probable rarity. Stygobromus n. sp. 14 is likely a global OKO species found only at a single site, but at most its range is limited to three counties in Maryland. Sphalloplana is likely S. pricei (proposed endangered), S. hoffmasteri (endangered), or possibly an entirely new species; all possibilities are rarer than we report here. As for the cave millipede noted above, all of our knowledge about this group is from one specimen collected at the park and two others from Washington County; however, none was identified to species. Overall, this is a rare group of macroinvertebrates, and these records suggest the study area is the approximate northern limit of cave millipedes in the eastern United States.
Impact scores for site locations
Figure 7 depicts impact scores ranked from high to low for all park sites where RTE species have been observed. The initial scores range from 0 to 1,250 points, with a mean score of 186 and a median of 0. A score of 0 occurs for locations with no observed RTE species or no data. We then normalized these initial scores to aid in the comparison between risk and impact.
Outcomes of the combined risk-impact matrix assessment
We plotted the risk and impact scores on a normalized scale to create the vulnerability matrix (fig. 8). Nearly all of the park sites have a high risk (>50%); however, sites have a wide range of these scores. Many sites had no observable RTE species and therefore have no impact score (shown as 0 on the y-axis).
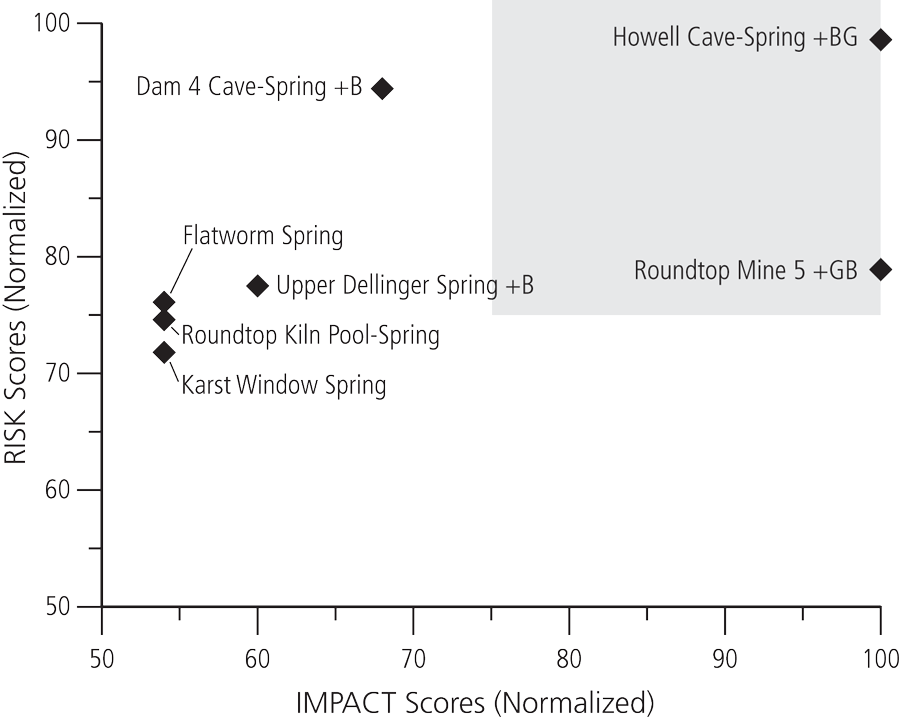
Seven of the 26 locations that we evaluated fall into the high-high quadrant for risk and impact (fig. 9). Of these locations, two had scores of risk and impact greater than 75 (out of 100), identified by the gray-shaded quadrant in the figure. The park has identified these locations as management priorities. Most of the remaining sites were located in the quadrant with low impact and high risk.
Summary and limitations of the vulnerability matrix model
The vulnerability risk matrix was effective in distinguishing the relative risks and impacts among park sites. As a screening tool, this model was useful for identifying which sites are both at risk (high-risk) and need protection (high-impact). Overall, the vulnerability matrix model identified seven park sites with high-impact high-risk scores.
The inventory provided NPS managers with better knowledge of park resources, and specifically the matrix was effective at identifying sites potentially needing protection or further investigation. This type of interdisciplinary resource inventory and assessment, coupled with development of site-specific risk matrices, could be applied at other national parks or protected lands with karst resources to aid in resource management.
Though we consider it useful for assessing environmental conditions, the model is only as good as the data. It is not possible to have a study that addresses and collects data on every possible risk or type of impact (e.g., every potential contaminant in a spring basin or change in species present during extreme storm conditions). The advantage of this approach is that it allows the user to integrate the data that are available and adjust the matrix when new data become available. Therefore, our assignment of points and weight values for scoring risk and impact categories should be considered preliminary and will undoubtedly be refined as our expertise with the model and availability of better information increases. For example, if RTE species become listed in the future, higher values could be given to sites where they are present to adjust for species sensitivity. We designed the model in spreadsheet format so that it can be adapted, modified, and easily learned by resource managers in various parks and protected areas. It is available on request and comes with detailed instructions.
1NatureServe Explorer: An online encyclopedia of life [web application]. Version 7.0. http://explorer.natureserve.org.
References
Culver, D. 1982. Cave life, evolution and ecology. Harvard University Press, Cambridge, Massachusetts, USA.
Dilamarter, R., and S. Csallany, editors. 1986. Hydrologic problems in karst regions. Western Kentucky University Press, Bowling Green, Kentucky, USA.
Feller, D. J. 1992. Summary report of subterranean aquatic invertebrates collected within the Chesapeake and Ohio National Historical Park in Washington County. Maryland Natural Heritage Program, Maryland Department of Natural Resources. Annapolis, Maryland, USA.
———. 1994. Aquatic subterranean macroinvertebrate survey of the Chesapeake and Ohio National Historical Park in western Washington County, Maryland. Maryland Natural Heritage Program, Maryland Department of Natural Resources. Annapolis, Maryland, USA.
———. 1997. Aquatic subterranean macroinvertebrate survey of the Chesapeake and Ohio National Historical Park: Blue Ridge physiographic province region. Maryland Natural Heritage Program, Maryland Department of Natural Resources, Annapolis, Maryland, USA.
Fong, D. W., D. C. Culver, H. H. Hobbs III, and T. Pipan. 2007. The invertebrate cave fauna of West Virginia. West Virginia Speleological Society Bulletin 16:167.
Franz, R., and D. Slifer. 1971. Caves of Maryland. Educational Series No. 3. Maryland Geological Survey, Baltimore, Maryland, USA.
LeGrand, H. 1973. Hydrological and ecological problems of karst regions. Science 179:859–864.
Lewis, J. J., and T. E. Bowman. 2010. The subterranean asellids of Maryland: Description of Caecidotea nordeni, new species, and new records of C. holsingeri and C. franzi (Crustacea: Malacostraca: Isopoda). Journal of Cave and Karst Studies 72(2):100–104.
NatureServe Explorer: An online encyclopedia of life [web application]. Version 7.0. NatureServe, Arlington, Virginia, USA. Accessed 22 January 2016 from http://explorer.natureserve.org.
Tudek, J. K., and D. J. Vesper. 2011. A review of the karst resources of the Antietam National Battlefield, the Harpers Ferry National Historical Park, and the Chesapeake and Ohio National Historical Park. Final Report to the National Park Service, National Capital Region, by West Virginia University, Morgantown, West Virginia, USA.
Vesper, D. J., D. J. Feller, B. Van Alen, and D. A. Smaldone. 2016. Assessing the vulnerability of sensitive karst habitats containing RTE species in the Chesapeake and Ohio National Historical Park. Final Report to the National Park Service, National Capital Region by West Virginia University, Morgantown, West Virginia, USA.
Acknowledgments
This project was funded by the National Park Service via task agreement P11AC60552 with the Great Lakes Northern Forest Cooperative Ecosystem Studies Unit (Cooperative Agreement H6000082000). The work was conducted under National Park Service Scientific Research and Collecting Permit CHOH-2014-SCI-0027 (1/1/14–12/31/15). We would like to thank the Chesapeake Bay Program for providing regional geospatial data that cross state lines and the Washington County, Maryland GIS office for providing county planning data. Thanks also go to Jackie Strager, who analyzed the Washington County data in terms of buffer zones for the individual site locations. We would like to thank Hui (Lisa) Yu for help in metagenomic library preparation and data analysis. The following students provided field, laboratory, and mapping support: John Tudek, Katie McConahy, Habib Bravo-Ruiz, Jill Riddell, Kyle Lee, and Asad Khan. We also would like to thank the staff and interns (especially Katie Loughney) at the Chesapeake and Ohio Canal National Historical Park.
About the authors
Dorothy J. Vesper is with the Department of Geology and Geography at West Virginia University, Morgantown, West Virginia. Inquiries about the project, vulnerability risk matrix, and database should be directed to Dr. Vesper at (304) 293-9816 or via email. David Smaldone is with the School of Natural Resources; Recreation, Parks, and Tourism Resources Program; West Virginia University, Morgantown, West Virginia. Daniel J. Feller is with the Maryland Department of Natural Resources, Natural Heritage Program, UMCES Appalachian Laboratory, Frostburg, Maryland.
