Last updated: January 19, 2018
Article
Monitoring Slope Movements
Gerald F. Wieczorek
U.S. Geological Survey, 12201 Sunrise Valley Drive, Reston, Virginia 20192-002, USA
James B. Snyder
U.S. National Park Service, Yosemite National Park (retired)
Wieczorek, G.F., and Snyder, J.B., 2009, Monitoring slope movements, in Young, R., and Norby, L., Geological Monitoring: Boulder, Colorado, Geological Society of America, p. 245–271, doi: 10.1130/2009.monitoring(11). For permission to copy, contact editing@geosociety.org. ©2009 The Geological Society of America. All rights reserved.
Introduction
Slope movements, including types of landslides and extremely slow soil creep (Varnes, 1978), occur throughout the United States and within many national parks. The collection of vital signs of regional landslide information, referred to as monitoring, is not only scientifically useful, but is beneficial for assessment of landslide hazards and risk, which is in turn important for regional operations and planning.
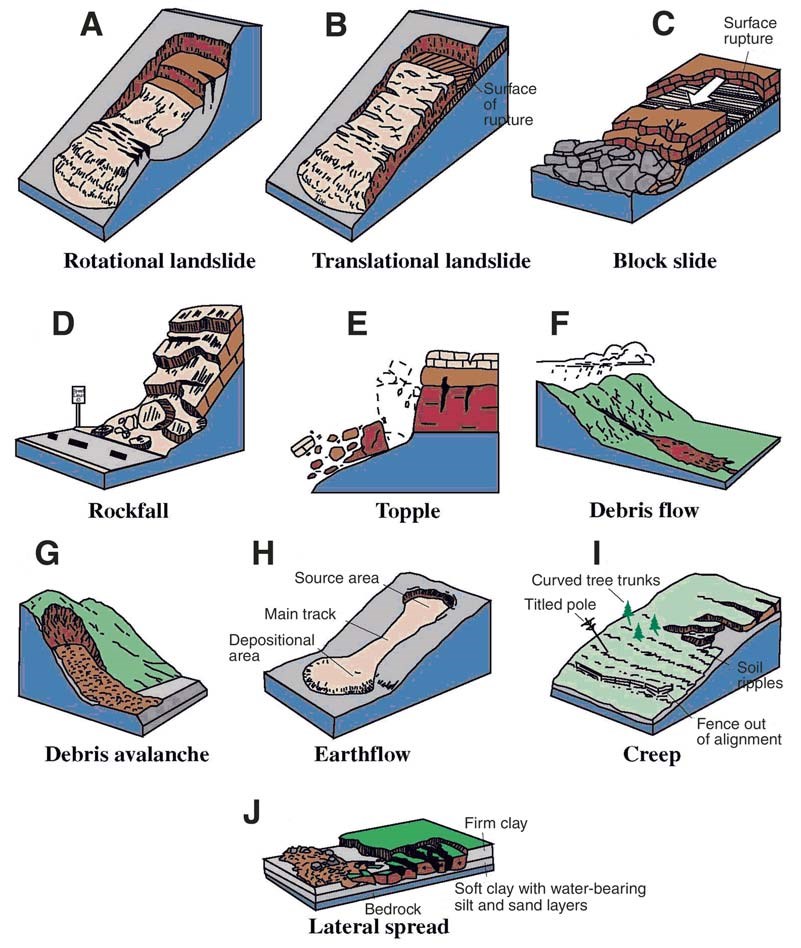
Different types of slope movement, such as fall, topple, slide, spread, and flow, can occur in a variety of materials and degrees of slopes. Specific types of landslides (Fig. 1), such as rockfall, earth slump, and debris flow, can occur depending upon the types of geologic materials and movement (Cruden and Varnes, 1996). A landslide can be caused by one or more of several factors, of which geological, morphological, physical, and human factors are the most common. The term landslide trigger refers specifically to an external stimulus, such as intense rainfall, rapid snowmelt, earthquake, volcanic eruption, or stream or coastal erosion. These stimuli initiate an immediate or near-immediate landslide movement by rapidly increasing shear stresses or porewater pressures, by ground acceleration due to seismic activity, by removing lateral support, by reducing the strength of slope materials, or by initiating debris-flow activity. Most landslides with recognized triggers are caused by precipitation: rainfall, snow meltwater, or combinations of both. In rock masses, rain and meltwater penetrate joints and produce hydrostatic pressures. In soils, the increase of pore-water pressures reduces shear resistance (Schuster and Wieczorek, 2002).
This chapter will describe several different methods of monitoring slope movements to evaluate landslide hazards and risks.
EVALUATION OF LANDSLIDE HAZARDS
Landslide prediction is rarely possible. Detailed instrumental monitoring of landslides is often not possible because of the lack of scientific expertise or insufficient budgets for instrumentation and subsurface investigation. In addition, instrumental monitoring is often not practical unless a rather small area is involved with intensive examination for a specifi c purpose. Impacts of monitoring need to be balanced with wilderness purposes. Two general types of information are needed as a background for selecting potential hazard areas and possible return intervals for landslide events. First, inventories of previously known landslides using newspaper accounts, geologic and regional maps, and historic photographs are critical. Second, current landslide observations that are recorded and mapped should then be compared with inventories of prehistoric and historic events.
Indicators of heightened potential for slope movement can be assessed by evaluating the following conditions within a region: seismic activity, intensity and duration of precipitation, climatic conditions affecting freeze-thaw, wind velocity, fire severity and frequency, annual groundwater level variations, stream and river erosion, and park construction and maintenance activities.
For some active landslides, it may not be possible to recognize a triggering event, because some triggers may come from unseen subsurface or indistinguishable events. General causes of slope movement, such as deeply incised tree roots which can gradually decrease the strength of materials, may become apparent after an event, even though it may not be possible to determine what actually triggered the slope failure.
Although basic levels of landslide information could be collected by many people, the gathering of more detailed scientific information by landslide monitoring can benefit from cooperation with the USGS, state geological surveys, or university geology or engineering departments. The National Park Service (NPS) and other public land organizations can establish a landslide observer(s) as collateral duties with base funded positions. Emergency response funding has sometimes been used for initial, short term landslide observations and safety determinations following a hazardous failure. This may include aerial reconnaissance combined with NPS Search and Rescue operations. Designated NPS observers can establish liaison relationships with relevant scientists; general NPS observations and monitoring procedures should be checked, corroborated, or critiqued by scientists.
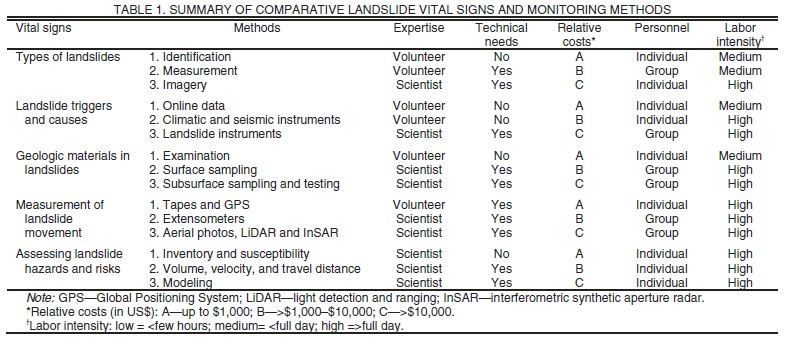
Five basic elements or vital signs of monitoring slope movement can be prepared for general regions. These vital signs include: (1) determination of types of landslides; (2) monitoring of landslide triggers and causes; (3) determination of geologic materials involved in landslides; (4) measurement and assessment of landslide movement; and (5) regional assessment of landslide hazards and risks. Each of the following descriptions of these five vital signs contain three relative methods, each of which is progressively more detailed, complex and expensive. Within each three methods there are systematic discussions of methodology, timing and frequency, equipment and costs, limitations, and interpretation (see also Table 1).
Vital Sign 1: Determination of Types of Landslides
One of the first important vital signs for examination of landslides is determining which of the specific forms of landslide have occurred. Landslides need to be evaluated based on physical observation and comparison of the materials with the different types of slope movement. Distinctive types of landslides, such as rockfall, debris topple, earth block slide, earth lateral spread, debris flow, and complex slump-earth flow (Varnes, 1978; Cruden and Varnes, 1996) often involve various geologic materials; they initiate and continue their movement in different physical methods, and are often started by a variety of events.
Level 1: Identification of Landslides
The type of landslide can be determined by field observation of the physical landslide features, the type of material of the initial movement, and the dominant type(s) of movement. The classification of landslides and materials are characterized by Varnes (1978) and Cruden and Varnes (1996). The types of movement include falls, topples, slides, lateral spreads, flows, and combinations of these types of movement, which are referred to as complex. Initially, landslide materials can be simply classified as bedrock, debris, or earth, although more detailed identification of geologic materials is useful, as described below. Debris is classified as containing more than 20% gravel and coarse sizes, whereas earth is classified as having greater than 80% sand and finer soil (Hungr, 2005). The initial source of a landslide is not always close to the landslide deposits. For example, identifying a debris flow may often involve locating the widely spread deposits of wet coarse soils on relatively flat alluvial fans and subsequently finding the source of the landslide significantly upslope in steeper terrain.
Timing and frequency. Landslides are best observed immediately after the initiation of slope movement. Observing the continuing movement of landslides can aid in the characterization of the type of event. If observation is delayed for days or months, a landslide could reinitiate movement, and the initial character cannot be assessed. For older landslides, vegetative growth and erosion of the landslide features can disguise the original nature of the landslide, so again, it is advantageous to examine landslides soon after they occur.
Equipment and costs. Direct field examination of landslides is often the most useful and the least costly method of identifi cation. Photography is not generally expensive, and if done digitally, files can be easily saved and distributed. Photography of a landslide from a helicopter or airplane can be moderately costly, but can provide detailed information, especially along steep cliffs. Aerial stereo photography and satellite imagery of landslides is more expensive but can provide very detailed documentation. Aerial stereo photographs or satellite imagery, although more costly (possibly several thousand dollars) can be useful for monitoring large regions.
Limitations. Identification of type can be more difficult when examining historical landslides because revegetation, erosion, and additional sediment deposit can modify the appearance of the landslide. Aerial and satellite photographs may not be sufficiently adequate for examining relatively small landslides, depending upon the scale of the photographs.
Interpretation. Identifying and determining the type of individual landslide can depend upon the method of slope movement classification (Cruden and Varnes, 1996) and upon how recently it moved. Large, high-velocity landslides, especially rockslides that develop into debris avalanches, are remarkable geological phenomena. A catastrophic landslide at Elm, Switzerland, in 1881 prompted Heim (1882, 1932) to conduct the first scientific study of slope movement events. His research set a pattern of combined interpretation of eyewitness accounts with geomorphological and geological studies of landslide deposits.
Level 2: Physical Measurement of Landslides
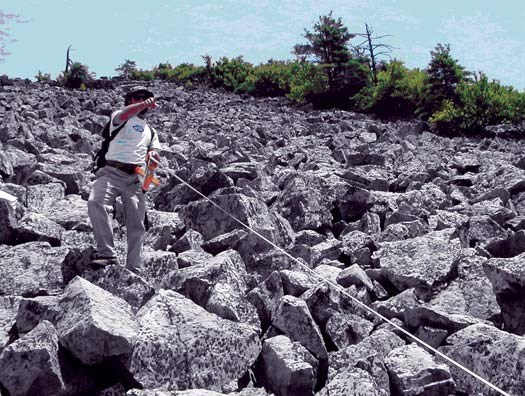
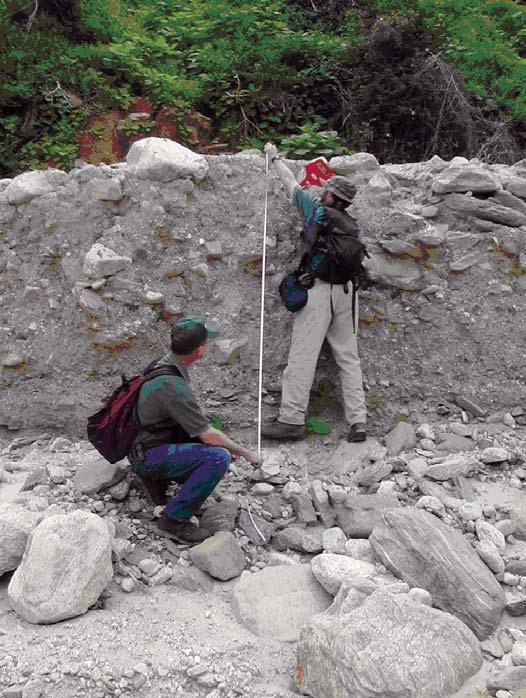
Determining the size of a landslide is important for several reasons. Measuring the lateral parts, such as length, width, and gradient is necessary for accurate mapping on a topographic map. In addition, it is important to determine the depth of the moving material because an evaluation of the total volume can help to assess the distance of continuing or future reactivation of the landslide. The size of a landslide can be reasonably estimated by a variety of methods, including making physical measurements with tapes, estimating size relative to nearby buildings or trees, and by figuring an average weight/unit of the failed material. It is also beneficial to sketch the landslide boundaries on a topographic map. Depth of the landslide can be the most difficult to determine, especially if the depth of a deep-sliding mass is not well exposed. For example, deep-seated rotational earth slumps may continue to move slowly for several months per year, but a distinct thickness of the mass may be difficult to identify without subsurface drilling, which can be both difficult and costly.
Methodology. Walking across a landslide and noting the edge of the landslide boundary is necessary for measuring the size of the feature. Stretching a tape across the two boundaries of the landslide is an easy way to measure the length or width. However, depending upon the size and the degree of slope of the landslide, this may be difficult. If necessary, range-finding binoculars can aid in measuring the distance between landslide boundaries. A drilling device can sometimes be used to determine the depth of a landslide. Strong, hard, solid soil or rock materials are often very difficult to hand drill. Access with a drill rig, commonly used with a truck, is helpful, but limited to landslides that can be driven over. Seismic reflection methods which test the subsurface depths of different density can be used to identify the landslide depth, but this can be difficult depending upon the geologic and hydrologic lithology. Drilling can also remove material that can be examined for signs of the failure surface.
Timing and frequency. After a landslide occurs, it is useful to measure the size within a few days. If the landslide keeps moving, repeating the measurement can determine if its size is changing, which could increase the hazards and risks. As long as a landslide remains dormant, repeating measurements is unnecessary. Once a landslide reactivates, it is important to determine whether the size of the feature has increased or decreased. Using a drill rig for determining depth of sliding surface is the most efficient technique, but this can be difficult if the ground surface is too steep, irregularly shaped, or too soft.
Equipment and costs. For surface measurements, tapes are relatively inexpensive. Binoculars cost about $200, and a detailed Global Positioning System (GPS) measurement system may run up to $500. (All amounts herein are in US$.) Accurately determining the depth of a landslide can be both difficult and expensive. Depending upon the type of drilling, the amount of time and cost varies. Some landslides can be drilled with holes wide enough for a geologist to be lowered down into for examination. Cameras can be used in smaller diameter drill holes to collect imagery that can identify failure surfaces. Using a drill rig costs approximately $1,000 per day.
Limitations. Although the surface of landslides can be measured along the ground or evaluated from photographs, the depth of some types of landslides, such as rockfalls, cannot be easily determined, unless the initial mass volume has completely dislocated and has been removed from where the landslide initiated.
Mapping and photography can be used to detail specific types of landslides, particularly large landslides that cover much steep terrain. For example, detailed examination of mapping from photos can determine how far recent debris flows have traveled (Fig. 4).
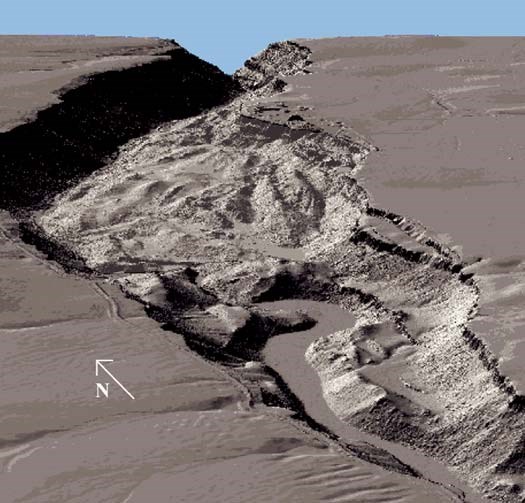
A GPS device can determine the size and displacement of a landslide by setting the boundary points on the GPS and determining the distance between them (Reid and LaHusen, 2004). Small landslide features may not be measured as accurately as larger features using GPS techniques. Aerial imagery, such as LiDAR (light detection and ranging), can be used to map landslides (Fig. 5) and evaluate their mechanics and material properties (McKean et al., 2004).
Equipment and costs. The cost of obtaining stereo aerial photography depends principally upon the size of the area and scale of the photos. For individual landslides, the cost could be less expensive than covering larger areas, though the cost for the flight could be similar. For example, the cost of stereo color photos of the 1996 Happy Isles rockfall in Yosemite National Park ranged from $2,500 to $3,000. Obtaining LiDAR imagery can be a more expensive operation. In the Ventura region of southern California, for an area of more than 100 km2, the cost of LiDAR with 1 m spacing ranged between $200 and $330 per km2. For a smaller region, the cost per square kilometer could be considerably higher.
Limitations. For aerial photographs or LiDAR imagery, the weather must be relatively clear; otherwise the results will not be accurate. Therefore, if a landslide occurs during fog or an intense storm, it would be necessary for the weather to change before the imagery could be accurately collected.
Additional Information
Determination of the type(s) of landslides is of critical importance for evaluating hazards and risks. The types of material from the landslide source and the deposits should both be carefully examined to determine the types of initial and subsequent movement. For example, some failures, such as rockfall or rockslide, can initiate from a large block of rock, but after a significant distance the rock block mass disintegrates into much smaller pieces. Some landslides initiate as one type of failure, but transform into another during prolonged movement. An initial shallow earth slide can turn into a debris flow over a period of rapid, fluidized, erosive movement. A rockfall can be transformed into a debris slide depending upon soil or talus saturation underneath, or beyond the initial release and impact. Typically, these features may be referred to as complex landslides, but it is still worth noting the initial type of landslide movement, as well as subsequent modified types of slope movement. In addition, an evaluation of the relative size of the landslide is important, including not only the size of the initial surface failure, but also the depth of failure of the sliding surface involving either soil, debris, or rock.
Vital Sign 2: Monitoring Landslide Triggers
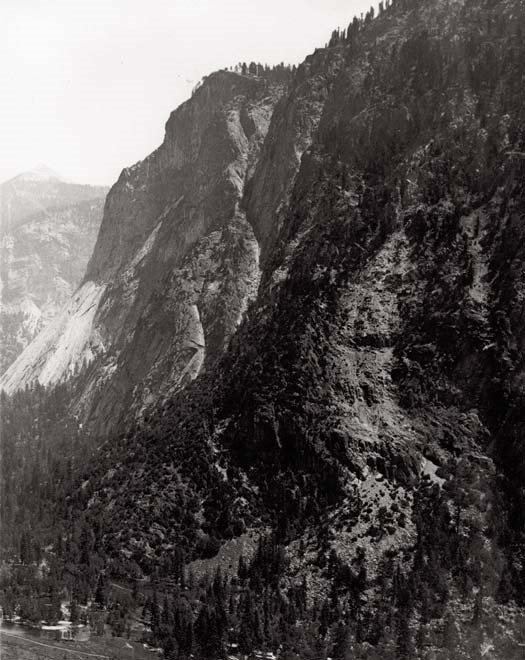
The triggering of landslides involves meteorological and seismological events affecting subsurface geologic materials (Wieczorek, 1996; Schuster and Wieczorek, 2002). Identifying the trigger or cause of a landslide is important, but can be difficult in some cases. If a landslide is observed starting to move during a storm or an earthquake, then the triggering event can possibly be easily identified. For example, John Muir, awakened by the 26 March 1872 Owens Valley earthquake in Yosemite Valley, immediately observed the Eagle Rock avalanche (Fig. 8) (Wieczorek et al., 1992).
Collecting meteorological information for a documented landslide is possible by using online contact with weather stations. For example, in California and Nevada, rainfall and snowfall can be easily obtained on an hourly, daily, or longer-term basis from http://cdec.water.ca.gov/snow_rain.html. Earthquake measuring devices, termed seismographs, are not frequently located within national parks; consequently, the local ground motion from a distant earthquake cannot be easily determined, especially where steep topography is widely present.
Methodology. Documenting the weather near the time of the initiation of landslide movement can involve several steps. First, the nearest meteorological station to the landslide must be determined. The differences in distance, elevation, temperature, and wind and storm direction between the station and the landslide site can affect the accuracy of determining the actual precipitation affecting a landslide. For example, rainfall measured in Yosemite Valley during the winter is not necessarily equivalent to the amount on nearby mountains. Snow on a hillside has a different effect on the possible triggering of landslides than rainfall infiltrating into the ground. The climatic differences in some areas also depend upon the direction of sunlight. For example, in Yosemite Valley, the amount of snow on the cliffs is very different between north- and south-facing slopes. If several precipitation stations are located near a landslide, then an evaluation of the average measured precipitation factors is best.
Timing and frequency. Measurement of rainfall attributed to triggering debris flows should be determined within at least 24 hours; intense rainfall should be measured every hour. Rainfall thresholds for the triggering of debris flows have been evaluated for some specific regions, including near Shenandoah National Park, Virginia (Wieczorek et al., 2000).
Equipment and costs. Obtaining online data from existing meteorological stations is relatively inexpensive.
Limitations. The physical distance from meteorological stations to landslide sites is critical. Generally, if the recorded data is within several kilometers of the landslide, then it should be quite applicable if there is no major topographic difference between the station and the landslide.
Interpretation. There is probably a shortage of sufficient meteorological stations, as well as seismological instruments within most large national parks. Consequently, it is often more useful to install instruments at nearby sites for accurate meteorological measurements, as described below.
Level 2: Installation of Meteorological and Seismological Instruments
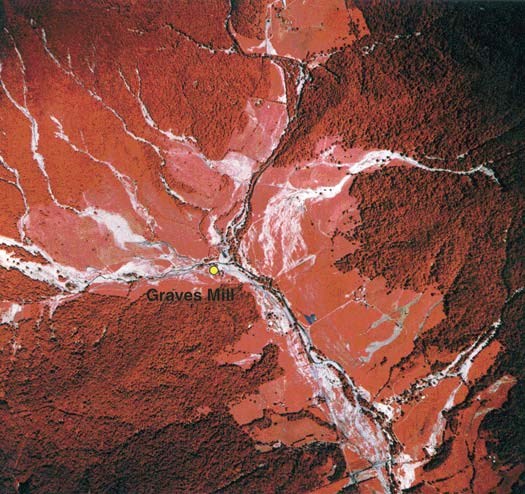
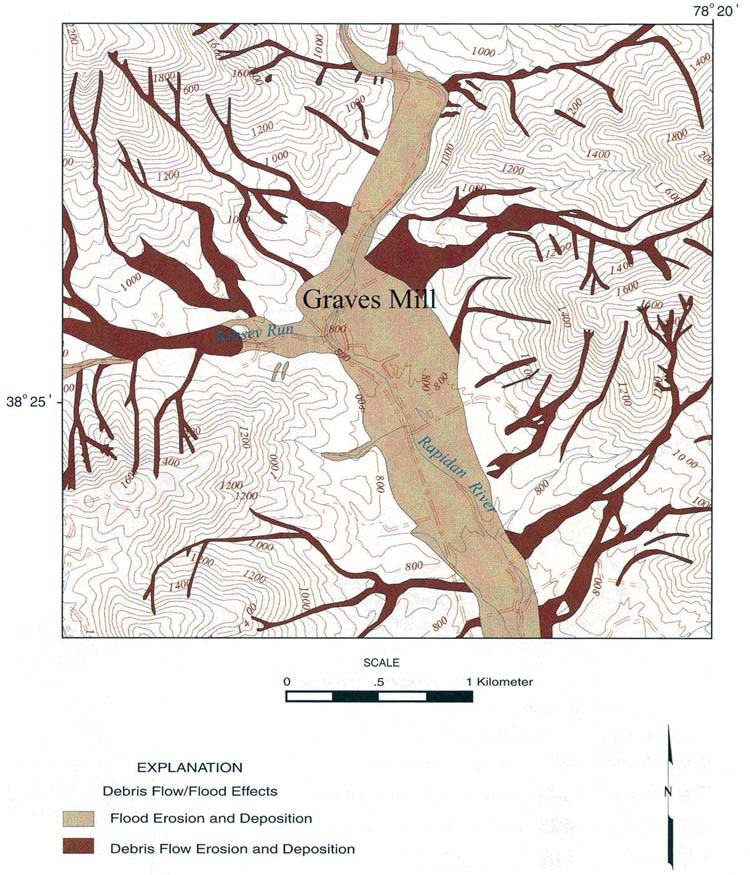
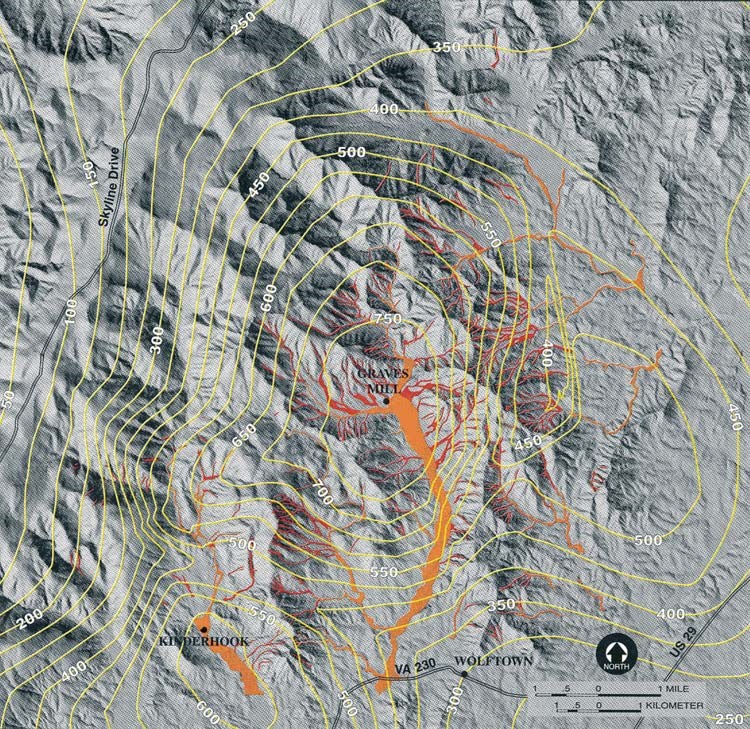
A collection of climatic and seismic data can help provide useful information related to the triggering of landslides and evaluation of landslide hazards. The amount of precipitation within certain periods can be collected as basic data for each initiated landslide, and then analyzed for the development of basic rainfall threshold values. For example, rainfall thresholds have been developed within specific regions, including the San Francisco Bay region, Puerto Rico, Virginia, and Hawaii, on the basis of detailed post-event studies where landslides were identified (Wieczorek et al., 2000). Generally, the rate (inches/hour) and duration (hours) of rainfall are both important for the recognition of triggering landslides. Extremely high rainfall was recorded on 27 June 1995 at specific locations and subsequently contoured into a region affected by numerous debris flows and floods in Madison County, Virginia (Fig. 9). Precipitation data can be collected from many different areas, including National Oceanic and Atmospheric Administration’s (NOAA) National Weather Service (NWS) stations, though automated, real-time local stations may provide the best data near local landslides. The U.S. Geological Survey (USGS) provides seismological monitoring of earthquakes throughout the United States.
Methodology. Meteorological instruments must be installed where vegetation or structures do not interfere with the accurate recording of data. For example, rain gauges near trees may not record accurately due to leaf cover. Likewise, putting temperature gauges near buildings can affect temperature data. Cleared areas are preferable for installation of meteorological instruments. For seismological data, a data logger with a tri-axial accelerometer, telemetry hardware, batteries, and a subsurface protective structure is necessary. Selecting a proper location is also important. Seismic equipment needs to be installed in stable ground. Even though the initiation of landslides can be related to the seismological shaking, both climate and seismic instruments need to be separated from areas that are likely to be impacted by landslide deposits. Regular maintenance is necessary for continued monitoring. For areas that are difficult to reach during some parts of the year, it is extremely important to have automatically transmitted data that can be systematically collected and analyzed. Measuring earthquake-induced ground shaking is likewise important for recognizing what magnitude, distance, and frequency of earthquake events are likely to occur in a specific region and whether landslides are likely to be initiated.
Timing and frequency. The recording of weather information and seismological ground motion should be continuous, although climatic data only needs to be recorded roughly hourly. Seismological monitoring should be recording every few seconds; the most critical information is the largest seismic shaking magnitude within minutes of the initiation of landslide movement.
Equipment and costs. Meteorological equipment and seismological monitoring should have data continuously transmitted by telemetry or Internet. Rain gauges, snow monitor devices, and temperature thermometers are the minimal equipment required. Seismic monitoring equipment, including data logger with triaxial accelerometer, telemetry hardware and huts, masts, batteries, and concrete for installation of a strong motion reference site could be moderately expensive.
Limitations. The proximity of the meteorological and seismological devices to the location where landslides initiate can be a limitation if the elevation and the type of geologic materials are significantly different. Within extreme elevation variations, weather monitoring can be very difficult because of the many instruments that would be needed to accurately represent the climatic factors from dramatically different elevations. Additionally, even slightly different regional latitudes can produce different rainfall and temperature records.
Interpretation. In analyzing the effects of weather on landslide movement, it is important to examine the antecedent rainfall and temperature for previous days, weeks, or months, and to assess the recent intensity of rainfall. Different rainfall thresholds for the triggering of landslides have been determined in many different regions throughout the world (Wieczorek and Glade, 2005). In steep mountainous regions during winter periods, it is necessary to evaluate the variation in temperature and the amount of rain and snow. Although distance from the epicenter of an earthquake to the location of a seismological device is critical, the topographic setting as well as the geologic type of subsurface material will also be important to evaluate the seismic velocity data.
Level 3: Installation of Instruments within Landslides
Specific instruments installed within landslides can provide useful information regarding possible landslide movement and the potential for increased hazards. The rate of landslide movement can show whether the velocity is suddenly increasing and posing increased hazards.
Installation of instruments for detecting the depth of water, e.g., piezometers, can be used for detailed long-term monitoring of groundwater-level fluctuation and landslide movement. However, the purchase, installation, and monitoring of piezometers can be relatively expensive and demanding for personnel within national parks.
Methodology. Various types of devices can be installed to monitor landslide movement. One of the simplest methods is to install stakes on the surface that can be periodically measured to detect movement. Additionally, movement of trees or other surface features may be worth monitoring. Of course, this provides landslide movement data only as frequently as the site can be measured. More sophisticated instruments of surface movement, such as extensometers, which can record continuous movement, are much more useful.
Instrumentation for monitoring movement throughout the depth of a landslide can be obtained from inclinometers. A hollow metal tube can be installed within a drilled hole, which can then be periodically measured to determine the variation of the original inclination of the tube. Ideally, the subsurface location of a landslide rupture can be detected with the inclinometer. Measurement of inclinometer systems can be connected to data loggers so that movement can be regularly monitored and recorded on software.
Piezometers are instruments that are installed within the ground to measure the pressure of groundwater levels at specific depths. Pneumatic piezometers are the most effective measurement technique. Because multiple layers of different types of soils and rocks affect the variation of water levels, an open drilled hole is not sufficient to detect the actual pore-water pressure within complicated geologic materials. A piezometer installed within a drill hole isolated above and below by impermeable sediment gives pore-water pressure at a specific depth. A wire tube can be used for measuring the raised height of water or a more sophisticated device can evaluate the amount of water pressure. The depth of water from piezometers can be physically measured periodically, or if connected with monitoring equipment, can record variation in groundwater level.
Extensometers can be directly installed from a stable region with wires onto points of the landslide in order to directly measure landslide displacement. The displacement can be continuously measured and recorded within regular periods of time. The measured movement from extensometers includes a combination of both horizontal and vertical displacement.
Timing and frequency. Many landslides remain steady or dormant for a long time until activated by severe storms or earthquakes. They can either move for relatively short periods, or they may continue moving for days or months. Therefore, it is important to be able to detect and measure landslide movement at least daily. Depending upon the severity of landslide movement, the instrumentation for monitoring can be affected and consequently should be regularly assessed once movement has initiated.
Equipment and costs. Depending upon the depth of drilling and the installation of subsurface instrumentation, the operation of piezometers and inclinometers can be relatively expensive. Very small, 3-inch-wide piezometers can be installed for about $30 per foot of depth, whereas installation of larger piezometers may range from $200 to $1,000 per foot. Consequently, depending upon the depth of the installation in the landslide, and how many sites need to be sampled, the cost could be very high.
Limitations. If subsurface instrumentation measurements have to be taken physically, the quality of data can be limited, compared to more costly continuous monitoring methods. However, if landslide hazard warnings are an important reason for monitoring, then continuous monitoring methods are important and alarms can be activated based on evaluation of the relative recordings. Some landslides, such as earth slumps, start moving relatively slowly and can continue moving for days or much longer. If monitoring detects a rate of slow continuous movement of landslides, then hazard warnings can be issued more easily than for rapidly moving landslides, like rockfalls, which can collapse within minutes.
Interpretation. Monitoring of regions capable of landslide movement does require knowledgeable evaluation of the received database on previous knowledge of movement of different types of landslides. For example, the rise of groundwater level is common during periods of heavy rainfall. However, it is necessary to evaluate what level of high groundwater level is necessary for initiating landslide movement.
Additional Information
Landslides, particularly debris flows, often are triggered during or soon after intense rain storms. However, some landslides, especially deep-seated landslides, can be initiated by the slow deep infiltration of rainfall into the ground and subsequent buildup of ground water levels within thick soil. Typically earth slumps or block slides can move slowly enough that they may not be noticed initially unless disturbing trees, roads or buildings. Without some knowledge by measurement of groundwater levels within soil or rock joints, it is not easy to identify landslide triggering events, such as levels of ground saturation, after storms. General causes of weakening slopes, such as tree roots slowly splitting rock joints apart or gradual weathering of rocks, cannot easily be directly observed, but could be a main cause of slope weakening and eventual failure.
Vital Sign 3: Determination of Geologic Landslide Materials
Level 1: Examination of Geologic Materials
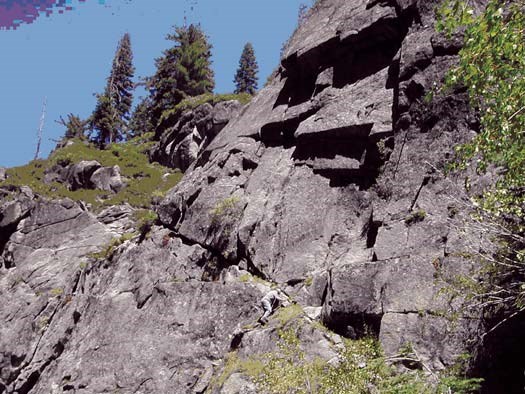
Geologic materials involved in landslides can be easily evaluated by a combination of physical examination and studying geologic maps. Depending upon the scale of the landslide, the type of bedrock can usually be directly assessed, if the geologic mapping is accurate, with a small-scale map (equal or less than 1:24,000). However, in some cases, landslides occur within soil that has been developed from weathered bedrock or has been physically relocated by movement from its bedrock source. Therefore, in some cases, physical examination of the material involved is necessary.
Methodology. Landslides can occur in virtually all types of geologic materials. Distinguishing different types of bedrock as well as types of soil is necessary for assessing landslides. Geologists should be capable of identifying and determining the specific types of sedimentary, igneous or metamorphic rocks in landslides from field and laboratory work.
Field examination of the geologic types of landslide materials is relatively direct when the materials are clearly exposed on the ground surface. If landslides are significantly deeper, e.g., from ten to one hundred feet, then it is possible that different types of subsurface bedrock can be involved in the landslide if different layers of bedding are present beneath the ground surface. Consequently, drilling and sampling may be necessary in some cases for determining the different types of geologic materials within the full depth of the landslide.
Examining surficial geologic materials within landslides is typically possible by observation. A rock hammer can expose fresh surfaces of rock and assist in sampling and examining materials at relatively shallow depths.
Timing and frequency. This method should be used as needed.
Equipment and costs. Rock hammers are relatively inexpensive. Drilling and sampling can be inexpensive if the materials are soft and can be hand drilled at shallow depths. Using small, medium, or large drill rig vehicles would be progressively more costly and probably could amount to several hundred dollars per hour, depending on the depth, width and strength of drilling.
Limitations. Within national parks, splitting of rocks with rock hammers is not usually permitted. Likewise, drilling holes to examine subsurface soils and bedrock in national parks would usually require special permission.
Interpretation. The evaluation of different types of bedrock and soils should first be compared with the available geologic maps within the region. However, more detailed evaluation can also be interpreted by delivering soil or rock samples to geologic consultants. Identification of the type of bedrock or soil, strength of the material, and density would also be beneficial in evaluating the different types of materials.
Level 2: Simple Surface Sampling of Landslide Materials
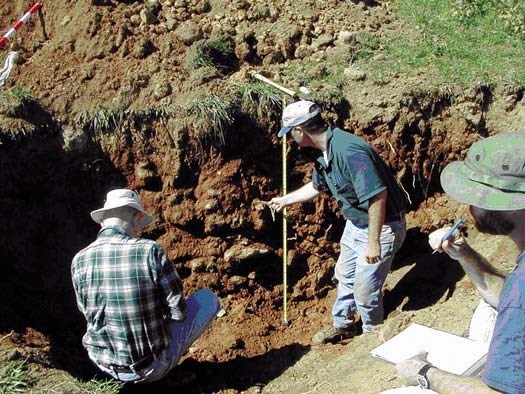
Collecting and examining samples of surface materials involved in landslides can be very informative for determining the type of landslide processes. For relatively shallow landslides, determining the type of material, relative density, and percentage of water content is often possible. Occasionally, samples of dateable material, such as pieces of buried vegetation, can be collected for radiocarbon analysis, and can provide information on the dating of different previous landslide events near the same location (Fig. 11).
Timing and frequency. Examining landslide materials is most important either soon after they have begun or immediately after they have completed major movement. Noting when a landslide is starting to move can provide critical information on the specific type of movement and can also be important for issuing landslide hazard warnings. Examining surface samples of landslides can be done for dormant landslides, but need only be regularly repeated if landslides reactivate.
Equipment and costs. The equipment for sampling shallow landslides is commonly available (rock hammers, shovels, and geologic compass) and not expensive; however, the total cost depends upon how many sites need to be sampled.
Limitations. Depth is the primary limitation on conducting easy landslide examinations. Whereas shallow landslides, e.g., debris-flow deposits, can often be directly examined even at the bottom of deposition, deeper landslides, such as earth slumps, cannot usually be fully examined without deeper mechanical drilling. Additionally, rockslides and rockfalls may be difficult to access and examine closely because of extremely steep slopes.
Interpretation. Determining the type of materials and other important landslide criteria, such as joint orientation for rock slopes, requires general geologic training and experience. Reviewing the general types of landslides, documented by Cruden and Varnes (1996), is the most direct method of learning about landslide processes.
Level 3: Subsurface Sampling and Laboratory Testing of Landslide Materials
Field sampling and laboratory testing of the strength of soil or rock materials can determine relative slope stability. Recognizing and determining the type of soils, such as clay, silt or sand, or types of rocks, such as shale, schist, or granite, provide a relative indication of material strength. Clayey soils have a low frictional strength, but a relatively high cohesive strength, whereas silt and sand have relatively high friction angle strength and low cohesive strength. The frictional and cohesive strength control the relative shape and steepness of soils. These strength criteria are important for evaluating the stability of the soil mass. Within rock masses, measuring and evaluating the joint properties is an important factor for assessing slope stability (Harp and Noble, 1993). The direction and steepness of different joint sets in comparison with the slope surface direction and steepness is necessary to determine what type of slope failure is likely. Intersection of different joint sets can generate a more complex form of sliding referred to as wedge failures (Markland, 1972; Hoek and Bray, 1974). Extremely steep joints can also result in toppling of sheets of rock. The opening size, smoothness, and filling of joints are also pertinent to the evaluation of stability. Geotechnical laboratory testing of collected samples provides a more comprehensive assessment of soil and rock strength than simple observation and recognition of material types. Although collecting samples from landslides, especially those from deep sites, may be difficult, the laboratory testing is standardized.
Methodology. Subsurface exploration on landslide sites can be conducted in several different ways depending on the length of time required and the types of information being collected. There are both direct and indirect methods that can be used for subsurface exploration. Direct methods utilize test borings and excavation of test pits which allow the examination of materials, usually with the removal of samples (McGuffey et al., 1996). Of course, one of the most important items is determining how deep the failure surface of the landslide is beneath the ground. Subsurface drilling can be conducted for sampling and examination of deep materials, and also for installation of instruments for subsequent monitoring. For shallow landslides, it may be possible to conduct hand operated drilling and sampling if the subsurface material is not too hard. Indirect methods, such as using geophysical surveys, can provide an evaluation of subsurface geologic materials.
Timing and frequency. Examining and sampling landslide features and materials is most informative as soon as possible after landslide movement has occurred and before surface features are modified by weather or human interaction. For example, determining the scarps, flanks, and subsurface ruptures can be most easily detected soon after deformation.
Equipment and costs. Reconnaissance methods and surface geophysical explorations provide indirect data but are relatively less expensive than drilling. Access for reconnaissance and geophysical exploration is much less difficult than for drilling and subsurface sampling, typically because of steeper and physically disrupted surfaces on landslide terrain. Consequently, the costs for drilling and subsurface sampling are much more expensive than reconnaissance and geophysical explorations, because typically drilling and sampling requires several drilling personnel and significant drill rig equipment. For drilling and sampling at several sites within a large landslide, the costs are likely to involve at least $10,000.
Limitations. The physical steepness and irregularity of ground surface on landslides affects accessibility. For example, steep rockfalls can only be accessed by rock climbers, though small samples and measurements using geophysical methods could be taken if the site is sufficiently stable. Some less steep landslides can still be inaccessible to large equipment, especially drilling machines, because the ground movement could have made the transportation impossible.
Interpretation. Interpreting the results of subsurface investigations of landslides does benefit from experienced geological engineers (and engineering geologists). In addition, some of the basic duties, such as applying a drill rig, require extensive experience.
Additional Information
Observing fresh cracks in soil or rock after a landslide has initiated even small movement can indicate potential future instability. For example, shortly after rockfalls on 7 and 13 February 1986 on a cliff above the Nevada Fall trail of the Merced River in Yosemite National Park, a 3–5-m-long, fine fresh crack was detected ~20 m upslope of the overhanging rock. This crack, with only ~0.5 cm of extensional opening, roughly paralleled a deep, weathered joint, but did not connect to any other cracks near the overhang. During a subsequent storm on 8 March which dumped 10 cm of rain, a rockfall of 1500 to1600 tons occurred at this site, covering ~150 m of the John Muir Trail (Wieczorek et al., 1989).
Vital Sign 4: Measurement and Assessment of Landslide Movement
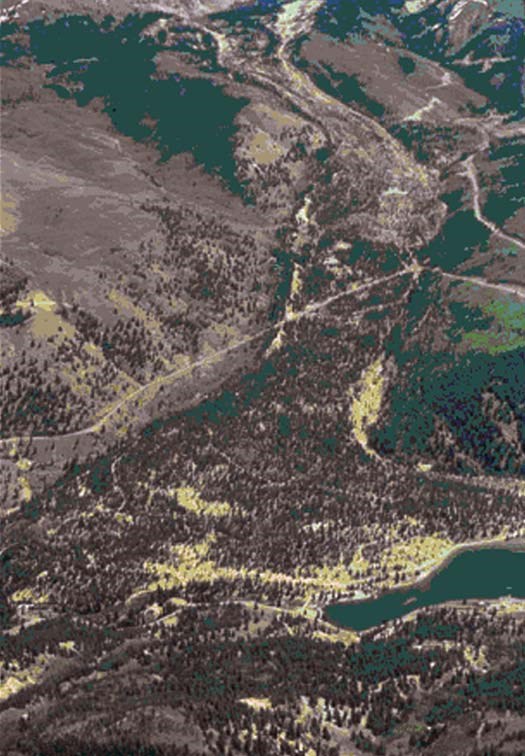
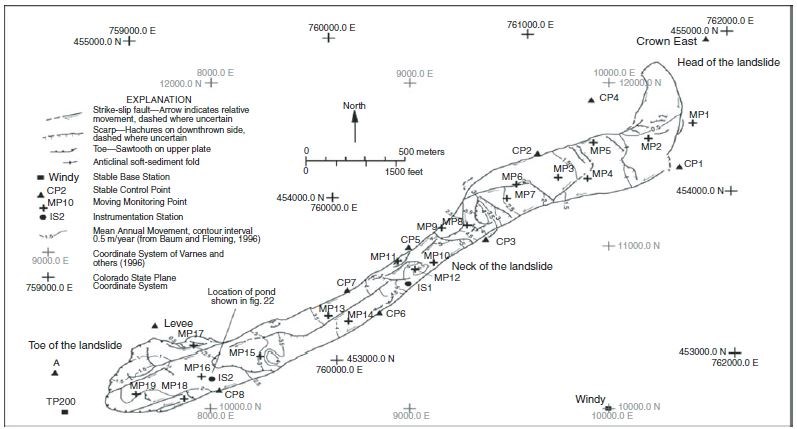
The entire Slumgullion landslide is 6.8 km long, covers and area of 4.74 km^2, and has an estimated volume of ~170 x 10^6 m^3 (Parise et al., 2004).
Installation of instruments for monitoring landslide initiation and prolonged movement can provide important information on the relative hazard posed by landslides. A number of instruments can be used to document landslide movement, including GPS monument points, InSAR (interferometric synthetic aperture radar), extensometers, and inclinometers.
Level 1: Application of Measurements from Field Monitoring Tapes and GPS
One of the simplest methods of documenting landslide movement is to install surface field monitoring tapes that can be sequentially measured for landslide movement. However, these surface posts can be damaged by animals or people. The frequency of measurements depends on the frequency and rate of landslide movement. Obviously, dormant landslides do not need to be measured as often; however, once a dormant landslide has initiated movement, it is important to make repeated measurements depending upon the velocity and type of landslide.
Methodology. Wooden or metal posts in the ground can be directly installed into a landslide. In addition, some stable reference points beyond the boundary of the moving landslide are needed. The posts should be deep enough into the solid material so that other factors, such as wind and rain, will not displace them. Points that can be detected on aerial photos can be used to observe previous landslide movement (depending on the amount of movement and the scale or accuracy of the photos); otherwise, accurately measuring displacement is not generally possible.
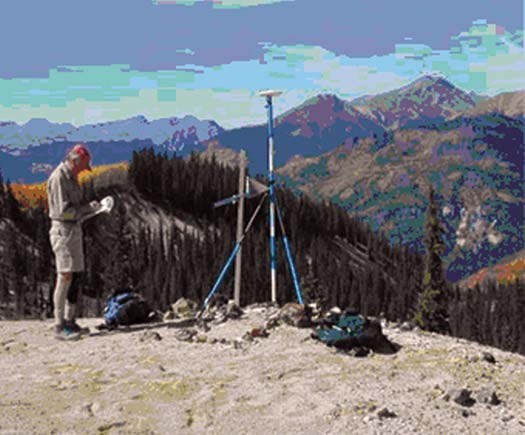
Repeated visits to existing posts using a GPS instrument to establish precise locations can be used for evaluating rate of landslide movement. Accurate GPS measurements can assess both horizontal and vertical displacement. Six sets of 19 GPS observations made between July 1998 and July 1999 showed that the Slumgullion landslide (Figs. 12, 13, and 14), in southern Colorado (Parise et al., 2004), moved throughout the year, but that daily velocities were highly variable on a seasonal basis from <0.001 m per day to 0.024 m per day (Coe et al., 2000a, 2000b).
Equipment and costs. Equipment and installation of posts (and measuring GPS points) is relatively inexpensive, if the visits to the landslide site are made regularly. Stereo aerial photography also requires the establishment of GPS stationary points and analysis of the topographic locations, but this is usually a moderate expense.
Limitations. Actively monitoring landslide movement can be limited on rapidly moving landslides that are not safe to approach. However, other techniques, such as measuring the velocity of moving pieces on top of a debris flow are possible. Based on the cross-channel flow surface angle, radius of curvature of the channel bend, and channel slope, the approximate mean velocity of debris flow can be calculated (Costa, 1984).
Interpretation. Frequent measurement improves the ability to determine the nature of the movement. The rate of landslide movement can be interpreted differently, depending on how often the measurements are conducted. For example, if an earth flow moved 10 m in a month and subsequently stopped moving, and was measured before and after the movement within the one month, then the rate of movement (10 m/30 days) would be classified as “moderate.” However, if the same amount of movement was only measured once that year, then the rate of movement (10 m/365 days) would be classifi ed as “slow” according to landslide velocity classification by Varnes (1978).
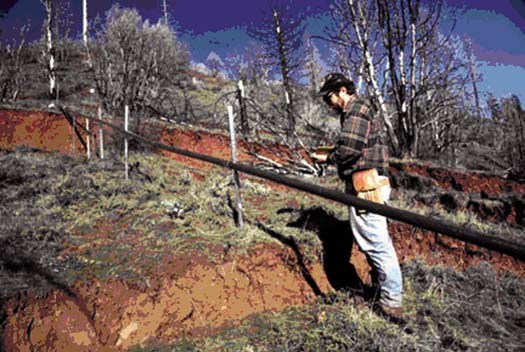
Instruments installed for continuous measuring of landslide movement are more efficient than periodic measurements. If the rate of movement is known to increase regularly, then instability and potential future movement could be assessed for the purposes of issuing landslide hazard warnings. Data can be retrieved by regularly visiting the site or by transmitting it to another location. However, significant disruption, such as splitting of the ground, could destabilize the operation of the extensometer. For very rapidly moving landslides, such as rockfalls, the initial displacement might happen only seconds or minutes before the accelerated landslide failure. Nevertheless, such measurements could provide useful data for warning systems.
Methodology. Installation of extensometers is similar to establishing movement posts except for the wire connection between the landslide and the stable location adjacent to the landslide. For slow-moving landslides, it may be difficult to determine the location for installing a stable base for the extensometer. Additionally, if the ground is generally creeping outside of the landslide, then the measurement of landslide movement will not be accurate. If a transmitting device is installed for conveying the continuous movement, then the landslide movement can be remotely assessed. Otherwise, the landslide site will need to be regularly visited to download the displacement information from the extensometer (Fig. 15).
The USGS also has a cooperative project with the California Department of Transportation (Caltrans) to monitor five active landslide sites (including the Mill Creek landslide) along the Highway 50 corridor. Real-time data from the overall monitoring system, which involves 11 stations and 58 surface and subsurface instruments, are relayed through USGS computers to Caltrans engineers and geologists. These data may provide Caltrans with early notification of landslide activity and may also aid Caltrans engineers in the design of remedial measures to slow or halt active landslides (Reid and LaHusen, 1998). The daily data from one of these landslides are available to the public at http://landslides.usgs.gov/monitoring/hwy50/.
The USGS also installed a real-time monitoring system at the nearby active Cleveland Corral Landslide. A real-time monitoring system provides near-continuous measurements on the hydrologic conditions and ground movement of the landslide. Sensors for the system are installed on the landslide, and the data are transmitted via radio telemetry to USGS computers. Data collected at such a continuous rate and in real-time will greatly increase the understanding of dynamic landslide activity and behavior in the Highway 50 corridor. The amount of downslope movement is recorded by extensometers anchored to the ground surface at the edge of the landslide. Ground vibrations associated with slide movement are monitored by geophones buried within the landslide. Data are sampled from these sensors every second and transmitted to the USGS every 10 minutes. However, data are transmitted immediately in the event of strong ground vibrations associated with massive landslide movement (Reid and LaHusen, 1998).
Timing and frequency. Data are recorded continuously. Equipment and costs. The installation of the extensometers and equipment for continuous transmitting of the landslide movement data are costly and require regular expert examination for necessary maintenance.
Limitations. The recognition of signifi cant landslide hazards makes the application of extensometers and transmitted data important. Landslides posing hazards to buildings and roads illustrate the need for this type of instrumentation and monitoring. If stable reference points cannot be found, however, then extensometers will not provide accurate landslide movement data.
Interpretation. The monitored rates of landslide movement and variable fluctuation of rates are important relative to the type of landslide. Monitoring the initial movement of reactivated landslides is important, especially if the rate of movement rapidly accelerates posing potential hazards.
Level 3: Aerial Photos, LiDAR and InSAR Techniques
Previous landslides and distances of displacement can be roughly ascertained by examining sequences of photographs—historic, aerial, park operation, commercial, and even visitor photographs—that can be calibrated based on recognizable reference points, and/or using GPS measurements. Identifying reference points on photographs and on topographic maps can serve for evaluating landslide displacement using digital elevation models (DEM). Although the precise date of landslide movement cannot be determined from undated landslides in historical photographs, the careful examination of groups of historical photos can show general periods of landslide movement. The more frequently the photos are taken, the more precise the estimated dates of identified landslide movement.
With high precision new image technology such as LiDAR (light detection and ranging), annual images can serve very directly for identifying locations of landslide movement where they might otherwise not have been identifi ed. LiDAR topographic data can be used for: (1) high-quality topographic base information for mapping activities; (2) input for computer algorithms designed to detect land-surface attributes indicative of landslide processes (e.g., McKean and Roering, 2004; McKean et al., 2004); and (3) high-resolution digital elevation models for computing slope stability and potential debris-flow inundation areas. LiDAR can also be used to identify the morphologic signature of shallow landslides that mobilize into debris flows, deep-seated landslide complexes, and the underlying lithologic control on topography. LiDAR can provide detailed topographic data necessary for precise slope stability analyses and subsequent generalization of exportable models. Depending upon the degree of slope, either vertical aerial or horizontal LiDAR coverage may be preferable.
InSAR stands for interferometric synthetic aperture radar, a remote sensing technique using radar satellite images. Those radar satellites (ERS1, ERS2, JERS, IRS, or Radarsat) constantly shoot radar waves toward the earth and record them after they bounce back off Earth’s surface. When the radar satellite revisits the exact same portion of the Earth, the phase image should be identical. If not, then something has been going on. By combining those two images, we can measure how much and where the ground has moved.
Methodology. Photographs and GPS measurements can be useful for some types of slow moving types of landslides, such as earth flows and earth slumps. Rapidly moving landslides, such as rockfalls and debris flows, may not be possible to measure physically because of safety concerns. Here, successive photos can be beneficial, especially if the site cannot be easily accessed. An evaluation of regional landslide susceptibility was performed in Seattle, Washington, using several mapping methods including LiDAR (Schulz, 2005).
Timing and frequency. If the agencies that provide photos or LiDAR coverage are available when requested, clear weather generally determines the timing and frequency of taking imagery. Note that for dormant landslides, aerial photos are generally only worthwhile to determine yearly movement.
Equipment and costs. Obtaining airphotos, LiDAR, or InSAR coverage can be relatively expensive, depending upon the relative size and scale of the requested imagery. For example, in 2005 for landslide examination of the Ventura County in southern California, the USGS obtained research-grade, 1 m LiDAR spacing of ~210 km2 for approximately $56,000. Generally, smaller LiDAR coverage is more costly per square kilometer. For the same general region, stereo color aerial photographs at the scale of 1:12,000 cost about $6,000. Ground-based horizontal LiDAR is also possible at even finer scales, but cannot cover large regions. Still, it can be very useful for taking imagery of individual landslides.
Limitations. LiDAR is available at 1 m spacing, which can provide evaluation of recognized landslide movement on a relative scale of meters. If regions are thickly vegetated, LiDAR can generally still provide accurate recognition of the ground surface. If the ground surface is recognizable, then ground surface topographic maps can be accurately developed.
Interpretation. Aerial vertical LiDAR imagery does indicate topographic variation, but does not show variation like color photography. Consequently, the same landslide imagery features are not necessarily recognizable in both color aerial photos and LiDAR. For example, some types of landslides, such as debris flows, show more distinctive color differences in infrared photography than adjacent land with no landslides (Wieczorek et al., 2000).
Additional Information
The different mechanisms of initial landslide movement require different monitoring. For example, rockfalls may develop only minimal instantaneous movement before sudden catastro-phic collapse, whereas earth slumps may continue to move slowly at a similar speed for days, weeks, or even months. A relatively simple method of measuring prominent landslide movement can be obtained by using GPS monument points that can be periodically revisited. A slightly more detailed method is using extenso-meters which can continuously register surface slope movement. A potential problem with extensometer instrumentation is possible disruption of the cable by animals or falling vegetation. A more comprehensive measurement technique utilizes installing a pipe sunk into the ground through the sliding plane of the landslide, so that a lowered instrument can periodically measure the pipe’s deflection. This device, known as an inclinometer, requires access for drilling which is not always possible because of the steep, irregular landslide slopes. The new technique of InSAR, which utilizes repeated satellite imagery to determine displacement of established reflective ground points, is a sophisticated method which can be used for determining detailed landslide movement remotely on a regular time basis.
Vital Sign 5: Regional Assessment of Landslide Hazards and Risks
Preparation of landslide inventories and mapping of regional landslide events based on historically documented and recently observed landslides can be a prime tool for assessing landslide hazards and risks (Figs. 16 and 17).
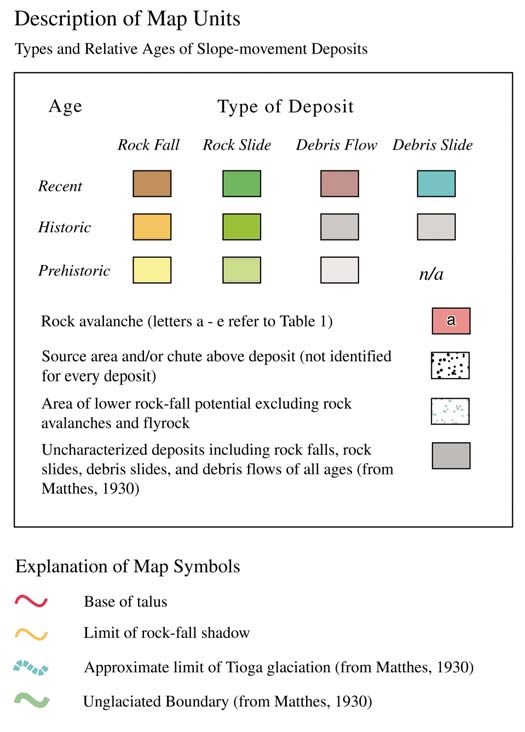
Compilation of landslide inventory maps is an initial step in the evaluation of regional landslide hazards. Although a landslide inventory map does not necessarily indicate the frequency of landslide activity, the specific types of landslide, or velocity or size, it does show where landslides have occurred in the past, and consequently where landslides might occur in the future under similar conditions.
One of the first comprehensive regional investigations of landslides resulting in a hazard assessment including inventory maps was made along the Columbia River in Washington State (Jones et al., 1961). Geologic investigations of more than 300 landslides along 320 km of the Columbia River valley were conducted intermittently from 1942 to 1948 and continuously from 1948 to 1955, in order to assess the potential instability of land near dams that were being constructed. Inventory maps identified different landslide-age categories such as “recent” and “prehistoric” or “younger” and “older” landslides (Pomeroy, 1977). These maps, ranging in scale from 1:4,800 to 1:62,500, were largely produced from photo interpretation and field investigations. Consequently, the scale of available aerial photography and the scale of the maps determined the size of individual landslides that were depicted. The smaller scale geologic maps were more general in representing areas with landslide deposits. In some cases, surficial geologic maps were prepared which identified landslide deposits, as well as other types, such as glacial deposits (Madole, 1982).
A more direct assessment of landslide hazard is provided by landslide susceptibility maps. Although landslide susceptibility maps, as in San Mateo County, California (1:62,500) (Brabb et al., 1972), Oakland, California (1:50,000) (Pike et al., 2001), and in Butler County, Pennsylvania (1:50,000) (Pomeroy, 1977), do not directly assess the frequency or probability of landslides, the representation of areas subject to landslide hazards is useful for local and regional governments. For improved landslide hazard assessment, details regarding the type of slope movement as well as the recent movement are important on landslide inventory maps. A classification system for the type(s) of individual landslides first developed by Heim (1932) was subsequently refined (Varnes, 1978; Hutchinson, 1968; Cruden and Varnes, 1996).
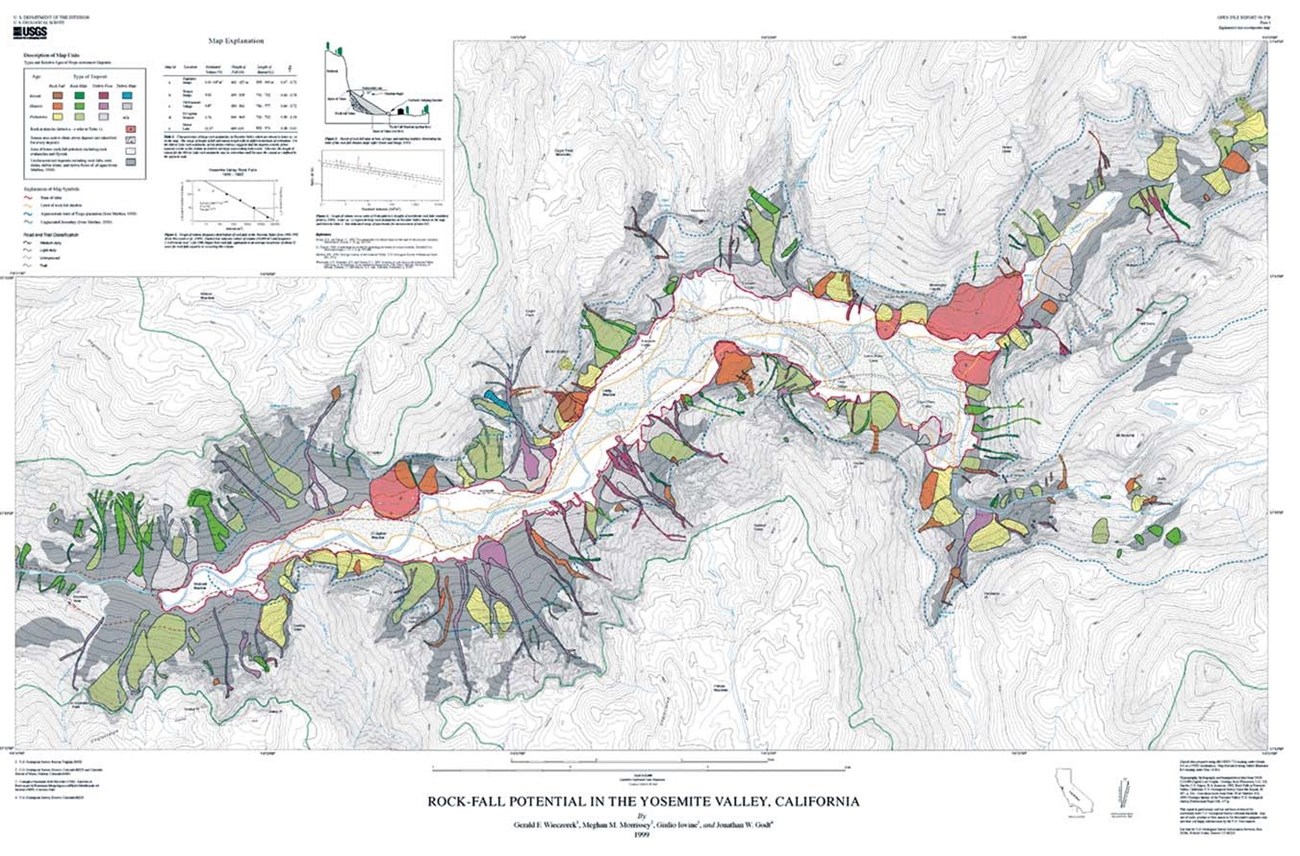
The development of landslide inventory maps, susceptibility maps, and regional probabilistic evaluations of landslides are not effective in reducing hazards unless the information is used by local or regional government organizations in the interests of public safety. To ascertain the rockfall and other landslide hazards in Yosemite National Park, the USGS and the U.S. National Park Service have compiled an inventory and map of historical landslides (Wieczorek et al., 1992). An attempt to assess rockfall hazard based on the “shadow angle” was completed by Wieczorek et al. (1999) and incorporated into the Yosemite Valley Plan prepared by the National Park Service (2000). Measurements of the talus slopes of rockfall deposits and larger individual rocks that occasionally travel beyond the end of the talus can be used for an evaluation of the rockfall hazard (Hungr and Evans, 1988; Evans and Hungr, 1993).
Timing and frequency. The identification of landslides and preparation of a landslide inventory can naturally change with time as more landslide events occur, especially after major storm events. However, a landslide susceptibility map evaluating where landslides can occur may not change dramatically through time and therefore can be a longer-term tool for hazard identification. In order to evaluate landslide hazards and risk, a significant
mount of previous investigation and analysis of prehistoric and historic landslide events in a region is necessary. Consequently, a minimum of several months of continuous investigation would be necessary. The presence of previously documented landslides and the availability of regional aerial photographs showing historic frequency of landslide events are necessary, and if available, can expedite the evaluation of landslide hazard and risk.
Equipment and costs. The cost of preparing landslide inventory and susceptibility maps depends upon the size of the region and the number of landslides that need to be examined and analyzed. The more frequent and larger scale of available aerial photos makes accuracy and identification more precise for preparation of the landslide inventory. More frequent evaluation of active moving landslides also provides better information for evaluating the landslide susceptibility of the terrain.
Limitations. Although landslides may regularly occur in some regions due to seasonal rainfall, storms, earthquakes, or even volcanic activity, if these events are extremely large or strong, then the magnitude of the generated landslides can be unusually numerous and large, and consequently have major impacts that cannot generally be anticipated, even if inventory and susceptibility maps are prepared. For example, a storm on 14–16 December 1999 caused catastrophic landslides and flooding along a 40 km coastal strip north of Caracas, in the northern coastal state of Vargas, Venezuela (Fig. 18). The debris flows and floods, which destroyed or damaged more than 8,000 individual residences and 700 apartment buildings, consequently killed 15,000 people. Roads, telephone, electricity, water and sewage systems were severely disrupted. The debris flows and floods inundated coastal communities on alluvial fans at the mouths of a coastal mountain drainage network and destroyed property estimated at more than $2 billion. Beginning in early December of 1999, the interaction of a cold front with moist southwesterly flow from the Pacific Ocean toward the Caribbean Sea resulted in an unusually wet period over coastal northern Venezuela. Moderately heavy amounts of rainfall during the first week of December were followed by extremely heavy rainfall beginning on 14 December and lasting through 16 December. The total 3-day rainfall along the coast for a 52 hour span on 14–16 December totaled 911 mm. These amounts and intensities were highly exceptional; the daily totals (380.7 and 410.4 mm) for 15 and 16 December at Maiquetia exceeded the 1000 year probability for this location (Wieczorek et al., 2001, 2002; Larsen and Wieczorek, 2006).
Interpretation. Preparing landslide inventories can be fairly standard procedures, although recognizing prehistoric landslides requires experience. Evaluating landslide susceptibility is not a uniform methodology, but nevertheless is an important procedure to identify potential landslide areas. For example, evaluating landslide susceptibility can be significantly different for landslides generated by severe rainstorms than by earthquakes. For example, in San Mateo County, California, an earthquake landslide susceptibility map (Wieczorek et al., 1985) is significantly different from a rainfall induced landslide susceptibility map (Brabb et al., 1972). Other methods of earthquake landslide susceptibility analyses have also been developed (Miles and Keefer, 2000; Wasowski et al., 2000).
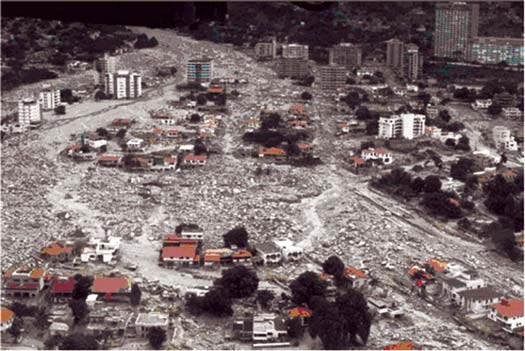
Photograph by Lawson Smith, US Army Corps of Engineers.
Assessing the combined volume, velocity, and distance of different types of landslide is an important factor for evaluating landslide hazard and risk. Rapidly moving landslides that travel long distances, typically debris flows, debris avalanches, rockfalls, and rock avalanches, can occasionally reach unexpected areas and cause major damage. Physical measurements and analysis of individual landslides are important.
Methodology, timing, and frequency. The most beneficial time for gathering accurate information on landslide volumes, velocity and travel distance is immediately or soon after landslides have occurred. For example, soon after a severe storm in June 1995 triggered as many as ~1000 debris flows in Madison County, Virginia, critical information on debris flow volume, velocity, and travel distance was collected (Wieczorek et al., 2000). Additionally, the documented times of landslide movement was useful for analysis of how local rainfall could trigger landslides (Morrissey et al., 2001).
Equipment and costs. Physical measurement of landslide volume, velocity, and distance of movement may be obtained using a variety of equipment, and costs depend on the size and depth of the landslide. Drilling of landslides can be expensive, and measuring the scale of the landslide surface area using tapes or GPS equipment is more direct. The depth can then be estimated to calculate the range of possible landslide volume, as for the large landslide above Tidal Inlet, Alaska (Wieczorek et al., 2003). Determining the velocity of landslides is frequently not possible during movement unless instruments have already been installed. If pre- and post-event photographs can be used to evaluate the movement of the landslide, then aerial photos can be useful and inexpensive.
Limitations. It can be physically diffi cult to observe and accurately measure the velocity of moving landslides, particularly during severe storms, earthquakes, or volcanic events. If instrumentation has already been installed, then measurement of movement is possible (Reid and LaHusen, 1998). Determining the volume of a landslide is sometimes easily possible, if the mass is exposed on the ground surface, as is typical for a rockfall or debris flow. However, the volume of moving landslides that remain entirely or partially beneath the ground surface is not easy to determine without drilling, and can frequently only be estimated.
Interpretation. The risk of potential landslides needs to be interpreted based on the combination of volume, velocity, and travel distance relative to the structures, roads, or other features that are capable of being damaged. The other necessary interpretation is how specific features, such as particular buildings, are likely to be damaged by certain types of landslides with rapid velocities and/or large volumes. Relatively shallow debris flows may travel around structures, if they have been strongly constructed. On the other hand, rapidly moving massive rockfalls, and sometimes individual falling rocks, can severely impact and destroy even well-built structures.
For example, a recent rockfall hazard and risk assessment conducted in Uinta National Forest, Utah (Coe et al., 2005) measured rockfall frequency and rock-mass quality. Rockfalls occurred most frequently from steeply dipping bedrock, and least frequently from shallow-dipping bedrock. Rock-mass quality measurements, information on historical rockfalls, and engineering-geologic mapping indicated that rockfall susceptibility correlated with the degree of tectonic deformation (folding) of cliff forming, limestone bedrock. Tightly folded, steeply dipping bedrock was very susceptible to rockfall initiation, whereas broadly folded, gently dipping bedrock was moderately susceptible to rockfall initiation. Based on the freshness of talus, degree of soil development, maturity of vegetation, and historical scars of trees and asphalt pavement, rockfall travel paths down from cliffs were identified as the primary paths or secondary paths. Primary paths down primary paths occur with a high frequency of rockfalls. Secondary paths occur with a moderate frequency.
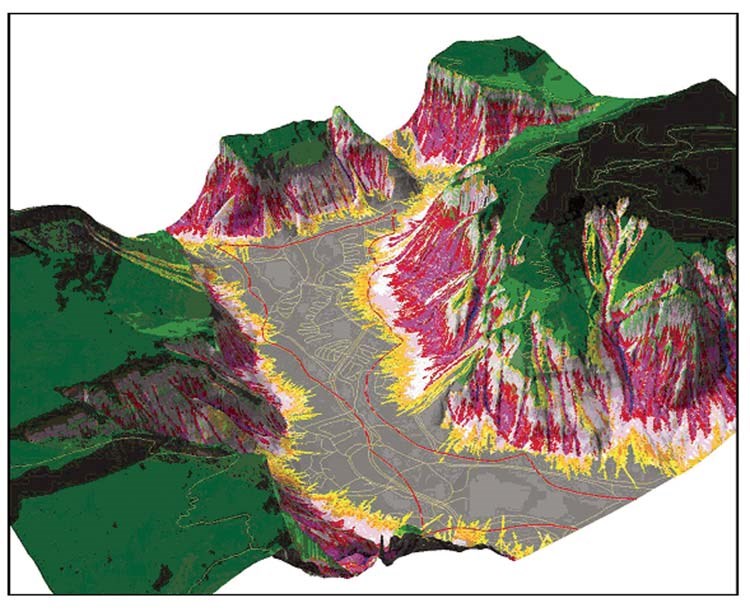
Guzzetti et al., 2003
Landslide modeling techniques have developed over the past 100 years. One of the first major landslide investigations followed a large, rapidly moving catastrophic landslide that occurred in Switzerland (Heim, 1882, 1932).
Methodology. A rockfall hazard and risk assessment involving velocity and travel distance was completed in Yosemite Valley, California (Fig. 19) (Guzzetti et al., 2003) using the STONE computer program (Guzzetti et al., 2002). STONE is a physically based, rockfall simulation computer program that computes three-dimensional rockfall trajectories starting from a digital elevation model (DEM), the location of potential rockfall release points, and maps of the dynamic rolling friction coefficient, and of the coefficients of normal and tangential energy restitution. For each DEM cell, the software calculates the rockfall velocity and the maximum flying height of the rock. The availability of historical rockfalls mapped in detail allowed the program results to be calibrated to the model parameters.
Timing and frequency. Because the application of landslide modeling techniques requires detailed physical data for specific sites, the necessary information must be accurately collected before the modeling is attempted. Consequently, the techniques cannot be randomly applied without extensive prior field work and technical analysis.
Equipment and costs. The application of the existing modeling techniques is not expensive, but the collection of the necessary field data, including aerial photography and LiDAR imagery, can be relatively expensive. Of course, since only a few types of landslides have available models that can provide the necessary information for assessing hazards and risks, it would be more expensive to develop new hazard assessment methods.
Limitations. The input data required by STONE are similar to the information required by other rockfall simulation programs (e.g., Descouedres and Zimmermann, 1987; Fornaro et al., 1990; Pfeiffer et al., 1991; Spang and Sonser, 1995; Jones et al., 2000).
The location of the detachment areas of rockfalls, the number of boulders launched from each detachment area, the starting velocity and the detachment angle of the rockfall, the velocity threshold below which the boulder comes to rest, and the coefficients of dynamic rolling friction angle and of normal and tangential energy restitution are used to simulate the loss of energy where the block is rolling and at the impact points. STONE differs from other rockfall simulation computer programs because topography is provided by a DEM, and not as pre-defined slope profiles. Values for the coefficients used for modeling the loss of energy at impact points and for rolling are provided in a spatially distributed geographical form. As a result, the outputs produced by STONE are also spatially distributed. STONE is unable to consider the volume and mass of the falling boulder, the shape of the block (e.g., cube, slab, cylinder, disk, irregular), or the tendency of rockfalls to split during successive impacts.
Interpretation. The evaluation and detailed mapping of areas within national parks most frequently experiencing historical and recent landslides can be used directly as an indication of hazards. However, because different types of landslides can occur within a national park, it will most likely be important to analyze landslide susceptibility depending upon the different types of landslides experienced within a specific park. Numerical models can be used for evaluating possible distance of different types of landslides depending upon volume, types of materials, and degree of slope. For example, various debris-flow modeling techniques have been developed such as the one dimensional DAN (Dynamic Analysis) model (Hungr, 1995) and the twodimensional FLO-2D model (O’Brien et al., 1993) which predict and compare the runout distance and the velocity of debris flows. For showing potential impacts of landslides from steep cliffs and existing release points, the STONE model can be effective (Guzzetti et al., 2003)(Fig. 19).
Additional Information
The frequency of different sizes (volumes) of landslides and their associated travel distance can be statistically evaluated for hazards and risks. Some published books, such as Landslide Hazard and Risk (Glade et al., 2005), include chapters discussing conceptual models, evaluation, management, and solutions for landslide risks. General references of this type are included in the Further Reading section at the end of this chapter.
STUDY DESIGN
The potential hazard and risk of slope movements should be evident because of historic damage to structures, equipment and roads, as well as injuries and fatalities. The frequency and seriousness of the hazards and risks does influence the relative number and professional qualification necessary for assessment. Size and resources are not specifically relative to the damage and risk of slope movements. The specific costs required for assessment of the hazard and risk of slope movements cannot be easily evaluated in advance. The following section provides specific examples of recent major studies.
CASE STUDIES
Landslides have been scientifically examined in many locations within the last several decades. In 1982, intense rainfall lasting for ~32 hours in the San Francisco Bay region of California triggered more than 18,000 mainly shallow landslides in soil and weathered rock (Ellen and Wieczorek, 1988). Documentation of triggering times for many of these landslides permitted identification of landslide-triggering rainfall thresholds for the San Francisco Bay region (Cannon and Ellen, 1985). A real-time landslide warning system was established and operated by the USGS and the National Weather Service between 1986 and 1995 (Wilson and Wieczorek, 1995; Wilson, 2005). Using a real-time rainfall monitoring system and National Weather Service satellite-based quantitative rainfall forecasts, regional landslide warnings were issued during storms in 1986, 1991, 1992, 1993, and 1995. As a verification of the rainfall thresholds of Cannon and Ellen (1985), the times of landslide hazards in the storms of February 1986 were found to correspond with documented times of shallow landslides (Keefer et al., 1987). The strong El Niño rainfall season of 1997–1998 caused more than $150 million in landslide damage in the ten-county San Francisco Bay region (Godt, 1999; Brabb et al., 2002). Maps were prepared showing the locations of damaging landslides within the ten counties (Godt, 1999). Rainfall thresholds for triggering debris flows have been identified in a number of other regions in the United States, including Puerto Rico (Jibson, 1989; Larsen and Simon, 1993), Hawaii (Wilson et al., 1992), the Blue Ridge of central Virginia (Wieczorek et al., 2000), and Seattle, Washington (Chleborad, 2000, 2003).
A debris slide called the Sentinel landslide occurred in the spring of 1995 in Zion National Park, Utah, and dammed the North Fork of the Virgin River. The subsequent breaching of the dam caused flooding that eroded 180 m along the Valley Floor Highway and damaged underground facilities buried beneath the road. The damage left the Zion Lodge inaccessible, isolating 450 people for several days (Anderson et al., 2000). This slope movement represented the reactivation of a dormant landslide that had experienced similar reactivation and movement in 1923 and 1941 (Grater, 1945). This reactivation was caused by toe erosion from the river along the base of the old slide mass and by rainfall saturation of shale and mudstone within the disrupted landslide mass (Wieczorek and Schuster, 1999).
During the last week of June, 1995, an intense, wet, tropical storm struck the Blue Ridge of Madison County, central Virginia, including parts of Shenandoah National Park, triggering as
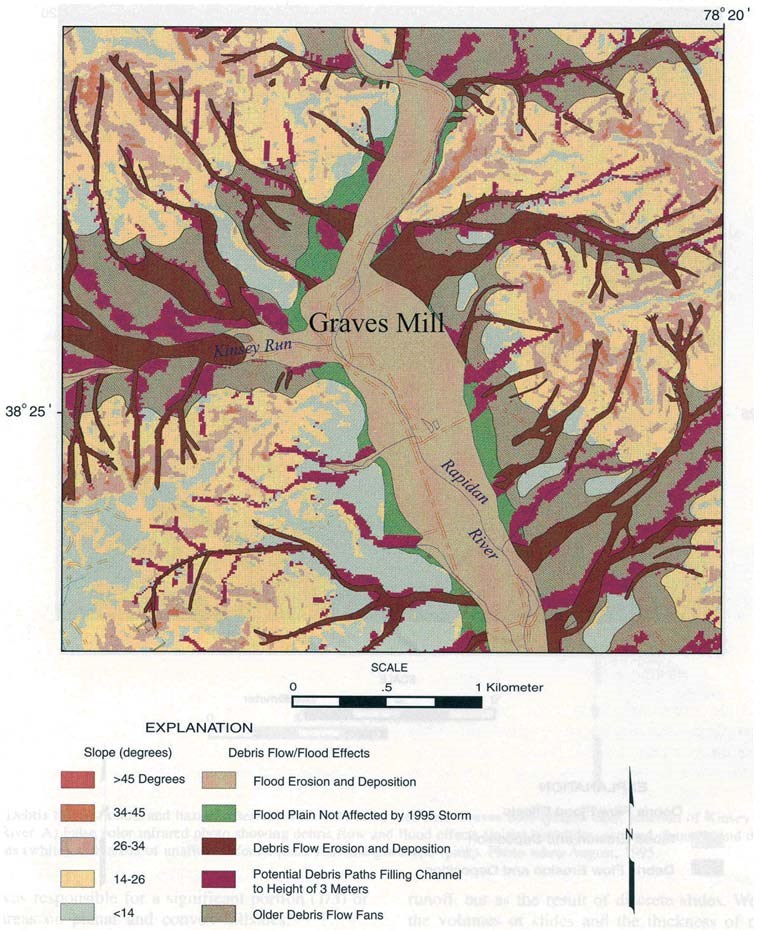
many as 1,000 debris fl ows on steep slopes within deeply weathered granite bedrock. The largest debris flow, with a volume of ~57,000 m3, descended ~400 m vertically and traveled ~3 km horizontally before entering the Kinsey Run stream (Fig. 20). While traveling downhill, this large debris flow cleared a path of vegetation from 30 to 100 m wide and deposited sediment more than 1 m thick, along with large boulders on the lower part of a less steep fan over a maximum width of ~200 m. Estimated velocities of debris flows ranged from ~8 m per second, according to eyewitness accounts, to as great as 24 m per second (Wieczorek et al., 2000) from calculations of mean velocity based on curves of the debris flow channel path (Johnson, 1984). Because many large debris flows initiated in the Shenandoah National Park and subsequently flowed downstream beyond the park boundaries into private property, there was the possibility of the NPS being assessed for damages. The debris flows in this region were photographed and subsequently examined and mapped for evaluation of future potential landslide hazards (Fig. 20) (Morgan et al., 1999).
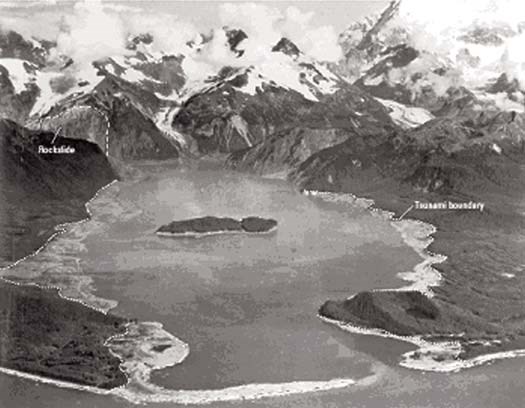
In July of 1958, a magnitude 7.9 earthquake triggered a rapidly moving large rockslide into Lituya Bay in Glacier Bay National Park, Alaska (Miller, 1960). The impact of the rockslide into the bay initiated a tsunami that ran upward 524 m across the shore on the opposite hillside (Fig. 21) and sent a 30-m-high wave beyond Lituya Bay, sinking two of three fishing boats and killing two people (Miller, 1960).
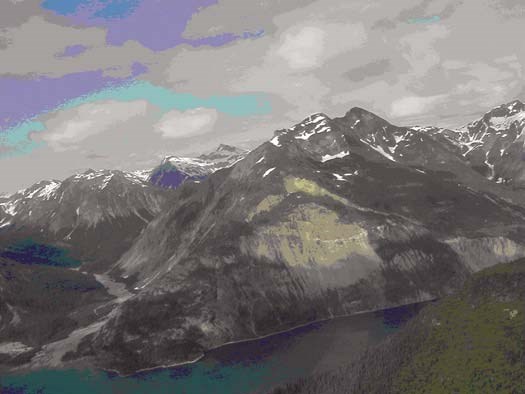
Another slowly moving large landslide, most likely a rotational rock slump, has been recognized above Tidal Inlet in Glacier Bay National Park. This slump could trigger a large tsunami (Wieczorek et al., 2003; Geist et al., 2003). GPS monitoring of the landslide movement established through a joint effort of the NPS, USGS, and University of Alaska, found southerly horizontal displacement of 7.9 cm (±1.5 cm) between July 2002 and August 2004 (Motyka et al., 2004). Although this movement is extremely slow, the continuing instability creates a potentially hazardous condition with the onset of severe earthquakes, intense rain storms, or rapid heavy snowmelt (Fig. 22).
These landslides show the variety and power of unpredictable natural events. In each case, the history and inventory of slope movement contributed to evaluating future potential hazard and risk. A working relationship between on-the-ground NPS field personnel and USGS and university scientists contributed to monitoring and evaluation. Examples of documented historic landslides in Yosemite National Park, California, will be discussed subsequently as case history examples of monitoring slope movements.
Following the 1980 Mammoth Lake, California, earthquakes, which triggered nine rockfalls and rockslides and seriously injured two people, the U.S. Geological Survey, in conjunction with the National Park Service, began compiling an inventory of landslides in Yosemite National Park. Recent landslides, previous historic landslides and prehistoric landslides were physically examined as much as possible. As many as 540 reported historic slope failures between 1857 and 2004 have now been documented in Yosemite National Park, which resulted in a total of 14 deaths and at least 62 injuries. Many more slope failures undoubtedly occurred that were not reported. A continuing inventory of the common types of landslides in Yosemite has been compiled, documenting information on the date, size, location, triggering event, damage, and description of individual landslides (Wieczorek et al., 1992; Wieczorek and Snyder 2004). New landslide failures are compared with old events in the inventory for location, cause and trigger, frequency, size, and impacts.
At half past two o’clock of a moonlit morning in March, I was awakened by a tremendous earthquake…and I ran out of my cabin, both glad and frightened, shouting, “A noble earthquake! A noble earthquake!” feeling sure I was going to learn something. The shocks were so violent and varied, and succeeded one another so closely, that I had to balance myself carefully in walking as if on the deck of a ship among waves, and it seemed impossible that the high cliffs of the Valley could escape being shattered. In particular, I feared that the sheer-fronted Sentinel Rock, towering above my cabin, would be shaken down, and I took shelter back of a large yellow pine, hoping that it might protect me from at least the smaller outbounding boulders…
It was a calm moonlight night, and no sound was heard for the first minute or so, save low, muffled, underground, bubbling rumblings, and the whispering and rustling of the agitated trees, as if Nature were holding her breath. Then suddenly, out of the strange silence and strange motion there came a tremendous roar. The Eagle Rock on the south wall, about half a mile up the Valley, gave way and I saw it falling in thousands of the great boulders I had long been studying, pouring to the Valley floor in a free curve luminous from friction, making a terribly sublime spectacle—an arc of glowing, passionate fire, fifteen hundred feet span…
The first severe shocks were soon over, and eager to examine the newborn talus I ran up the Valley in the moonlight and climbed upon it before the huge blocks, after their fiery flight, had come to complete rest. They were slowly settling into their places, chafing, grating against one another, groaning, and whispering; but no motion was visible except in a stream of small fragments pattering down the face of the cliff. A cloud of dust particles, lighted by the moon, floated out across the whole breadth of the Valley, forming a ceiling that lasted until after sunrise, and the air was filled with the odor of crushed Douglas spruces from a grove that had been moved down and mashed like weeds.
At 12:16 p.m. on 16 November 1980, a thin, tall 1500 m3 flake of rock broke loose and fell from a steep rock wall above the trail to Upper Yosemite Fall. The ensuing rockfall destroyed ~800 m along the trail, killed three hikers, and injured another 19 people. The minimum temperature during the three preceding days had fluctuated above and below freezing, and it had rained several days before. The rock pendant above the trail had been heard cracking the previous day, but the noise was mistaken for gunfire. Half an hour before the rock broke, more apparent “shots” were heard by hikers. Subsequent inspection of the release point on the rock wall revealed patterns of roots previously behind the flake indicating that water had access through the jointed rock mass and that ice could have wedged behind the flake. The freeze-thaw process is the most likely triggering event because the rockfall occurred after several days of rain and fluctuating temperatures. Observers realized after the failure that the mistaken “gun shots” were actually warnings of a developing pattern, prompting close attention to cracks and rock noise in later events.
Although the number of historical landslides triggered by earthquakes in Yosemite has been relatively small, earthquakes have accounted for the greatest cumulative volume. At least ten earthquakes have been strongly felt in Yosemite between 1872 and 2004, six of which have triggered rockfalls or rockslides. Using USGS seismic data, the potential for landslides in Yosemite from earthquakes of certain magnitude and with epicenters at particular distances from Yosemite can be roughly determined. The historical record of seismically induced landslides from earthquakes in Yosemite fits within previously observed worldwide upper bounds of earthquake magnitude and distance for triggering similar types of landslides (Keefer, 1984; 1993; 2002).
From the cliffs of Middle Brother, a closely observed large rockfall occurred without an obvious triggering event. On 10 March 1987, National Park Service officials noticed small rockfalls and audible popping noises from Middle Brother. As small rockfalls increased, the NPS closed nearby roads and trails. Later that day, two huge rockfalls from the face of Middle Brother spread rapidly across the talus cone, covered Northside Drive, and sent a few boulders across the Merced River. The combined rockfall volume, estimated at 1.85 million tons, is the largest recorded rockfall event in Yosemite National Park. Because smaller rockfalls continued for several months at this site, Northside Drive was not reopened until the small rockfalls generally ceased in early July 1987. Reopening of the road was based on the pattern of rockfall noise monitored 24 hours a day over several months to determine relative cliff stability (Wieczorek et al., 1995).
The landslide monitoring data collected within Yosemite National Park has provided several types of useful information related to the climatic conditions that can trigger landslides. The collection of rainfall data measured by the National Weather Service within Yosemite for the documented landslide events has roughly characterized thresholds of total storm rainfall that relate to the number of expected landslide events dependent upon the magnitude of the rainstorm. For example, the storm of 17–27 December 1955 which totaled nearly 600 mm (23.5″), including 176 mm (6.92″) on the greatest single day of rainfall, triggered a combination of ten major rockslides, debris slides, and debris flows. By comparison, the 30 December–3 January 1997 storm, with a total of 263 mm (10.38″) and 97 mm (3.83″) on the greatest single day of rainfall, caused flooding throughout Yosemite Valley, but triggered very few slope failures. More difficult is determination of how snowmelt or the freeze-thaw cycles have triggered landslides (Wieczorek and Jäger, 1996).
Since 1980, there have been on average ~10 reported slope failures per year in Yosemite National Park. Nevertheless, it is not possible to predict exactly the time, place, or size of landslides. Only general hazard warning steps can be taken until an emergency occurs or an imminent hazard can be clearly defined. The National Park Service (2000) developed a Yosemite Valley Plan restricting future development in rockfall areas shown on USGS landslide inventory maps (Fig. 16). The collected landslide inventory information has been utilized to evaluate the hazards that are posed within Yosemite. The distance that landslides have traveled and deposited piles of talus have been mapped and characterized as a hazard boundary. However, the existing landslide deposits are not the only indication of hazardous regions because larger collapses on previously unfailed cliffs can certainly occur in the future. In addition, the prospective distance that individual rocks have traveled beyond the talus have been identified as the “rockfall shadow” and were used to recognize potential travel of large individual rocks beyond the talus edge (Wieczorek et al., 1999).
CONCLUSIONS
A basic inventory of past slope movements can show which areas, facilities and operations are more susceptible to landslide impacts than others. An inventory permits comparison and evaluation of relative potential under different circumstances. Combined with mapping talus or landslide-altered slopes, an inventory can show where higher and lower rates of potential rockfall might be. Though slope movement remains largely unpredictable, these conclusions can still relate directly to potential hazardous regions. Despite the complex scientific methods occasionally described within this text, many of the important issues of monitoring landslide movement can be conducted by basic monitoring procedures. Agency cooperation with scientists from universities, state surveys, or the USGS in conducting and reviewing landslide monitoring would produce more complete and effective assessment of landslide hazards and risks.
REFERENCES CITED
Anderson, S.A., Williams, J.L., and Greenwell, S., 2000, Sentinel Landslide, Dam Breach, and Road Reconstruction Zion National Park, Utah, in Bromhead, E., Dixon, N., and Ibsen, M-L., eds., Landslides in research, theory, and practice: Proceedings of the 8th International Symposium on Landslides held in Cardiff on 26–30 June 2000: Thomas Telford, London, p. 57–64.
Baum, R.L., and Fleming, R.W., 1996, Kinematic studies of the Slumgullion landslide, Hinsdale County, Colorado, in Varnes, D.J., and Savage, W.Z., eds., The Slumgullion earth flow: A large-scale natural laboratory: U.S. Geological Survey Bulletin 103, p. 9–12.
Brabb, E.E., Pampeyan, E.H., and Bonilla, M.G., 1972, Landslide susceptibility in San Mateo County, California: U.S. Geological Survey, Miscellaneous Field Studies Map MF-360, scale 1:62,500.
Brabb, E.E., Howell, D.G., and Cotton, W.R., 2002, A thumbnail sketch of what governments around the world are doing to reduce the consequences of landslides, in Proceedings of the Tenth International Conference and Fieldtrip on Landslides (ICFL)/Polish Lowlands-Carpathians-Baltic Coast, Poland, 6–16 September 2002, p. 15–33.
Cannon, S.H., and Ellen, S.D., 1985, Rainfall conditions for abundant debris avalanches, San Francisco Bay region, California: California Geology, v. 38, no. 12, p. 267–272.
Chleborad, A.F., 2000, A method for anticipating the occurrence of precipitation-induced landslides in Seattle, Washington: U.S. Geological Survey Open-File Report 00-469, 29 p.
Chleborad, A.F., 2003, A preliminary evaluation of a precipitation threshold for anticipating the occurrence of landslides in the Seattle, Washington, area: U.S. Geological Survey Open-File Report 03-463. http://pubs.usgs.gov/of/2003/ofr-03-463/ (accessed 3 February 2009).
Chleborad, A.F., Ellis, W.L., and Kibler, D., 1997, Results of site investigation and instrumentation of the Keno Gulch landslide/debris-fl ow source area, Aspen, Colorado: U.S. Geological Survey Open-file Report 97-717, 17 p.
Coe, J.A., Godt, J.W., Ellis, W.L., Savage, W.Z., Savage, J.E., Powers, P.S., Varnes, D.J., and Tachker, P., 2000a, Seasonal movement of the Slumgullion landslide as determined from GPS observations, July 1998–July 1999: U.S. Geological Survey Open-fi le Report 00-0101.
Coe, J.A., Godt, J.W., Ellis, W.L., Savage, W.Z., Savage, J.E., Powers, P.S., Varnes, D.J., and Tachker, P., 2000b, Preliminary interpretation of seasonal movement of the Slumgullion landslide as determined from GPS observations, July 1998–July 1999: U.S. Geological Survey Open-file Report 00-0102.
Coe, J.A., Harp, E.L., Tarr, A.C., and Michael, J.A., 2005, Rock-Fall Hazard Assessment of Little Mill Campground, American Fork Canyon, Uinta National Forest, Utah: U.S. Geological Survey Open-fi le Report 2005-1229.
Costa, J.E., 1984, Physical geomorphology of debris fl ows, in Costa, J.E., and Fleisher, P.J., eds., Developments and Applications of Geomorphology: Springer-Verlag, p. 268–312.
Cruden, D.M., and Varnes, D.J., 1996, Landslide Types and Processes, in Turner, A.K., and Schuster, R.L., eds., Landslides: Investigations and Mitigation: Transportation Research board, Special Report 247, Chapter 3, p. 36–75.
Descouedres, F., and Zimmermann, T., 1987, Three-dimensional dynamic calculation of rockfalls, Proceedings 6th International Congress of Rock Mechanics, Montreal, Canada, p. 337–342.
Eaton, L.S., Morgan, B.A., Kochel, R.C., and Howard, A.D., 2003, Quaternary deposits and landscape evolution of the central Blue Ridge of Virginia: Geomorphology, v. 56, p. 139–154, doi: 10.1016/S0169-555X(03) 00075-8.
Ellen, S.D., and Wieczorek, G.F., eds., 1988, Landslides, floods, and marine effects of the storm of January 3–5, 1982, in the San Francisco Bay region, California: U.S. Geological Survey Professional Paper 1434, 16 chapters, 310 p.
Evans, S.G., and Hungr, O., 1993, The assessment of rockfall hazard at the base
of talus slopes: Canadian Geotechnical Journal, v. 30, p. 620–636, doi: 10.1139/t93-054.
Fornaro, M., Peila, P., and Nebbia, M., 1990, Block falls on rock slopes application of a numerical simulation program to some real cases, in Price, D.G., ed., Proceedings, 6th International Congress, IAEG, Amsterdam: A.A. Balkema, Rotterdam, p. 2173–2180.
Geist, E.L., Matthias, J., Wieczorek, G.F., and Dartnell, P., 2003, Preliminary hydrodynamic analysis of landslide-generated waves in Tidal Inlet, Glacier Bay National Park, Alaska: U.S. Geological Survey Open-File Report 03-411, 20 p.
Glade, T., Anderson, M., and Crozier, M.J., eds., 2005, Landslide hazard and risk: Chichester, John Wiley and Sons, 802 p.
Glenn, N.F., Streutker, D.R., Chadwick, D.J., Thackray, G.D., and Dorsch, S.J., 2006, Analysis of LiDAR-derived topographic information for characterizing and differentiating landslide morphology and activity: Geomorphology, v. 73, p. 131–148, doi:10.1016/j.geomorph.2005.07.006.
Godt, J.W., ed., 1999, Maps showing locations of damaging landslides caused by El Nino rainstorms, winter season 1997–1998, San Francisco Bay region, California: U.S. Geological Survey Miscellaneous Field Studies Maps MF-2325-A-J, scale 1:125,000.
Grater, R.K., 1945, Landslide in Zion Canyon, Zion National Park, Utah: The Journal of Geology, v. 53, p. 116–124.
Guzzetti, F., Crosta, G., Detti, R., and Agliardi, F., 2002, STONE: a computer program for the three-dimensional simulation of rock-falls: Computers & Geosciences, v. 28, no. 9, p. 1079–1093, doi: 10.1016/S0098-3004(02) 00025-0.
Guzzetti, F., Reichenbach, P., and Wieczorek, G.F., 2003, Rockfall hazard and risk assessment in the Yosemite Valley, California, USA: Natural Hazards and Earth System Sciences: European Geophysics Union, v. 3, p. 491–503.
Harp, E.L., and Noble, M.A., 1993, An engineering rock classifi cation to evaluate seismic rock-fall susceptibility and its applications to the Wasatch Front: Association of Engineering Geologists Bulletin, v. 20, p. 293–319.
Heim, A., 1882, Der Bergsturz von Elm: Zeitschrift der Deutschen Geologischen Gesellschaft, v. 34, p. 74–115.
Heim, A., 1932, Bertsturz und Menschenleben, Beiblatt zur Vierteljahrsschrift der Naturforschenden Gesellschaft in Zurich, v. 77, 217 p. (Translated by
N. Skermer under the title Landslides and Human Lives, BiTech Publishers, Vancouver, British Columbia, 1989, 195 p.)
Hoek, E., and Bray, J.W., 1974, Rock Slope Engineering: London, Institution of Mining and Metallurgy, 309 p.
Horton, R.E., 1938, Phenomena of the contact zone between the ground surface and a layer of melting snow: Association Internationale d’Hydrologie Scientifique, Paris, v. 244, p. 545–561.
Hungr, O., 1995, A model for the runout analysis of rapid fl ow slide, debris flow, and avalanches: Canadian Geotechnical Journal, v. 32, p. 610–623, doi: 10.1139/t95-063.
Hungr, O., 2005, Classification and terminology, in Jakob, M. and Hungr, O., eds., Debris-flow hazards and related phenomena: Berlin, Springer Praxis, p. 9–23.
Hungr, O., and Evans, S.G., 1988, Engineering evaluation of fragmental rockfall hazards, in Bonnard, C., ed., Landslides, Proceedings of the 5th International Symposium on Landslides, Lausanne: Rotterdam, A.A. Balkema, V. 1, p. 685–690.
Hutchinson, J.N., 1968, Mass movement, in Fairbridge, R.W., ed., Encyclopedia of Geomorphology: New York, Reinhold, p. 688–695. Jäger, S., and Wieczorek, G.F., 1994, Landslide susceptibility in the Tully Valley area, Finger Lakes region, New York: U.S. Geological Survey Open-File Report 94-615. Plate with 5 maps, 31 p., 4 tables, 2 figs., scale 1:50,000.
Jibson, R.W., 1989, Debris flows in southern Puerto Rico, in Schultz, A.P., and Jibson, R.W., eds., Landslide Processes of the Eastern United States and Puerto Rico: Geological Society of America Special Paper 236, p. 29–55.
Johnson, A.M., 1984, Debris flow, in Brunsden, D., and Piror, D.B., eds., Slope Instability: New York, John Wiley and Sons, p. 257–361.
Jones, F.O., Embody, D.R., and Peterson, W.L., 1961, Landslides along the Columbia River Valley, Northeastern Washington, U.S. Geological Survey Professional Paper 367, 98 p.
Jones, C.L., Higgins, J.D., and Andrew, R.D., 2000, Colorado Rockfall Simulation Program Version 4.0, Colorado Department of Transportation, Colorado Geological Survey, March, 127 p.
Keefer, D.K., 1984, Landslides caused by earthquakes: Geological Society of America Bulletin, v. 95, p. 406–421, doi: 10.1130/0016-7606(1984)95 <406:LCBE>2.0.CO;2.
Keefer, D.K., 1993, The susceptibility of rock slopes to earthquake-induced failure: Association of Engineering Geologists Bulletin, v. 30, no. 3, p. 353–361.
Keefer, D.K., 2002, Investigating landslides caused by earthquakes—A historical review: Surveys in Geophysics, v. 23, p. 473–510, doi: 10.1023/ A:1021274710840.
Keefer, D.K., Wilson, R.C., Mark, R.K., Brabb, E.E., Brown, W.M., III, Ellen, S.D., Harp, E.L., Wieczorek, G.F., Alger, C.S., and Zatkin, R.S., 1987, Real-time landslide warning during heavy rainfall: Science, v. 238, p. 921–925, doi: 10.1126/science.238.4829.921.
Larsen, M.C., and Simon, A., 1993, A rainfall-intensity-duration threshold for landslides in a humid-tropical environment, Puerto Rico: Geografiska Annaler, v. 75A, no. 1-2, p. 13–23, doi: 10.2307/521049.
Larsen, M.C., and Wieczorek, G.F., 2006, Geomorphic effects of large debris flows and flash floods, northern Venezuela, 1999: Tropical Geomorphology with Special Reference to South America, Latrubesse, Edgardo, ed., Zeitschrift für Geomorphologie, Suppl. Vol. 145, p. 147–175.
Madole, R.F., 1982, Surfi cial geologic map of the Craig ½° × 1° quadrangle, Moffat and Routt counties, Colorado: U.S. Geological Survey, Miscellaneous Investigation Series Map I-1346, scale 1:100,000.
Markland, J.T., 1972, A useful technique for estimating the stability of rock slopes when the rigid wedge slide type of failure is expected: Imperial College Rock Mechanics Research Reprints, no. 19.
Mathewson, C.C., Keaton, J.R., and Santi, P.M., 1990, Role of bedrock ground water in the initiation of debris flows and sustained post-storm stream discharge: Bulletin of the Association of Engineering Geologists, v. 27, no. 1, p. 73–78.
Matthes, F.E., 1930, Geologic history of the Yosemite Valley: U.S. Geological Survey Professional Paper 160, 137 p.
McGuffey, V.C., Modeer, V.A., Jr., and Turner, K., 1996, Subsurface Exploration, in Turner, A.K., and Schuster, R. L., eds., Landslides: Investigations and Mitigation: Transportation Research Board, Special Report 247, Chapter 10, p. 231–277.
McKean, J., and Roering, J., 2004, Objective landslide detection and surface morphology mapping using high-resolution airborne laser altimetry: Geomorphology, v. 57, p. 331–351, doi: 10.1016/S0169-555X(03)00164-8.
McKean, J., Bird, E., Pettinga, J., Campbell, J., and Roering, J., 2004, Using Lidar to objectively map bedrock landslides and infer their mechanics and material properties [abs.]: Geological Society of America Abstracts with Programs, v. 36, no. 5, p. 332.
Miles, S.B., and Keefer, D.K., 2000, Evaluation of Seismic Slope-Performance Models Using a Regional Case Study: Environmental & Engineering Geoscience, v. 11, no. 1, p. 25–39.
Miller, D.J., 1960, Giant waves in Lituya Bay, Alaska: U.S. Geological Survey Professional Paper 354C, p. 51–83.
Morgan, B.A., Wieczorek, G.F., and Campbell, R.H., 1999, Historical and potential debris-flow hazard map of area affected by the June 27, 1995, storm in Madison County, Virginia: U.S. Geological Survey Geologic Investigation Series Map I-2623B, 1:24,000.
Morrissey, M.M., Wieczorek, G.F., and Morgan, B.A., 2001, A comparative analysis of hazard models for predicting debris fl ows in Madison County, Virginia: U.S. Geological Survey Open File Report 01-67, 17 p., 7 figs (CD-ROM).
Motyka, R.J., Boyce, E., and Larsen, C., 2004, Results of GPS measurement, Tidal Inlet, Glacier Bay National Park landslide assessment 2004: Report Geophysical Institute, University of Alaska, Fairbanks, 8 p.
Muir, J., 1912, The Yosemite: Century Company, 284 p. (Reprinted 1962, Garden City, New York, Anchor Books, Doubleday, 225 p.)
National Park Service, 2000, Yosemite Valley Geologic Hazard Guidelines, in Final Yosemite Valley Plan Supplemental Environmental Impact Statement, November 2000, Appendix C, p. C1–C4.
O’Brien, J.S., Julien, P.Y., and Fullerton, W.T., 1993, Two-dimensional water flood and mudflow simulation: Journal of Hydraulic Engineering, v. 119, no. 2, p. 244–259, doi: 10.1061/(ASCE)0733-9429(1993)119:2(244).
Parise, M., Coe, J.A., Savage, W.Z., and Varnes, D.J., 2004, The Slumgullion landslide (southwestern Colorado, USA): Investigation and monitoring, in Picarelli, L., ed., Proceedings of the International Workshop on Occurrence and Mechanisms of Flow-Like Landslides in Natural Slopes and Earthfills: Associazione Geotechnica Italiana, Sorrento, Italy, May 14–16, 2003, Patron editore, Bologna, p.253–263.
Pfeiffer, T.J., Higgins, J.D., Schultz, R., and Andrew, R.D., 1991, Colorado Rockfall Simulation Program Users Manual for Version 2.1: Denver, Colorado Department of Transformation, 127 p.
Pike, R.J., Graymer, R.W., Roberts, S., Kalman, N.B., and Sobiezczyk, S., 2001, Map and map database of susceptibility to slope failure by sliding and earthflow in the Oakland area, California: U.S. Geological Survey Miscellaneous Field Studies Map MF-2385, scale 1:50,000.
Pomeroy, J.S., 1977, Preliminary reconnaissance map showing landslides in Butler County, Pennsylvania: U.S. Geological Survey Open File Report 77-0246, 2 sheets, scale 1:50,000.
Reid, M.E., and LaHusen, R.G., 1998, Real-time Monitoring of Active Landslides Along Highway 50, El Dorado County: adapted from: California Geology, v. 51, no. 3, p. 17–20.
Reid, M.E., and LaHusen, R.G., 2004, Capturing 3-D displacement in active landslides using GPS [abs.]: Geological Society of America Abstracts with Programs, v. 36, no. 5, p. 331.
Schulz, W.H., 2005, Landslide Susceptibility Estimated From Mapping Using Light Detection and Ranging (LIDAR) Imagery and Historical Landslide Records, Seattle, Washington: U.S. Geological Survey Open File Report 2005-1405.
Schuster, R.L., and Wieczorek, G.F., 2002, Landslide triggers and types, in Rybar J., Stemberk J., and Wagner P., eds., Proceedings, 1st European Conference on Landslides, 24–26 June 2002: Prague, A.A. Balkema, p. 59–78.
Spang, R.M., and Sonser, T., 1995, Optimized rockfall protection by “ROCKFALL,” Proceedings 8th International Congress: Rock Mechanics, v. 3, p. 1233–1242.
Varnes, D.J., Smith, W.K., Savage, W.Z., and Powers, P.S. 1996, Deformation and control surveys, Slumgullion landslide, in Varnes, D.J., and Savage, W.Z., eds., The Slumgullion earth flow: A large-scale natural laboratory: U.S. Geological Survey Bulletin 103, p. 9–12.
Varnes, D.J., 1978, Slope movement types and processes, in Schuster, R.L., and Krizek, R.J., eds., Landslide Analysis and Control: Washington, D.C., National Academy Press, Transportation Research Board, National Academy of Sciences, Special Report 176, p. 12–33.
Wasowski, J., Keefer, D.K., and Jibson, R.J., eds., 2000, Special Issue: Landslides in Seismically Active Regions: Engineering Geology, v. 58, no. 3-4, p. 231–404, doi: 10.1016/S0013-7952(00)00037-5.
Wieczorek, G.F., 1984, Preparing a detailed landslide-inventory map for hazard evaluation and reduction: Association of Engineering Geologists Bulletin, v. 21, no. 3, p. 337–342.
Wieczorek, G.F., 1996, Landslide triggering mechanisms, in Turner, A.K., and Schuster, R.L., eds., Landslides: Investigations and Mitigation: Transportation Research Board, Special Report 247, Chapter 4, p. 76–90.
Wieczorek, G.F., and Glade, T., 2005, Climatic Factors Influencing Occurrence of Debris Flows, in Jakob, M., and Hungr, O., eds., Debris-Flow Hazards and Related Phenomena: Berlin Heidelberg, Springer Praxis, p. 325–362.
Wieczorek, G.F., and Jäger, S., 1996, Triggering mechanisms and depositional rates of postglacial slope-movement processes in the Yosemite Valley, California: Geomorphology, v. 15, p. 17–31, doi: 10.1016/0169-555X(95)-0112-I.
Wieczorek, G.F., and Schuster, R.L., 1999, The 1995 landslide in Zion Canyon, Zion National Park, Utah, U.S.A., Landslide News, Japanese Landslide Society, in Sassa, K., ed., Landslides of the World: Japan Landslide Society, p. 343–348.
Wieczorek, G.F., and Snyder, J.B., 2004, Historical rock falls in Yosemite National Park: U.S. Geological Survey Open-File Report 03-491.
Wieczorek, G.F., Wilson, R.C., and Harp, E.L., 1985, Map showing slope stability during earthquakes in San Mateo County, California: U.S. Geological Survey Miscellaneous Investigation Map I-1257E, scale 1:62,500.
Wieczorek, G.F., Harp, E.L., Mark, R.K., and Bhattacharyya, A.K., 1988, Debris flows and other landslides in San Mateo, Santa Cruz, Contra Costa, Alameda, Napa, Solano, and Sonoma Counties, and factors infl uencing debris-flow distribution, in Ellen, S.D., and Wieczorek, G.F., eds., Landslides, floods, and marine effects of the January 3–5, 1982 storm in the San Francisco Bay region, California: U.S. Geological Survey Professional Paper 1434, p. 133–161.
Wieczorek, G.F., Alger, C.S., and Snyder, J.B., 1989, Rockfalls in Yosemite National Park, in Brown, W.M., III, ed., Landslides in Central California: 28th International Geological Congress Field Trip Guidebook T381, p. 56–62.
Wieczorek, G.F., Snyder, J.B., Alger, C.S., and Isaacson, K.A., 1992, Rock falls in Yosemite Valley, California: U.S. Geological Survey Open-File Report 92-387, 38 p., 2 appendixes, 4 plates, 1 disk.
Wieczorek, G.F., Nishenko, S.P., and Varnes, D.J., 1995, Analysis of rock falls in the Yosemite Valley, California, in Daemen, J.J., and Schultz, R.A., eds., Proceedings of 35th U.S. Symposium on Rock Mechanics: A.A. Balkema, p. 85–89.
Wieczorek, G.F., Morrissey, M.M., Iovine, G., and Godt, J., 1999, Rock-fall potential in the Yosemite Valley, California: U.S. Geological Survey Open File Report 99-578, 1 plate 1:12.000, 7 p., http://greenwood.cr.usgs.gov/pub/open-fi le-reports/ofr-99-0578/.
Wieczorek, G.F., Morgan, B.A., and Campbell, R.H., 2000, Debris-flow hazards in the Blue Ridge of central Virginia: Environmental & Engineering Geoscience, v. 6, no. 1, p. 3–23.
Wieczorek, G.F., Larsen, M.C., Eaton, L.S., Morgan, B.A., and Blair, J.L., 2001, Debris-flow and flooding hazards associated with the December 1999 storm in coastal Venezuela and strategies for mitigation: U.S. Geological Survey Open File Report 01-144, 40p., 3 tables, 2 appendices, 3 plates, 1 CD-ROM.
Wieczorek, G.F., Larsen, M.C., Eaton, L.S., Morgan, B.A., and Blair, J.L., 2002, Debris-flow and flooding deposits in coastal Venezuela associated with the storm of December 14–16, 1999: U.S. Geological Survey, Geologic Investigation Series Map I-2772, 2 plates, scale 1:6000 and 1:25,000.
Wieczorek, G.F., Jakob, M., Motyka, R.J., Zirnheld, S.L., and Craw, P., 2003, Preliminary landslide-induced wave hazard assessment: Tidal Inlet, Glacier Bay National Park, Alaska, U.S. Geological Survey Open-File Report 03-100, 27 p., 15 figs.
Wilson, R.C., 2005. The rise and fall of a debris-flow warning system for the San Francisco Bay region, California, in Glade, T., Anderson, M., and Crozier, M.J., eds., Landslide Hazard and Risk: Chichester, John Wiley and Sons, p. 493–516.
Wilson, R.C., and Wieczorek, G.F., 1995, Rainfall thresholds for the initiation of debris flows at La Honda, California: Environmental & Engineering Geoscience, v. 1, no. 1, p. 11–27.
Wilson, R.C., Torikai, J.D., and Ellen, S.D., 1992, Development of rainfall warning thresholds for debris fl ows in the Honolulu District, Oahu: U.S. Geological Survey Open-File Report 92-521.
FURTHER READING
Cheng-lung Chen, ed., 1997, Debris-flow hazards mitigation, mechanics, prediction, and assessment: Proceedings of First International Conference, San Francisco, August 7–9, 1997, ASCE, 817 p.
Eisbacher, G.H., and Clague, J.J., 1984, Destructive mass movements in high mountains: hazard and management: Geological Society of Canada Paper 84-16, 230 p.
Evans, S.G., and DeGraff, J.V., eds., 2002, Catastrophic landslides: Effects, occurrence, and mechanisms: Boulder, Colorado, Geological Society of America Reviews in Engineering Geology 15, 411 p.
Glade, T., Anderson, M., and Crozier, M.J., eds., 2005, Landslide hazard and risk: Chichester, England, John Wiley and Sons, 802 p.
Jakob, M., and Hungr, O., eds., 2005, Debris-fl ow hazards and related phenomena: Berlin, Heidelberg, Springer Praxis, 739 p.
Rickenmann, D., and Chen, C.-L., eds., 2003, Debris-fl ow hazards mitigation: mechanics, prediction, and assessment: Proceedings of the Third International Conference, Davos, Switzerland, September 10–12, 2003: Rotterdam, Millpress Science Publishers, 1335 p.
Sassa, K., ed., 1999, Landslides of the world: Japan Landslide Society, Kyoto University Press, 413 p.
Senneset, K., ed., 1996, Landslides, Glissements de terrain, Trondheim, Seventh International Symposium, Norway, 1992 p.
Turner, A.K., and Schuster, R.L., eds., 1996, Landslides: investigations and mitigation, Transportation Research Board, Special Report 247, 673 p.
Voight, B., ed., 1978, Rockslides and avalanches, Amsterdam, Elsevier Scientific Publishing Company, v. 1, 833 p.
Wieczorek, G.F., and Naeser, N.D., eds., 2000, Debris-flow hazards mitigation: mechanics, prediction, and assessment: Proceedings of the Second International Conference, Taipei, Taiwan, August 16–18, 2000: Rotterdam, A.A. Balkema, 608 p.
