Part of a series of articles titled Climate and Water Resource Monitoring at Guadalupe Mountains National Park.
Article
Climate Monitoring at Guadalupe Mountains National Park

NPS
What is Climate?
Climate is the meteorological conditions at a given place over time. A broader time scale (seasons to years) is what distinguishes climate from the instantaneous conditions reflected by the term weather. As the primary driver of ecological processes on earth, climate affects soil-water relationships, plant-soil interactions, plan productivity, cycling of nutrients and water in an ecosystem, and the occurrence and intensity of disturbances. The Chihuahuan Desert Inventory and Monitoring Network monitors climate over time to detect changes that could have cascading effects on park ecosystems.

NPS
How Do We Monitor Climate?
Four Remote Automated Weather Stations (RAWS) were installed on the park from 2001 to 2010: Guadelupe (sic) Peak RAWS (2003, elevation = 7,755 ft), Dog Canyon RAWS (2010, elevation = 6,262 ft), Pinery RAWS (2001, elevation = 5,381 ft), and PX Well RAWS (2010, elevation = 3,873 ft). Before these stations, two National Oceanic and Atmospheric Administration (NOAA) Cooperative Observer Program (COOP) weather stations recorded data (Pine Springs and Dog Canyon stations). Historical data from these two stations provide the 1981 to 2010 climate normal values we use to compare with current data from Pinery and Dog Canyon RAWS. We obtain station data (maximum and minimum temperatures, precipitation rates, drought indices, and more) from the Climate Analyzer website by water year (October through September).
October 2017–September 2018 Highlights
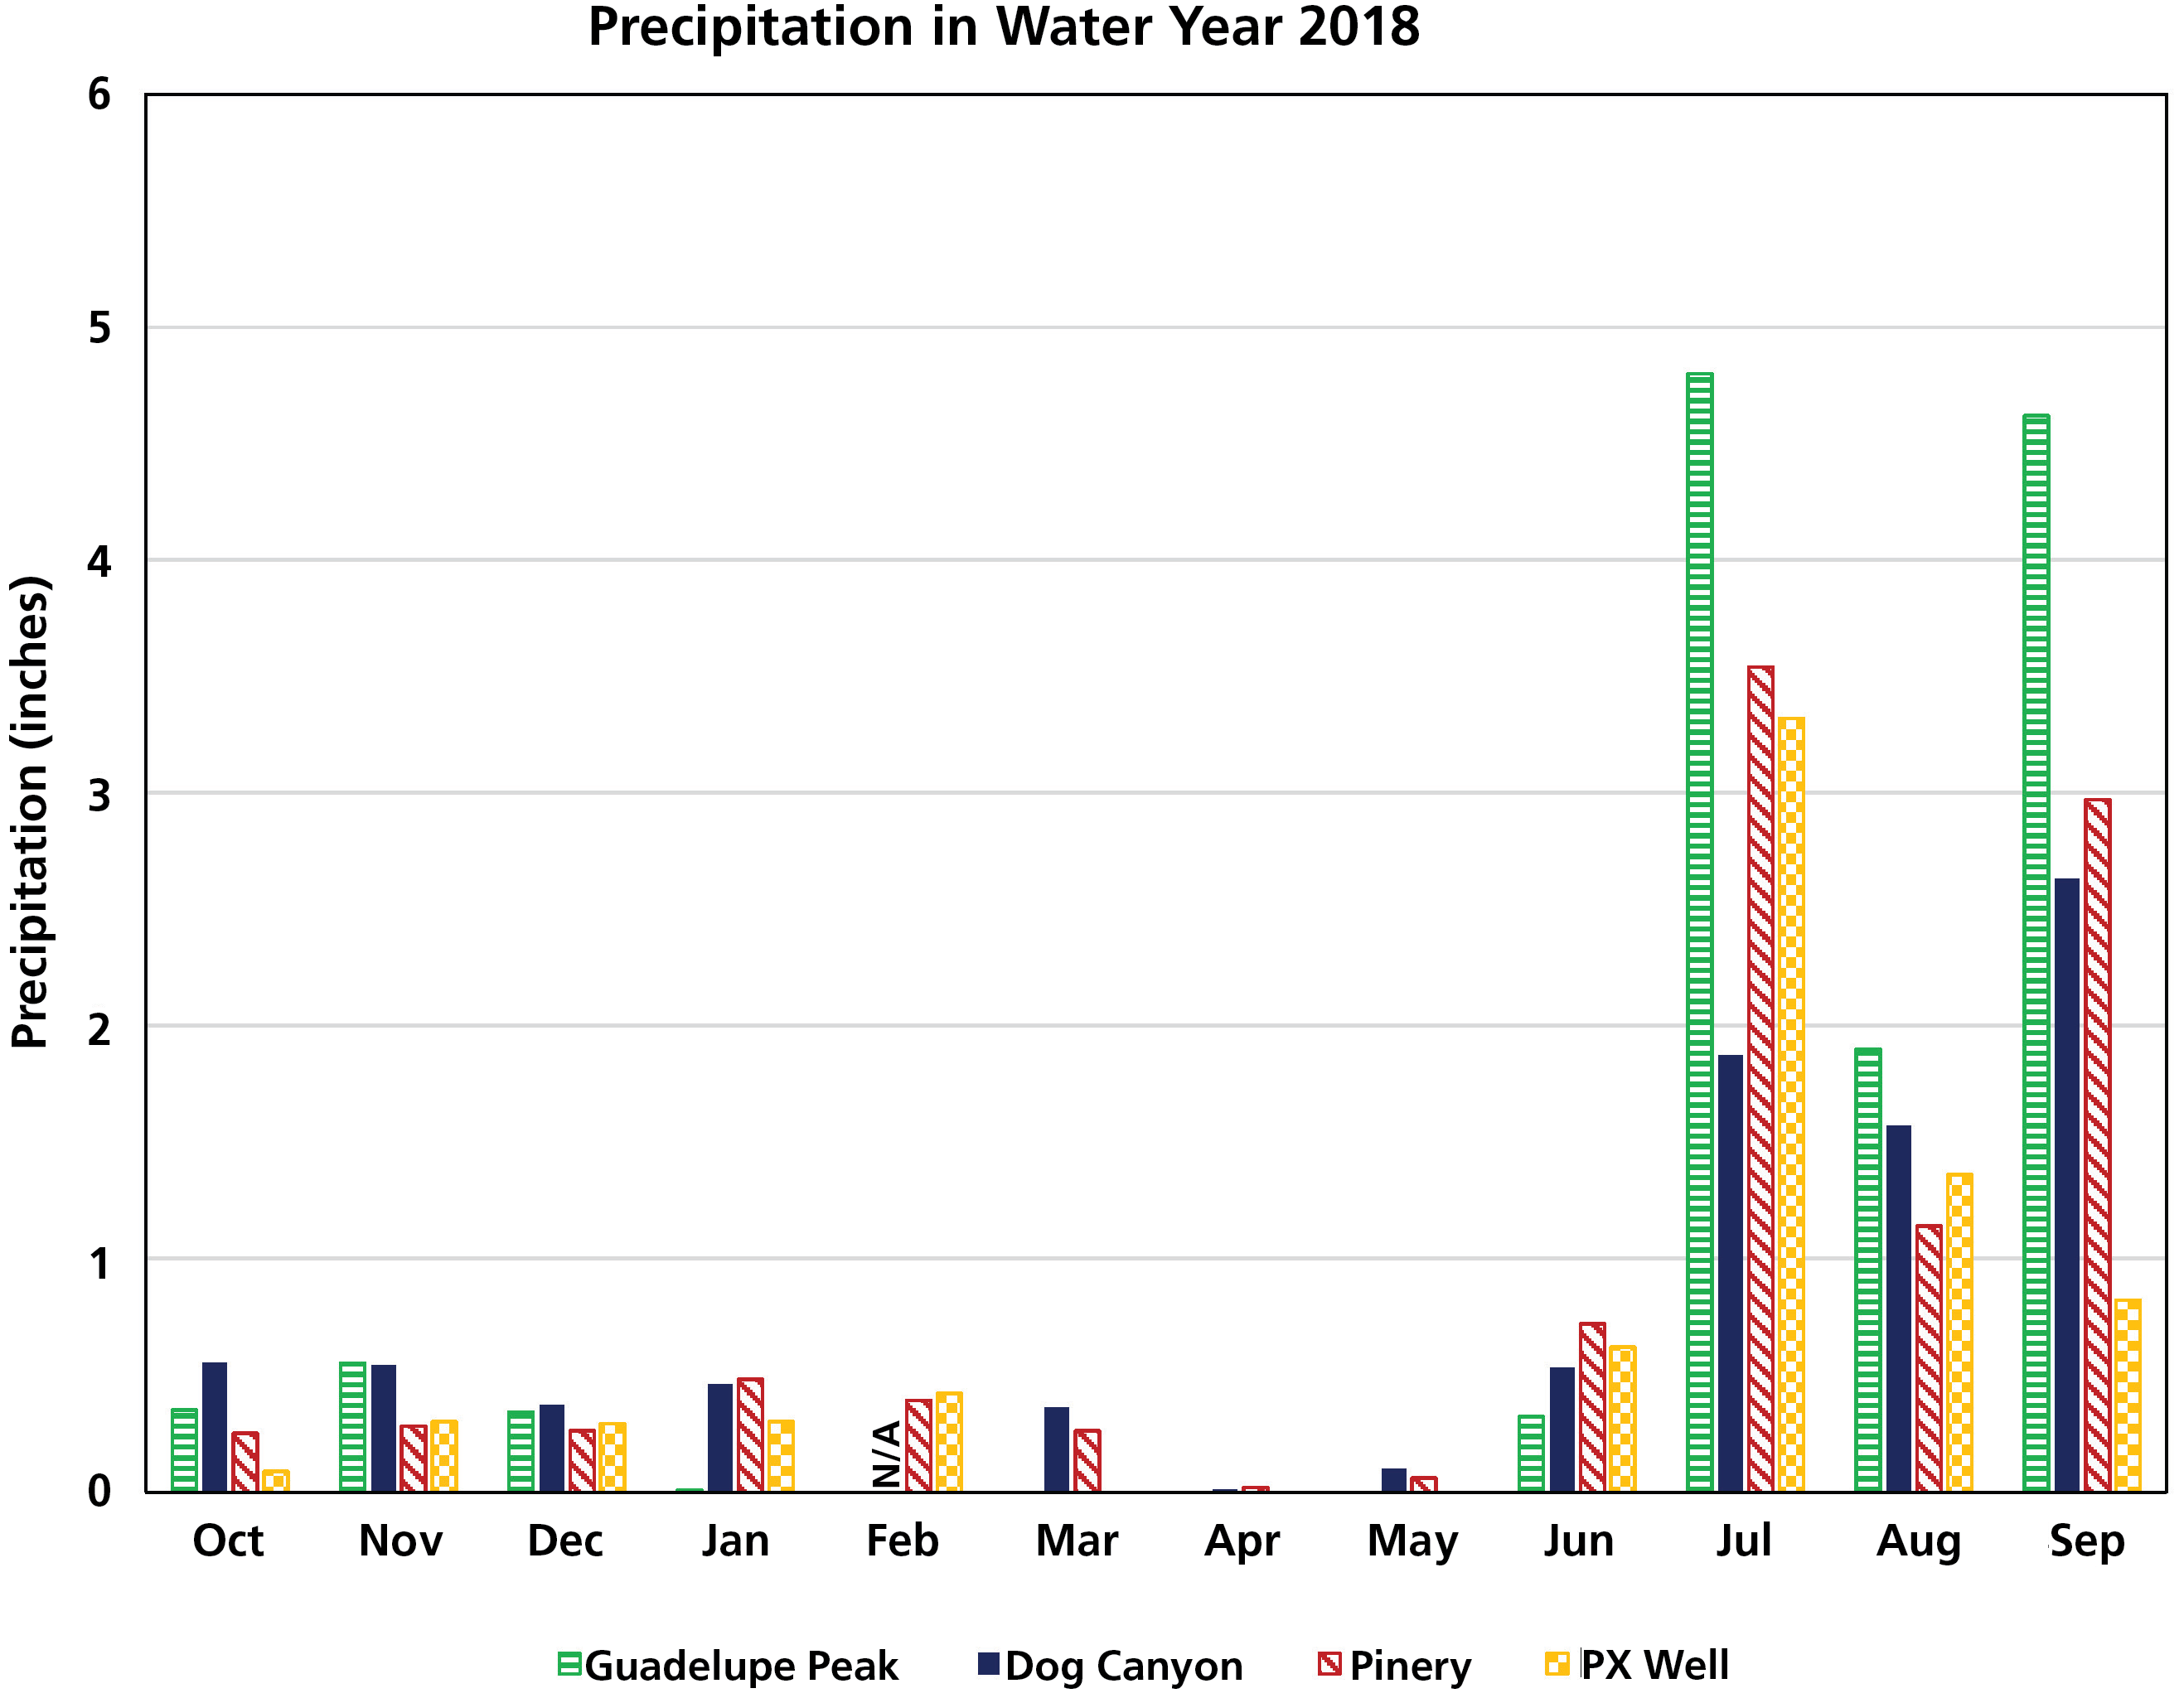
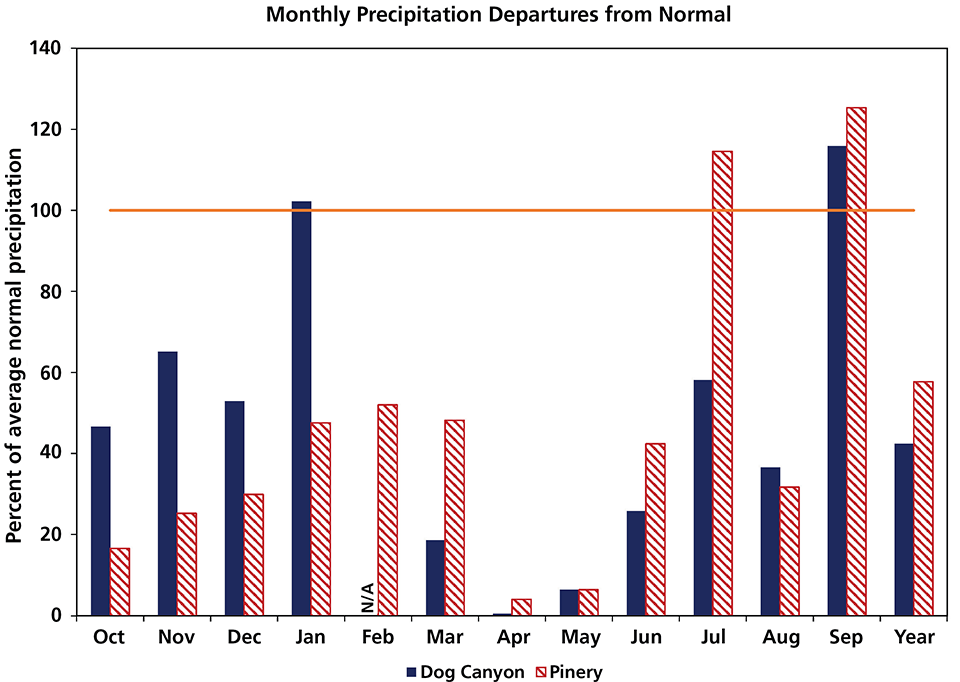
Annual precipitation in 2018 was below normal at the park—normal is based on the 30-year average from 1981 to 2010. Pinery station recorded 10.37 inches of rain (58% of the normal 17.97 inches) and Dog Canyon station recorded 8.99 inches (42% of the normal 21.24 inches).

NPS
Fall/Winter Rainfall and Temperatures (October–March)
- Pinery and Dog Canyon stations received less than half the normal rainfall (33% and 39% of normal, respectively). Only January rainfall at Dog Canyon was near normal while the other months at all stations were substantially below normal. Monthly rainfall totals were less than 0.55 inches for all stations. Guadelupe Peak station recorded only 0.01 inches of rain in January and March.
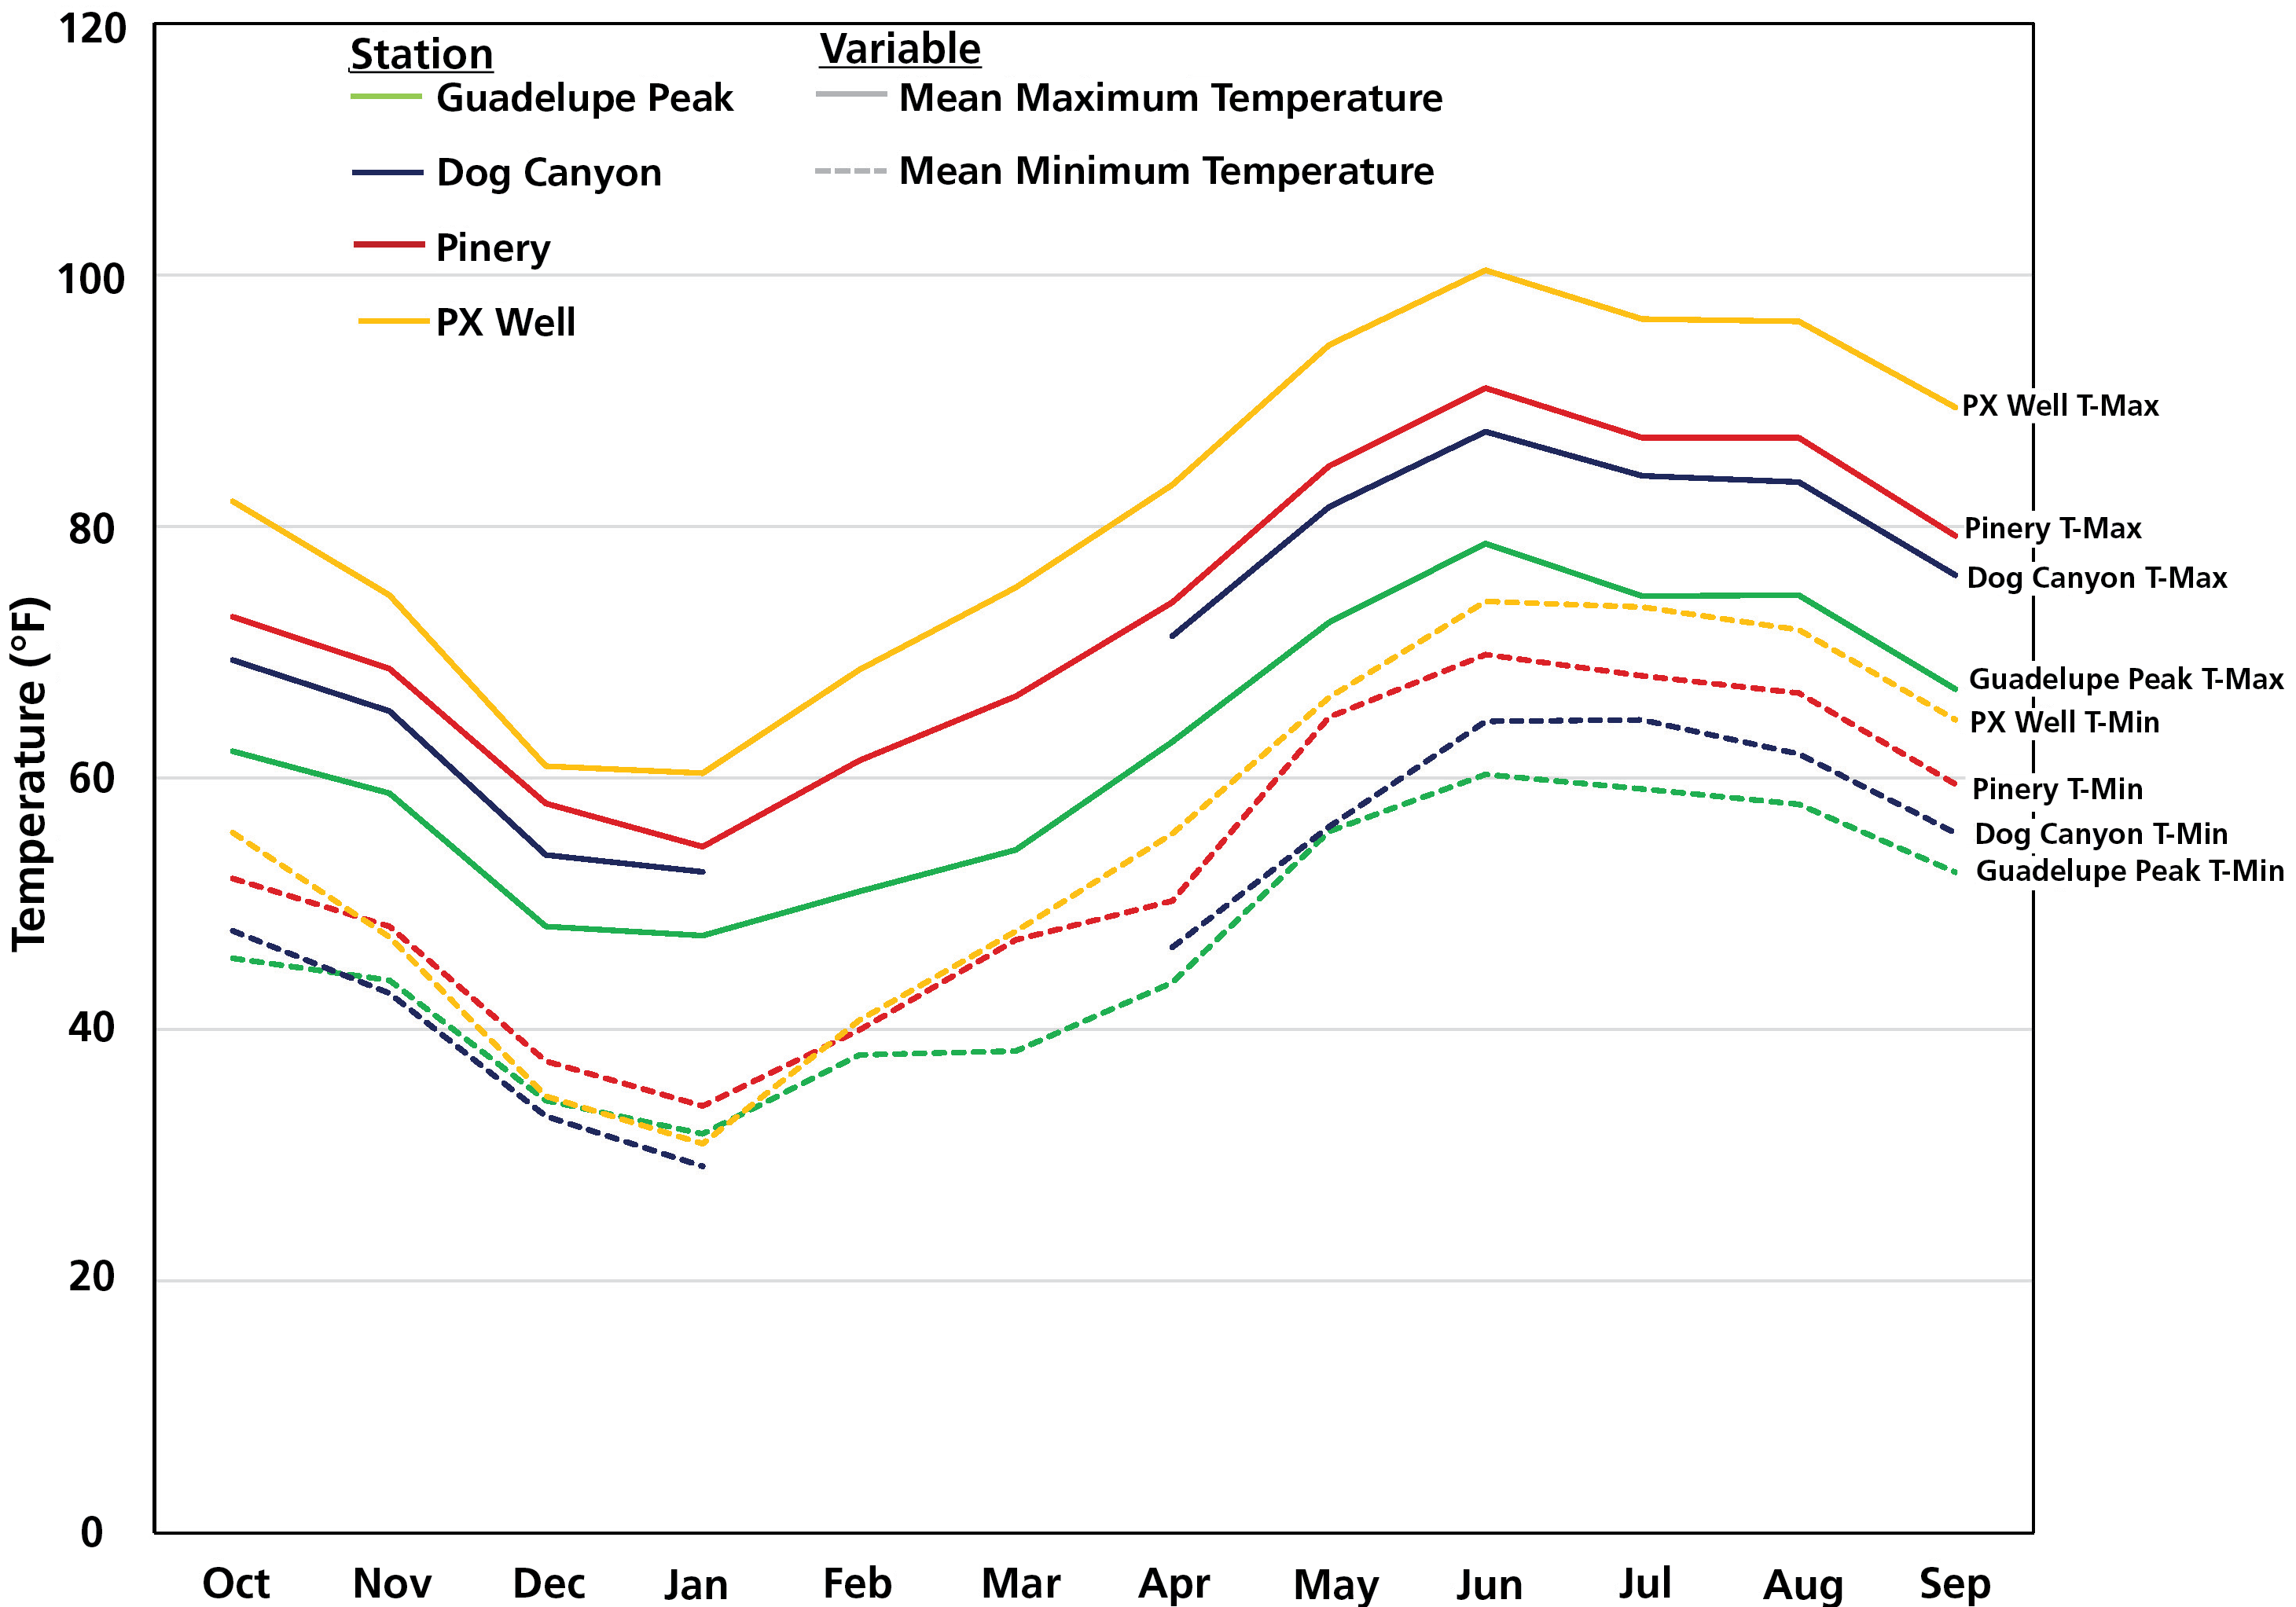
- The average monthly minimum and maximum air temperatures at the Pinery station were warmer than normal (up to 7.8°F above normal in November). Average monthly maximum temperatures were highest at PX Well and decreased as station elevation increased. The average minimum temperatures were more variable.

NPS
Spring/Summer Rainfall and Temperatures (April–September)
- Rainfall in spring and summer at Pinery and Dog Canyon stations was higher than in the cool season, but still substantially below normal (69% and 43% below normal, respectively). Both of these stations had higher than normal rainfall in September and in July at Pinery station. Minimal rainfall fell across the park in April and May. Most of the rainfall fell between July and September.
- Average monthly minimum and maximum air temperatures at the Pinery station were warmer than normal (up to 8.8°F above normal in May). Mean monthly minimum and maximum temperatures decreased with increasing elevation.

NPS

Graphic generated by climateanalyzer.org (Walking Shadow Ecology).
Calculations are relative to the time period displayed in each graph and different time periods may produce different results.
Drought Index
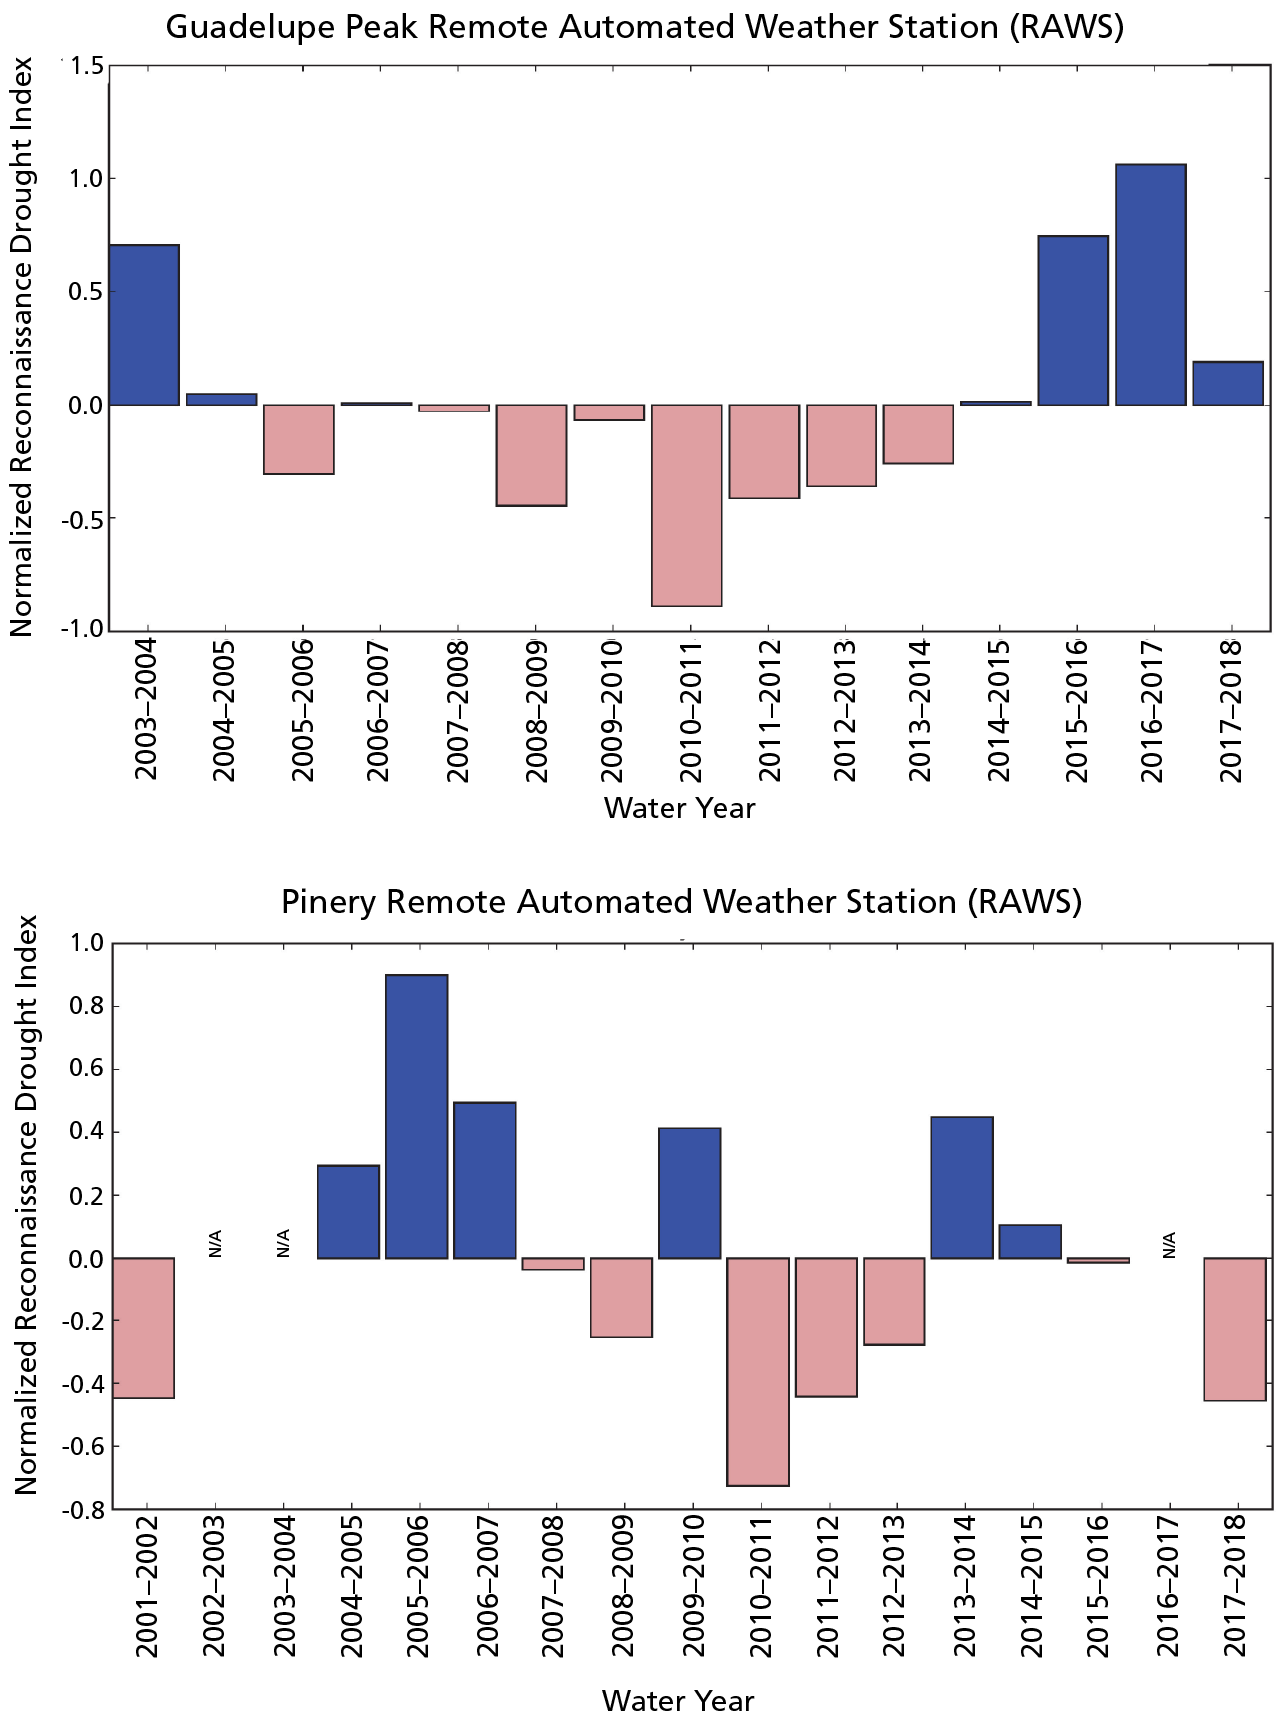
The Reconnaissance Drought Index (RDI) provides a measure of drought severity and extent. The RDI at Guadelupe Peak station indicated that Water Year 2018 was the fourth consecutive year with wetter conditions than normal (normal is based on the average from 2004 to 2018), whereas the RDI at Pinery station indicated drier conditions than average (2002 to 2018). The drought index was not calculated for the Dog Canyon and PX Well stations. To calculate the Drought Index, a longer period of data is required.

NPS
Extreme Weather Events
Extreme weather may be as important as long-term climate averages for understanding ecological patterns. High air temperatures are a defining feature of warm deserts. However, extreme heat events can have serious consequences for ecosystems in the Chihuahuan Desert and Arizona-New Mexico Mountains. Sustained warm temperatures can increase evaporation of surface water and rates of water loss from plants. Extreme rainfall events can cause localized flooding and erosion events, increase or decrease plant productivity and flowering, and modify animal behavior.
There were 36 extremely warm days (over 91°F) at Guadalupe Mountains National Park in Water Year 2018 (October 2017–September 2018). This was more than twice the normal frequency of 17.4 days. Only 10 days were considered extremely cold (under 23°F) in Water Year 2018. The historical normal is 16.1 extremely cold days.
Extreme precipitation is defined as an inch or more of rainfall and the average number of days with this precipitation level at the park from 1981 to 2010 is 3.2 days. Each station had days with extreme precipitation in Water Year 2018:
- Pinery station had 1.12 inches of rain on July 7 and 1.70 inches on September 18.
- Guadalupe station had 1.14 inches of rain on July 10, 1.04 inches on July 31, 1.14 inches on August 19, and 1.29 inches on September 18.
- Dog Canyon station had 1.03 inches of rain on August 8.
- PX Well station had 1.47 inches of rain on July 26.
Last updated: April 8, 2021
