Last updated: January 24, 2018
Article
Monitoring Glacial Features and Processes
Glacier monitoring techniques
Ronald D. Karpilo Jr.
Department of Geosciences, Colorado State University, and Geologic Resources Division, National Park Service, Fort Collins, Colorado 80523, USA
Karpilo, R.D., Jr., 2009, Glacier monitoring techniques, in Young, R., and Norby, L., Geological Monitoring: Boulder, Colorado, Geological Society of America, p. 141–162, doi: 10.1130/2009.monitoring(06). For permission to copy, contact editing@geosociety.org. ©2009 The Geological Society of America. All rights reserved.
Introduction to Glacial Resources
Glaciers are a significant natural resource in Alaska and the Western United States, covering respective areas of ~74,600 and 688 km2 (Dyurgerov, 2002; Fountain et al., 2007). A large percentage of these glaciers exist within the boundaries of lands managed by the U.S. federal government. For example, glaciers in Wrangell–St. Elias National Park and Preserve and Denali National Park and Preserve in Alaska cover a total area of ~20,000 km2 (Adema, 2004). In contrast to geologic processes that operate on time scales on the order of thousands or even millions of years, significant glacier change can occur within a
human lifetime. The dynamic nature of glaciers strongly influences the hydrologic, geologic, and ecological systems in the environments in which they exist. Additionally, the sensitive and dynamic response to changes in temperature and precipitation make glaciers excellent indicators of regional and global climate change (Riedel and Burrows, 2005). Long-term monitoring of glacier change is important because it provides basic data for understanding and assessing past, current, and possible future conditions of the local, regional, and global environment. A basic understanding of local and regional environmental systems is critical for responsible land management and decision-making.
Glacier Basics
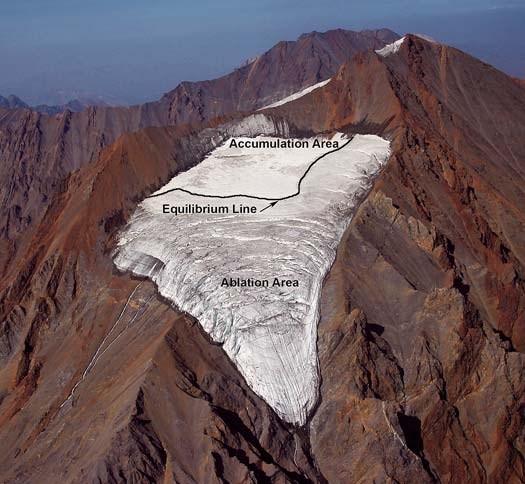
Glaciers are perennial snow or ice masses that move (Paterson, 1994). More specifically, glaciers must have an area where snow accumulates (snowfall, wind drifting, and avalanching) in excess of ablation. Ablation includes all processes that decrease the mass of the glacier, such as melting and runoff, evaporation, sublimation, calving (the release of a mass of ice from a glacier), and wind erosion (Paterson, 1994). The snow is slowly transformed by compression and recrystallization into solid ice while being transferred by gravity to lower elevations where ablation exceeds mass accumulation (Knight, 1999; Meier, 1964). The area on the glacier where snow accumulation exceeds melting during the summer is the accumulation zone. The lower elevation portion of the glacier where ablation exceeds accumulation rates is the ablation zone. The boundary between the accumulation and ablation areas, where accumulation equals ablation, is the equilibrium line. When accumulation exceeds ablation, the glacier increases in mass and usually advances. When ablation exceeds accumulation, the glacier decreases in mass and thins and/or retreats. A glacier’s mass remains stable when accumulation is equal to ablation.
Glacier Controls
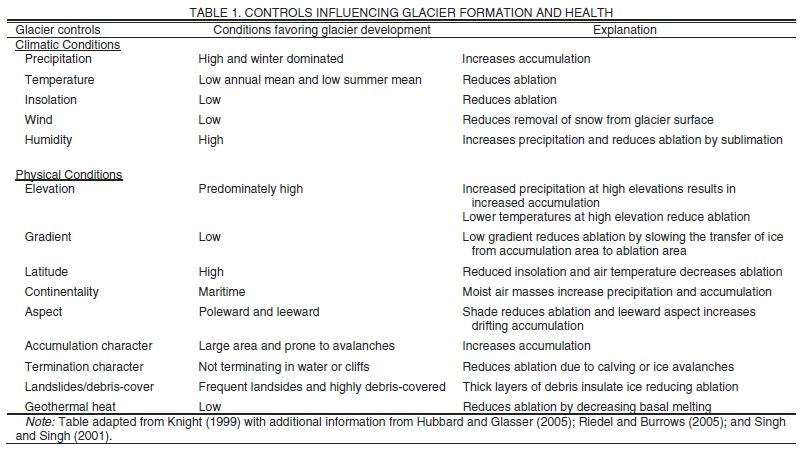
The controls on the formation and existence of glaciers include climate and physical conditions (Riedel and Burrows, 2005; Knight, 1999). In most cases, the climatic variables of precipitation and temperature are the dominate influences on glacier formation and survival. Direct precipitation of snow on the glacier typically contributes the largest mass input into a glacier. In some regions of the United States, however, wind drift and avalanching can also play very important roles. Alternatively, ablation on non-calving glaciers is largely attributed to surface melting and sublimation (Knight, 1999). Other climatic influences on glacier development include solar insolation (a measure of solar radiation reaching a given surface) and wind (Table 1).
Physical conditions dictate the geographic distribution and spatial extent of most glaciers. Glaciers generally form at high elevations or in polar latitudes where accumulation during the winter exceeds ablation during the summer (Hooke, 2005). The aspect of the glacier is also important as it dictates the amount of solar insolation and wind-blown snow the glacier receives. Accumulation in the form of ice and snow avalanches can contribute a significant amount of mass to the glacier (Fountain et al., 1997; Kaser et al., 2003). Avalanche- nourished glaciers can have accumulation rates as high as four times the winter precipitation rates (Knight, 1999). Glaciers with tidewater, lake, or cliff terminating margins generally lose a signifi cant amount of mass by calving and ice avalanches (Dyurgerov, 2002). Other physical controls influencing glacier development and health include landslides and geothermal heat. Landslides frequently deposit debris on the surface of glaciers. A layer of debris 1.5–2.0 m thick on the surface of a glacier provides enough insulation that ablation virtually stops (Knight, 1999). Conversely, a very thin layer of low-albedo (ratio between light reflectivity and absorption) material can increase ablation. Geothermal heat from the radioactive decay of crustal rocks and heat from the mantle generally results in a
few millimeters or centimeters of basal melting per year (Hooke, 2005). Isolated geothermal events such as volcanic eruptions, like those of Mount Redoubt in Alaska or Mount St. Helens in Washington, can result in catastrophic melting events.
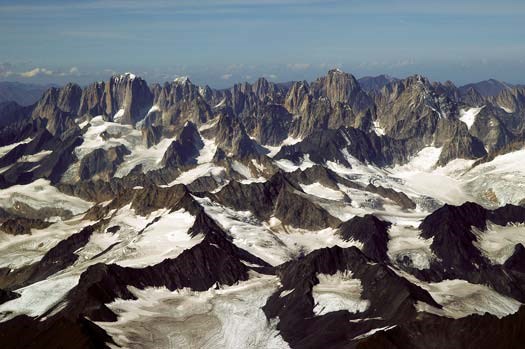
Glaciers influence a variety of natural systems in the environment. Monitoring glacier change is important because it links the impact that glaciers impose on the environment with the conditions that influence glacier health. Understanding these relations helps facilitate predictions of how changes in glacier controls may alter the local and global environment. For example, if the climate warms and glaciers melt substantially, then local hydrologic systems will experience reduced capability to buffer against seasonal variability of flow (Fountain and Tangborn, 1985) and global sea levels will rise. The following sections describe the impacts that glaciers have on specific landscape elements.
Glacial Geology
Glaciers are one of nature’s most efficient landscape architects, constantly reshaping their environments through the processes of erosion, entrainment, transportation, and deposition (Knight, 1999). Bedrock material ranging in size from clay particles to large boulders are removed by the glacier or meltwater and redistributed in the landscape. Glacial erosion and deposition is responsible for the formation of U-shaped valleys, cirques, moraines (mass of glacial debris carried or deposited by a glacier), and a variety of other glacial landforms. Figure 1 illustrates the impact that glaciers can impose on the physical environment. Additionally, glacial sediment is often redistributed by wind or water, forming new soils and affecting the water quality of rivers, lakes, and oceans.
Glacier Hydrology
Glaciers play a significant role in both the local and global hydrologic systems. On a local scale, glaciers act as naturally regulated reservoirs that buffer the local hydrologic regime from seasonal droughts by storing water during cool, wet periods of the winter and releasing it during warm, dry periods of the summer (Post et al., 1971; Fountain et al., 1997). It is estimated that meltwater from glaciers in the North Cascades in Washington annually contributes 800 million cubic meters of water to streamflow (Post et al., 1971). Globally, glaciers serve as “a land-surface water store of fluctuating size, and a slow transport mechanism for throughput of water from the atmosphere, via the land, back to the ocean” (Knight, 1999). Because of these relations, glacier changes directly infl uence global sea level, ocean salinity, and sea temperature. Alaska’s glaciers are contributing ~0.27 mm of meltwater per year to rising sea level (Arendt et al., 2002).
Glacier Ecology
Glaciers provide habitats for a variety of species of flora and fauna, including ice worms (Meenchytraeus solifugus) and springtails (Collembola) (Riedel and Burrows, 2005). Glacier meltwater can provide aquatic habitats for endangered species of fish including salmon (Oncorhynchus), bull trout (Salvelinus confl uentus), and western cutthroat trout (Oncorhynchus clarkii) (Riedel and Burrows, 2005). Understanding the rates and magnitudes of glacier change is important because the advance and retreat of glaciers changes local habitats, altering the spatial distribution and species composition of the associated biological communities.
Climate
Glaciers and climate have a complex, bidirectional relationship (Knight, 1999). Climatic variables such as temperature and precipitation influence glacier formation and development. Conversely, large glaciers exert control over global climate by affecting albedo and the composition and circulation of the oceans and atmosphere (Knight, 1999). Additionally, glaciers have a microclimate effect on local areas by causing katabatic winds (high density air moving downhill) and depressed air temperatures (Riedel and Burrows, 2005).
Glaciers pose several significant hazards to human life and property. Outburst floods, or jökulhlaups, occur when a large amount of meltwater is suddenly released due to the failure of an ice or moraine dam, or rapid melting due to a volcanic eruption (Driedger and Fountain, 1989; Post and Mayo, 1971). Lahars occur when volcanic debris mixes with the glacial meltwater. Calving ice from glaciers in mountainous regions may be released and plunge downslope as an ice avalanche (Knight, 1999). Tidewater glaciers produce icebergs that may threaten passing ships or drilling platforms. Lastly, when glaciers melt they often leave lateral moraine-debris perched on the valley walls. This debris may fall catastrophically to the valley floor as a spontaneous or earthquake-triggered landslide.
GLACIER VITAL SIGNS MONITORING DESCRIPTIONS
Vital Sign 1: Annual Glacier Mass Balance
The annual mass balance of a glacier is a hydrologic budget measuring the difference between the amounts of accumulation and ablation experienced by a glacier during the hydrologic year (Knight, 1999). Depending on the quantity of annual accumulation and ablation; the mass balance value may be positive, negative, or zero. Glacier mass balance is a good measure of the general health of a glacier. A positive mass balance indicates mass accumulation and that the glacier is growing; conversely, a negative balance indicates that the glacier is shrinking. A glacier with a mass balance of zero is in a steady-state and has a constant volume.
Beginning in the 1870s in the Swiss Alps, glacier mass balance monitoring has been used extensively to quantify and assess glacier changes (Mercanton, 1916; Haeberli, 1998). Glacier mass balance monitoring is well accepted by the glaciological community as the most direct measure of glacier health. Mass change is directly linked to changes in glacier volume, climate, and glacial runoff. North Cascades National Park in Washington selected mass balance monitoring as the primary indicator of glacier change in their long-term glacier monitoring plan for the following reasons: “First, it accounts for approximately 90% of the annual change in volume of temperate glaciers. Second, it can readily be measured on the only accessible part of a glacier—its surface” (Riedel and Burrows, 2005).
Climatic changes can be inferred from temporal trends of mass balance dynamics because changes in glacier mass balance are highly correlated to variations in temperature and precipitation (Tangborn, 1980). Trends of positive mass balance over time generally relate to increased precipitation (increased accumulation) or decreased temperature (reduced ablation); and the opposite is typically true for negative mass balance. Monitoring glacier mass balance can provide a seasonal measure of water accumulation, storage, and loss, which is useful for extrapolation to the greater population of glaciers in the region (Riedel and Burrows, 2005).
Level One: Equilibrium Line Altitude and Accumulation-Area Ratio
It is well established that the equilibrium line altitude (ELA) (altitude on a glacier where annual accumulation equals annual ablation) at the end of the ablation season is directly related to the annual mass balance of the glacier (Paterson, 1994). If annual mass balance increases, the ELA will be located at a lower elevation. Conversely, an unusually high ELA indicates a decrease in annual mass balance. Figure 2 shows the position of the ELA on an unnamed cirque glacier in Denali National Park and Preserve in Alaska. If the area above or below the ELA and the total glacier area (see Vital Sign 3) are known, an accumulation area ratio (AAR) can be calculated. The AAR is determined by dividing the glacier’s accumulation area by the total glacier area (Paterson, 1994). Monitoring annual variations in the ELA and AAR of a glacier provides a good estimate of changes in mass balance and variations in climate. There are a variety of acceptable methods for determining ELA, including repeat photography, direct survey with a Global Positioning System (GPS) receiver, and satellite or aerial imagery. Due to the low relative cost, the repeat photography method is presented here.
Methodology. Repeat photography methodology for monitoring the ELA and AAR consists of photo site selection and establishment, photography, ELA plotting, and AAR calculation. The two options for selecting a photo site are to establish a new site or to reoccupy the site of an historic photograph. Reoccupying a previous photo location is preferable if a quality historic photograph of the glacier exists and was taken from an acceptable location. The following criteria should be considered when evaluating a potential photo site: current and future view of the equilibrium line, accessibility, repeatability, and potential hazards. The photo site can be permanently established by installing a fence post, reinforcing bar (rebar) stake, or expansion bolt and washer, or by selecting a suitable natural feature, such as a boulder, as a marker. The position of the site marker is recorded with a GPS receiver and marked on a map. The photo site is photographed and a written description of the location is recorded to assist in relocating the site in the future. The tripod and camera is positioned at the marked location and several images with bracketed exposures are captured. A field notebook is used to record the photo direction, tripod height, lens focal length, camera data, exposure number, date and time, weather conditions, and other observations. For detailed information about photographic monitoring field methods and techniques see Hall (2002), Jorgenson et al. (2006), and National Park Service (2006). The photographs are used to visually estimate and plot the ELA position on a map or to digitize it using geographic information systems (GIS) software. If a digital elevation model (DEM) of the glacier and surrounding area is available, the oblique photographs can be georeferenced to the DEM and the ELA and area of the glacier can be precisely digitized using GIS software. See Corripio (2004) for detailed instructions for georeferencing oblique photographs to DEMs. If the total glacier area is available, the ELA is used to determine the area of the accumulation zone. The AAR is calculated by dividing the accumulation area by the total glacier area.
Equipment and costs. Depending on location and accessibility, monitoring the ELA of a glacier with repeat photography can be an effective and economical technique that requires little specialized training and equipment. The monitoring technician should possess a basic understanding of photographic techniques, GPS receiver operation, and map reading skills. Knowledge of GIS is helpful for basic analysis but is not required. Advanced GIS skills are required to georeference the photographs to a DEM and perform the data analysis. The necessary equipment includes a digital camera, tripod, compass, GPS receiver, field notebook, and topographic map. See National Park Service (2006) for a detailed equipment list. Other useful equipment and supplies includes a tape measure, hammer, hand drill, expansion bolts and washers, steel fence posts or concrete rebar stakes, GIS workstation, and a DEM of the glacier and surrounding area (Hall, 2002). The required equipment is widely available and can be purchased from consumer home improvement and photographic supply stores for a few hundred dollars.
Limitations. The primary limitation of this method is that it is an approximation of glacier mass balance. The actual relationship of AAR to mass balance differs from glacier to glacier. Also, it makes the assumption that the snowline is the equilibrium line. While this assumption is fairly accurate for most temperate glaciers, at higher elevations and latitudes the effect of internal refreezing of meltwater at the base of the season snowpack becomes important. In this situation, the refrozen meltwater looks like ice or firn (recrystallized and partially compacted snow from previous seasons) rather than seasonal snow, and the estimated ELA is mistakenly plotted too high on the glacier (Paterson, 1994). This error has never been quantified. Poor topographic map accuracy of the glacier may contribute to errors in plotting the ELA location. This concern is important because most topographic maps are decades old, despite revision dates, and given the general recession of most glaciers they are no longer accurate. Lastly, timing is a limitation because it is important to perform the monitoring near the end of the ablation season, before the first snowfall.
Interpretation. While ELA and AAR do not provide estimates of mass change, unless other site specific information is available, they are good indicators of variations in glacier mass balance and climatic conditions (Meier and Post, 1962; Østrem, 1975). If annual mass balance increases, the ELA will be located at a lower elevation and the AAR will be larger, and vice versa. A “typical” alpine glacier with a mass balance of zero will have an AAR value between 0.5 (Meier and Post, 1962) and 0.7 (Paterson, 1994). If mass balance measurements are available, a relationship between ELA and mass balance can be established, and the mass balance measurements can be terminated. However, the glacier cannot change geometry (area-altitude) signifi cantly; otherwise the relation between the two variables will change.
Level Two: Glaciological Mass Balance
The glaciological method is the most widely used technique for monitoring glacier mass balance (Singh and Singh, 2001). Direct measurement of glacier mass balance components provides the most detailed information about the processes that control mass balance, spatial differences, and changes over time (Fountain et al., 1997). Mass balance for the entire glacier is determined based on a number of repeated point measurements on the glacier surface (Paterson, 1994). The depth of snow or ice that has accumulated or ablated at each point is measured and multiplied by the snow or ice density to determine the mass balance at that point (Kaser et al., 2003). The point values are interpolated and extrapolated across the glacier surface to calculate the mass balance for the entire glacier.
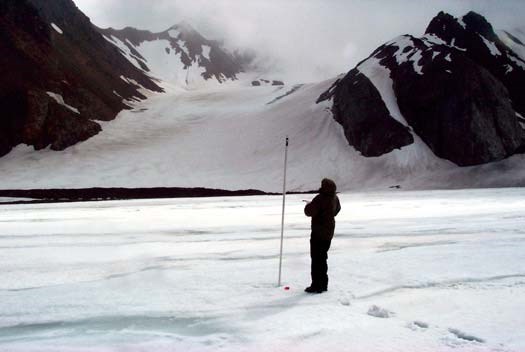
The network of ablation stakes is used in conjunction with snow pits to determine the depth of snow or ice that has melted or accumulated at each measurement location on the glacier (Kaser et al., 2003). Ablation determinations are made by measuring the length of exposed stakes with a tape measure at the beginning and end of the mass balance year. The stakes can be used to measure accumulation if the depth of new snow does not exceed the length of exposed stakes. This is often not possible because in many areas deep snow accumulations bend or break installed stakes; therefore, snow accumulation depths must be determined using snow pits or snow-depth probes (Kaser et al., 2003; Riedel and Burrows, 2005). Figure 4 illustrates the use of snow-depth probes. The density of the snow is determined using a snow density tube and a scale (Kaser et al., 2003).
The mass change at each ablation site is calculated by multiplying the change in length of the exposed stakes at the end of the mass balance season by the density of the snow or ice. The density of snow needs to be determined in the field. See Riedel and Burrows (2005) for detailed field methods for measuring snow density. Glacier ice is assumed to have a density of 900 kg m–3 (Paterson, 1994). The mass gained or lost at each stake location is calculated and extrapolated across the entire glacier surface to determined total mass balance. The interpolation/extrapolation of the point data varies according to glacier conditions and the person making the evaluation. See Geografiska Annalar 81A (1999) for several articles presenting a variety of interpolation/extrapolation methods. A GIS method
is presented by Riedel and Burrows (2005) and the contour method is explained by Kaser et al. (2003).
Timing and frequency. At a minimum, mass balance field visits should be conducted biannually—one visit at the end of the accumulation season and one at the end of the ablation season (Kaser et al., 2003). This schedule allows direct measurement of the magnitude of seasonal accumulation and ablation (Fountain et al., 1997). Additional visits may be required to inspect and maintain/replace ablation stakes, particularly in regions where ice melt exceeds several meters per summer (Kaser et al., 2003).
Equipment and costs. Monitoring glacier mass balance with the glaciological method is a technique of moderate cost that requires a high level of specialized training and equipment. The monitoring technicians should possess a basic understanding of glaciology and snow science, GPS receiver operation, GIS mapping techniques, and glacier safety. The minimum required equipment includes: a GIS workstation or topographic map, GPS receiver, ablation stakes, a steam drill or ice auger, snow probes, snow density tube, scale, snow shovel, and tape measure. The necessary computer hardware and GIS software can be purchased for approximately $2,000 (all amounts herein are in US$), and a GPS unit will cost a few hundred dollars. The ablation stakes can be constructed for a few dollars per stake with materials purchased from a home improvement store. A steam drill will cost several thousand dollars, while the ice auger option will cost only a few hundred dollars. The remaining equipment can be purchased for a few hundred dollars.
Limitations. The glaciological method is an excellent technique for assessing glacier mass balance; but it does have several inherent limitations. One potential limitation is that this method does not account for ablation due to calving (Fountain et al., 1997). Mass balance calculations on calving glaciers require the monitoring of the terminus position and glacier velocity to determine calving rates. A second limitation is that the glaciological method only measures ablation on the glacier surface. Approximately 90% of ablation occurs on the glacier surface; thus it is assumed that the subsurface change is negligible and can be ignored in the calculations (Mayo, 1992; Riedel and Burrows, 2005). The third limitation is that crevasses or steep terrain may not allow installation of stakes in a desired arrangement. Other complications include field visits under adverse weather conditions, complicated and expensive logistics and labor, and the slow rate of data acquisition (Kaser et al., 2003).
Interpretation. The glaciological method is considered to be the most accurate surface-based method to date and provides highly detailed information on the spatial variation of mass balance magnitudes. Monitoring glacier mass balance provides insights into the hydrologic cycle of the glacier and allows a comprehensive evaluation of glacier dynamics.
Level Three: Geodetic Mass Balance
Geodetic mass balance is determined by calculating an ice mass’s volumetric change through time from repeated topographic surveys of surface elevation and extent (Paterson, 1994). This technique offers a remote-sensing alternative or complement to the field-based glaciological method. There are several acceptable methods for determining the geodetic mass balance of a glacier, including the use topographic maps, DEMs based on satellite or aerial imagery, and light detection and ranging (LIDAR) surveys (Kaser et al., 2003). The aerial photography method is presented here.
Methodology. The comparison of vertical aerial photography with geodetic control from two different time periods provides an efficient method of assessing changes in the volume of a glacier. The geodetic mass balance methodology consists of image acquisition, image scanning and georeferencing, DEM production, and glacier change calculation. Images are obtained through vendors or appropriate government agencies specializing in aerial photography. The acquired images must be of sufficient scale to discern glacier margins from the surrounding terrain and should be taken late in the ablation season (Riedel and Burrows, 2005). A useful scale for small glaciers, such as those found in Washington and Oregon, is 1:12,000 scale (Riedel and Burrows, 2005). The purchased images should be photogrammatically corrected, georeferenced, used to produce a DEM with an appropriate grid interval, and delivered in a GIS-compatible digital format. A grid interval of 25 m was used successfully to measure the geodetic mass balance of Gulkana Glacier in Alaska (Cox and March, 2004). Surface elevation change is calculated using GIS software by subtracting coregistered DEMs from different time horizons (Cox and March, 2004). Refer to Granshaw (2002) for a detailed procedure for determining surface elevation changes using a GIS. The net change in glacier mass balance over the time interval between aerial photos is calculated by multiplying the density of glacier ice by the change in volume (Cox and March, 2004).
Timing and frequency. Aerial photography flights should be scheduled to coincide with the late-summer end of the ablation season when the maximum area of snow-free ice is exposed (Fountain et al., 1997). The interval between photographic surveys can range from a few years to a few decades, depending on monitoring objectives and financial resources (Cox and March, 2004). Mapping should be conducted in years of minimal snow because anomalous late-season snow can obscure the terminus or margins and make it impossible to accurately determine glacier extent (Riedel and Burrows, 2005).
Equipment and costs. Monitoring glacier mass balance changes with aerial photography is an efficient technique that requires specialized training and equipment. Producing aerial photographs requires a large capital investment and expert personnel; therefore images must be purchased from remote-sensing vendors or obtained from the appropriate government agencies. The monitoring technician responsible for the analysis should possess a basic understanding of remote-sensing techniques and be competent in the use of GIS. The necessary materials and equipment includes: large-scale, digital, georeferenced images, derived DEMs, and a GIS workstation. The minimum required computer hardware and GIS software can be purchased for approximately $2,000. The cost of the aerial photographs is highly variable. Depending on the area and scale desired, imagery costs can range from free image data sets available on the Internet to over $100,000 for commissioned, custom products. For example, North Cascades National Park in Washington paid approximately $70,000 in 1998 to obtain 1:12,000 scale, color, stereo air photos of the 2800 km2 park (Riedel and Burrows, 2005).
Limitations. The geodetic method is an effective technique for remotely assessing glacier volume change, but it does have several inherent limitations. The primary limitation of this method is the high cost of obtaining geodetic-quality aerial imagery (Riedel and Burrows, 2005). The second limitation is the potential error derived from assuming “the density of the material gained or lost is equal to the density of ice” (Cox and March, 2004). This assumption may result in overestimating the mass of snow and firn in the accumulation area. Other complications include errors from areas of limited photographic contrast (including icefields with limited relief), and poor DEM registration, typical of the snow-covered accumulation zones (Arendt et al., 2002; Andreassen, 1999; Østrem and Haakensen, 1999).
Interpretation. It is important to note the difference between this method and the glaciological method because the products can be confused. The geodetic method produces a volume change for the entire glacier, which after some assumptions about density, is converted to mass change. This method provides an important check on the glaciologic method and should be used in conjunction with it. The geodetic method does not provide point-specific mass balance data, such as annual mass balance up a centerline. For example, a glacier in equilibrium will show zero volume change and zero elevation change up the centerline. In contrast, the glaciological method will show increasingly negative mass balance down glacier from the equilibrium line and increasingly positive mass balance up glacier. The sum of the glaciologic mass balance along the centerline would be zero. The difference in results from the geodetic and glaciologic methods is because the geodetic method measures the geometric response to changes in mass input and output, whereas the glaciologic method measures the actual input and output.
The greatest utility of the geodetic mass balance method is in calculating average balances over long periods of time and in validating the glaciological cumulative mass balance (Singh and Singh, 2001; Elsberg et al., 2001). This technique can be used to extend the mass balance record into the past by applying the methodology to historic aerial photography and topographic maps.
Vital Sign 2: Glacier Terminus Position
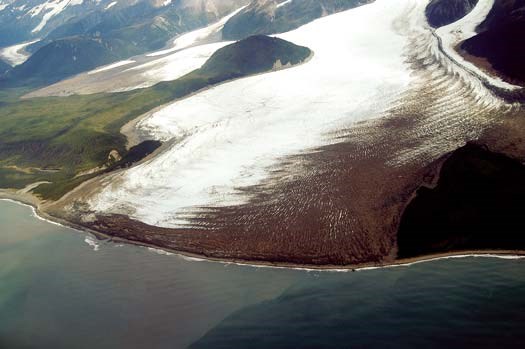
Level One: Repeat Photography
Repeat photography is a useful tool for documenting changes of glacier terminus position. Based on landmarks in the photograph, the glacier terminus position can be approximated and sketched on a map. Photo pairs or sequences of images provide visual representation of glacier change over time, and the mapped terminus positions can be used to estimate changes in glacier length and area.
Methodology. Repeat photography methodology for monitoring a glacier terminus position consists of photo site selection and establishment, photography, and terminus plotting. The two options for selecting a photo site are to establish a new site or to reoccupy the site of an historic photograph. Figures 6 and 7 present an example of a photo pair utilizing historical photography. Reoccupying a previous photo location is preferable if a quality historic photograph of the glacier exists and was taken from an acceptable location. The following criteria should be considered when evaluating a potential photo site: current and future view of the glacier terminus, accessibility, repeatability, and potential hazards. The photo site can be permanently established by installing a fence post, rebar stake, or expansion bolt and washer, or by selecting a suitable natural feature, such as a boulder, as a marker. The position of the site marker is recorded with a GPS receiver and plotted on a map. The photo site is photographed and a written description of the location is recorded to assist in relocating the site in the future. The tripod and camera is positioned at the marked location and several images with bracketed exposures are captured. A field notebook is used to record the photo direction, tripod height, lens focal length, camera data, date and time, weather conditions, and other observations. For detailed information about photographic monitoring field methods and techniques see Hall (2002), Jorgenson et al. (2006), and National Park Service (2006). The photographs are used to visually estimate and plot the terminus position on a map, or they are digitally captured using GIS software. If a DEM of the glacier and surrounding area is available, the oblique photographs can be georeferenced to the DEM and the terminus position of the glacier can be precisely digitized using GIS software. See Corripio (2004) for detailed instructions for georeferencing oblique photographs to DEMs.
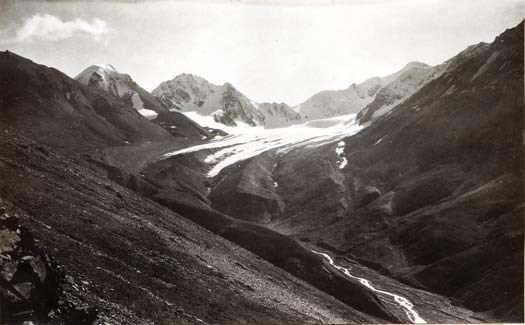
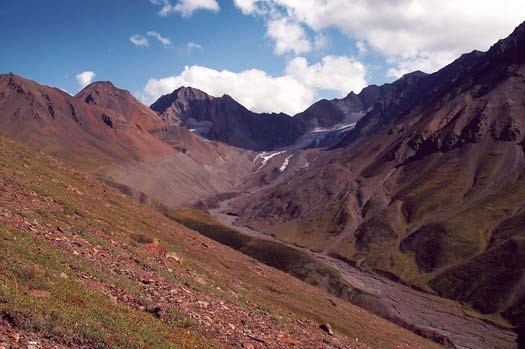
Limitations. The primary limitation of this method is that unless the photograph is georeferenced to a DEM, it is an approximation of the terminus position based on the interpretation of the monitoring technician, rather than an unbiased and precise measurement.
Interpretation. Interpretations from this monitoring technique require the comparison of a minimum of two mapped terminus positions. For this reason it is beneficial to reoccupy a site of an existing historical photograph. This approach facilitates future analysis, but also allows an immediate assessment of past changes with only one monitoring visit. Changes in glacier terminus position generally result in changes in glacier area (Fountain et al., 1997). Therefore, it is logical to assume that if the glacier advances, the surface area has also increased; if the glacier retreats, the surface area has decreased. It is possible to crudely estimate volume changes based on changes in the terminus position, but caution must be exercised, as a glacier may advance and increase surface area without changing volume. Similarly, a glacier with insulating debris covering the terminus may thin without a corresponding retreat of the terminus. Using the photo pairs to quantify glacier change is the primary goal of this method, but the anecdotal and educational value of the photo pairs themselves should not be overlooked.
Level Two: Survey Terminus with GPS
Surveying the position of a glacier terminus with GPS is a simple but effective method of monitoring glacier terminus change. Depending on the access and size of the glacier and the mapping precision required, the terminus is mapped either by walking or flying along the snout of the glacier with the GPS receiver recording a track log, or by surveying with a laser range finder and a GPS, using offset mapping techniques. The comparisons of mapped terminus positions over time provide a record of glacier change and can be used to calculate changes in glacier length and area and provide insights into changes in glacier volume.
Methodology. The methodology for monitoring glacier terminus change with GPS mapping consists of data collection, post-processing, and GIS analysis. If the glacier terminus is safe and accessible by foot, data collection consists of mapping the position of the terminus by recording a GPS track log while walking along the glacier terminus. A similar technique can be employed on large glaciers by flying along the terminus in a helicopter while recording a GPS track log. Alternatively, glaciers with inaccessible termini may be surveyed from a safe location by performing offset mapping using a laser range finder in conjunction with a GPS unit. If the GPS receiver supports realtime differential correction, it should be employed during data collection. After the GPS data is collected, it is downloaded to a computer and differentially corrected using data collected simultaneously at a GPS base station. Post-processing the GPS data reduces errors, including the signal degrading effects of the atmosphere, and improves the accuracy of the data. Positional accuracy of differentially corrected data is generally less than 5 m. Data is imported into the GIS for inspection and quality control. Any points that severely deviate from the general trend of the track log and represent obvious errors should be removed from the data set. The GPS points collected in the track log are used to construct a line representing the terminus position of the glacier. The GIS is used to compare the current terminus position with those collected in previous and subsequent years.
Timing and frequency. Terminus mapping visits should be conducted at the late-summer end of the ablation season when the maximum area of snow-free ice is exposed (Fountain et al., 1997). Under ideal circumstances, terminus monitoring and mapping should occur on an annual basis. If yearly field visits are not practical, monitoring should generally occur on a five- to ten-year schedule. It is important to note that the terminus position of calving glaciers can change significantly over a brief period and may require a shorter (one- to five-year) monitoring interval (Post, 1975). Conversely, a longer (five- to ten-year) monitoring interval may be adequate for small cirque glaciers (Fountain et al., 1997). If significant changes are observed during the interim period between mapping visits, a more frequent monitoring schedule may be appropriate.
Equipment and costs. Monitoring glacier terminus changes with GPS mapping is a technique of moderate cost that requires a moderate level of specialized training and equipment. The monitoring technician should possess an understanding of GPS and GIS mapping techniques. The minimum required equipment includes a GIS workstation and consumer-grade GPS receiver. If high-precision results are desired, a survey-grade GPS receiver and base station are necessary. The necessary computer hardware and GIS software can be purchased for approximately $2,000; consumer-grade GPS receivers are widely available and can be purchased from electronic and outdoor equipment stores for a few hundred dollars. A survey-grade GPS system and a laser range finder will cost several thousand dollars.
Limitations. The primary limitation of ground-based GPS mapping is that it is highly labor intensive and inefficient for monitoring a large number of glaciers. Another limitation is that the glacier terminus can be an inaccessible and dangerous place. Hazards include icefalls, calving events, rockfall, and stream crossings. These issues can sometimes be mitigated through the technique of offset mapping with a laser range finder and a GPS unit. Glaciers with debris-covered termini pose a substantial challenge for mapping. It can be difficult to discern debris-covered ice from the surrounding terrain. It may also be difficult to differentiate stagnant ice from active ice. Data collectors should also be aware that poor GPS signal reception is commonly encountered in narrow valleys and other terrain with a limited view of the sky. An additional consideration is that it is important to perform the monitoring near the end of the ablation season.
Interpretation. Interpretations from this monitoring technique require the comparison of a minimum of two mapped terminus positions. The first data collection season will establish a baseline for future comparison. The use of the GIS for data analysis facilitates calculating changes in glacier length and estimating changes in glacier area using the mapped terminus positions. It is possible to estimate volume changes based on changes in glacier surface area; however, as mentioned in the previous section, caution must be exercised, as it is possible for a glacier to change in volume without a corresponding change in terminus. The greatest utility of this method is the ability to identify general trends and estimate rates of glacier change.
Level Three: Aerial Photos or Satellite Images
Vertical aerial photographs and satellite images are a highly efficient tool for documenting changes of glacier terminus positions (Fountain et al., 1997). Remote-sensing techniques allow the monitoring of a large number of glaciers without the effort associated with field-based techniques. Additionally, historic aerial photos or satellites images of glaciers are often available, extending the terminus monitoring record into the past. Historical sequences of images provide a visual representation of glacier change over time, and are useful for communicating glacier change to diverse audiences. Glacier terminus positions can be digitized from georeferenced images using a GIS. The digitized terminus positions are then used to quantify changes in glacier length and area.
Methodology. Vertical aerial photography and satellite imagery with ground control “provides a quantitative base for accurate mapping of surface features” (Granshaw, 2002). The methodology consists of image acquisition, image scanning and georeferencing, and glacier terminus digitizing. Images are obtained through vendors or appropriate government agencies specializing in aerial photography or satellite imagery (examples include Landsat, ASTER, or IKONOS). The acquired images must be of sufficient resolution to discern glacier margins from the surrounding terrain and must be taken late in the ablation season (Riedel and Burrows, 2005). A useful scale for small glaciers, such as those found in North Cascades National Park in Washington, is 1:12,000 scale (Riedel and Burrows, 2005). Larger glaciers like the tidewater glaciers located in Southeast Alaska can be photographed at larger scales. The purchased images should be georeferenced and delivered in a GIS-compatible digital format. Once the images are loaded into the GIS, the spatial position of the glacier terminus is recorded using manual, on-screen digitizing techniques (Riedel and Burrows, 2005).
Timing and frequency. According to Fountain et al. (1997), satellite or aerial photographic surveys should occur “late in the summer so the terminus will be in its most retracted position; the transient snowline nearest its final, seasonal position; and the accumulation- rea ratio at its seasonal minimum.” The satellite or aerial surveys should generally be conducted on a five- to ten-year schedule. It is important to note that the terminus position of calving glaciers can change significantly over a brief period and may require a shorter (one- to five-year) monitoring interval (Post, 1975). Conversely, a longer (five- to ten-year or longer) monitoring interval may be adequate for small cirque glaciers (Fountain et al., 1997). If significant changes are observed during the interim period between surveys, a more frequent schedule may be appropriate.
Equipment and costs. Monitoring glacier terminus changes with aerial photography or satellite images is an efficient technique that requires highly specialized training and equipment.
The costs associated with this technique are directly related to the size of the area covered and the desired resolution of the imagery. Producing aerial photographs and satellite images requires a large capital investment and expert personnel; therefore, images must be purchased from remote-sensing vendors or produced by appropriate government agencies. The monitoring technician should possess a basic understanding of remote-sensing techniques and be competent in the use of GIS. The necessary materials and equipment includes large-scale, digital, georeferenced images and a GIS workstation. The required computer hardware and GIS software can be purchased for approximately $2,000. The cost of the aerial photographs or satellite images is highly variable. Depending on the area and scale desired, imagery costs can range from free image data sets available on the Internet to over $100,000 for custom products.
Limitations. In many cases, the primary limitation of this method is the high cost of obtaining large-scale satellite or aerial imagery (Williams et al., 1991). Aerial imagery of mountainous environments often contains shadowed areas that may conceal glacial margins, making it difficult to interpret the glacial boundary. Debris-covered glaciers pose a substantial challenge for mapping, as it can be difficult to discern debris-covered ice from the surrounding terrain. Additionally, it is important to differentiate between stagnant ice and the active ice terminus. Another issue is timing; it is important to acquire the satellite or aerial photography late in the ablation season, but before the first snowfall of winter.
Interpretation. Interpretations from this monitoring technique require the comparison of a minimum of two mapped terminus positions. If no historical aerial imagery exists, the first digitized data set will establish a baseline for future comparison, and may be useful for comparisons with historic terminus positions derived from terminal moraines. The use of the GIS for data analysis facilitates the comparison of the mapped terminus positions and aids in the quantification of glacier change by calculating changes in glacier length and estimating changes of glacier area. This method allows the efficient monitoring of future glacier change over large areas and the ability to systematically integrate historic imagery to identify past trends.
Vital Sign 3: Glacier Area
Monitoring changes in glacier area is important because it generally provides a direct measure of glacier advance and retreat and the associated creation or destruction of terrestrial and aquatic habitats (Riedel and Burrows, 2005). Measuring the surface area of a glacier is critical for calculating glacier mass balance, identifying the location of the ELA, and calculating accumulation-area ratios. Monitoring changes in glacier area provides an indicator linking the response of glacier length to changes in mass balance (Kaser et al., 2003). Documenting long-term trends of glacier area change provides a good index for understanding local climatic changes.
Level One: Repeat Photography
Repeat photography is a useful tool for documenting changes in glacier area. The position of the glacier margin can be approximated based on landmarks in the photograph, and then sketched on a map. Photo pairs or sequences of images provide visual representation of glacier change, and the mapped area can be used to quantify changes and identify trends in glacier length, width, and area.
Methodology. The methodology consists of photo site selection and establishment, photography, and glacier margin plotting. The two options for selecting a photo site are to establish a new site or to reoccupy the site of an historic photograph. Reoccupying a previous photo location is preferable if a quality historic photograph of the glacier exists and was taken from an acceptable location. The following criteria should be considered when evaluating a potential photo station: current and future view of the glacier margins, accessibility, repeatability, and potential hazards. The photo station can be established by installing a fence post, rebar stake, or expansion bolt and washer, or by selecting a suitable natural feature, such as a boulder, as a marker. The position of the site marker is recorded with a GPS receiver and marked on a map. The photo site is photographed and a written description of the location is recorded to assist in relocating the site in the future. The tripod and camera is positioned at the marked location and several images with bracketed exposures are captured. Figure 8 illustrates a typical photo station. A field notebook is used to record the photo direction, tripod height, lens focal length, camera data, exposure number, date and time, weather conditions, and other observations. For detailed information about photographic monitoring field methods and techniques see Hall (2002), Jorgenson et al. (2006), and National Park Service (2006). Large glaciers may require several photo stations for complete coverage. In the office, the photographs are used to plot the estimated glacier margin positions on a map or are digitized using GIS software. If a DEM of the glacier and surrounding area is available, the oblique photographs can be georeferenced to the DEM and the area of the glacier can be precisely digitized using GIS software. See Corripio (2004) for detailed instructions for georeferencing oblique photographs to DEMs.
Equipment and costs. Monitoring glacier area changes with repeat photography is an economical technique that requires little specialized training and equipment. The monitoring technician should possess a basic understanding of photographic techniques, GPS operation, and map reading skills. Knowledge of GIS is helpful for basic analysis but not required. Advanced GIS skills are required to georeference the photographs to a DEM and perform the data analysis. The necessary equipment includes a digital camera, tripod, compass, GPS receiver, field notebook, and topographic map. See National Park Service (2006) for a detailed equipment list. Other useful equipment includes a tape measure, hammer, hand drill, expansion bolts and washers, steel fence posts or concrete rebar stakes, GIS workstation, and a DEM of the glacier and surrounding area (Hall, 2002). The required equipment is widely available and can be purchased from consumer home improvement or photographic supply stores for a few hundred dollars.
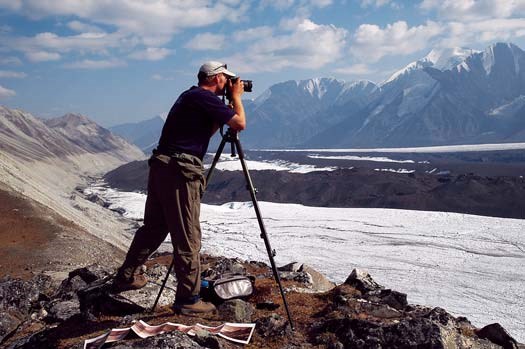
Limitations. The primary limitation of this method is that unless the photograph is georeferenced to a DEM, it is only an approximation of the area, based on the interpretation of the monitoring technician rather than an unbiased and precise measurement. Potential sources of errors are the “measurement of areas covered by snow or debris, and improperly located ice divides” (Riedel and Burrows, 2005).
Interpretation. Interpretations from this monitoring technique require the comparison of a minimum of two mapped glacier areas. For this reason it is beneficial to reoccupy sites of existing historical photographs. This approach facilitates future analysis, but also allows an immediate assessment of past changes with only one monitoring visit. It is possible to crudely estimate volume changes based on changes in glacier surface area, but caution must be exercised, as it is possible for a glacier to change in surface area without changing volume. Using the photo pairs to quantify glacier change is the primary goal of this method, but the anecdotal and educational value of the photo pairs themselves should not be overlooked.
Level Two: Survey Area with GPS
Surveying the surface area of a glacier with GPS is a simple but effective method of monitoring glacier change. Depending on the access and size of the glacier and desired mapping precision, the glacier area is mapped either by walking or flying in a helicopter along the margin of the glacier with the GPS receiver recording a track log, or by surveying with a laser range finder and a GPS using offset mapping techniques. The comparisons of mapped glacier areas over time provide a quantitative record of glacier change.
Methodology. The methodology for monitoring glacier area change with GPS mapping consists of data collection, postprocessing, and GIS analysis. Data collection involves visiting the glacier and recording a GPS track log while walking the margin of the glacier. The area of large tide-water glaciers or other glaciers that are inaccessible or dangerous can be mapped in a similar fashion by recording a GPS track log while flying along the margin in a helicopter. Alternatively, some glaciers with inaccessible margins can be surveyed from a safe location by performing offset mapping using a laser range finder in conjunction with a GPS unit. If the GPS receiver supports real-time differential correction it should be employed during data collection. After the GPS data is collected, it is downloaded to a computer and differentially corrected using data collected simultaneously at a GPS base station. Post-processing the GPS data mitigates the signaldegrading effects of the atmosphere and improves the accuracy of the data. Positional accuracy of differentially corrected data is generally less than 5 m. Data should be imported into the GIS for inspection and quality control. Any points that severely deviate from the general trend of the track log and/or represent obvious error should be removed from the data set. The GPS points collected in the track log are used to construct a polygon representing the area of the glacier. The GIS is used to compare the current area with data collected in previous and subsequent years. Using these techniques, changes in glacier length and area can be quantified and monitored.
Timing and frequency. Area mapping visits should be made in late summer near the end of the ablation season when the maximum area of snow-free ice is exposed (Fountain et al., 1997). Under ideal circumstances, area mapping should occur on an annual basis. If yearly mapping is not practical, monitoring should generally occur on a five- to ten-year schedule. It is important to note that the area of calving glaciers can change significantly over a brief period and may require a shorter (one- to five-year) mapping interval (Post, 1975). Conversely, a longer (five- to ten-year) monitoring interval may be adequate for small cirque glaciers (Fountain et al., 1997). If significant changes are observed during the interim period between mapping visits, a more frequent monitoring schedule may be appropriate.
Equipment and costs. Monitoring glacier area changes with GPS mapping is a technique of moderate cost that requires a moderate level of specialized training and equipment. The monitoring technician should possess an understanding of GPS and GIS mapping techniques. The minimum required equipment includes a GIS workstation and consumer-grade GPS receiver. If high-precision results are desired, a survey-grade GPS receiver and base station are necessary. The necessary computer hardware and GIS software can be purchased for approximately $2,000; consumer-grade GPS receivers are widely available and can be purchased from electronic stores for a few hundred dollars. A survey-grade GPS system and a laser range fi nder will cost several thousand dollars.
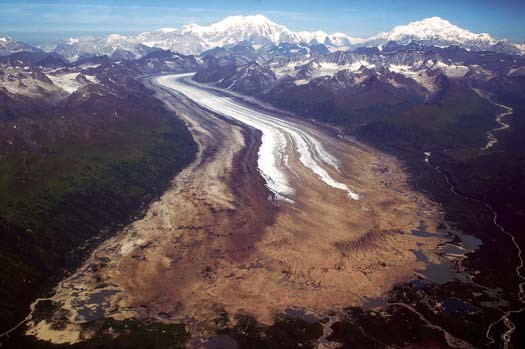
Limitations. The primary limitation of ground-based GPS mapping is that it is highly labor intensive and inefficient for monitoring a large number of glaciers or glaciers that are large in area. Another limitation is that glacier margins can be inaccessible and dangerous. Hazards include icefalls, calving events, rockfall, and stream crossings. These issues can sometimes be mitigated through the use of aircraft, but aerial GPS mapping is costly and lacks the precision of a ground-based survey. Glaciers with debris-covered termini, like the Kahiltna Glacier in Figure 9, pose a substantial challenge for mapping. It can be difficult to discern debris-covered ice from the surrounding terrain. It may also be difficult to differentiate stagnant ice from active ice. Data collectors should also be aware that poor GPS signal reception is commonly encountered in narrow valleys and other terrain with a limited view of the sky. An additional issue is timing; it is important to conduct the monitoring near the end of the ablation season but before the first snowfall.
Level Three: Aerial Photos or Satellite Images
Vertical aerial photographs and satellite images are a highly efficient tool for documenting changes of glacier area (Fountain et al., 1997). Remote-sensing techniques allow the monitoring of a large number of glaciers without the effort associated with field-based techniques. Historical sequences of images provide a visual representation of glacier change over time and are useful for communicating glacier change to diverse audiences. Glacier areas can be digitized from georeferenced images using a GIS. The first set of digitized areas can be compared to measurements from subsequent years to identify trends and quantify rates of changes in glacier length and area.
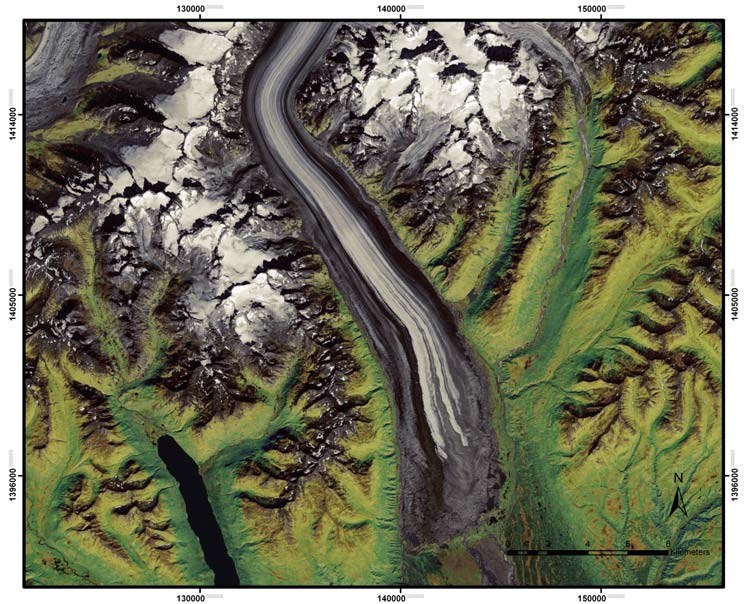
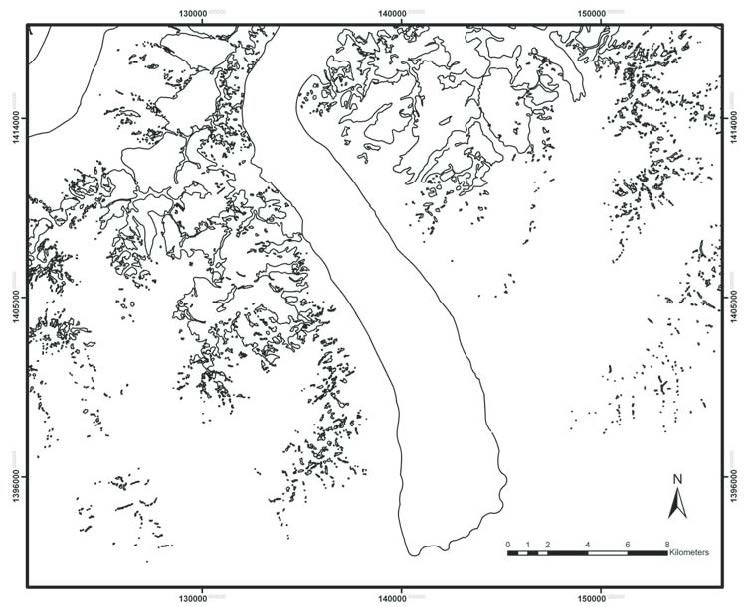
Methodology. Vertical aerial photography and satellite imagery with ground control “provides a quantitative base for accurate mapping of surface features” (Granshaw, 2002). The methodology consists of image acquisition, image scanning and georeferencing, and glacier area digitizing. Images are obtained through vendors or appropriate government agencies specializing in aerial photography or satellite imagery. The acquired images should be of sufficient scale to discern glacier margins from the surrounding terrain and must be taken late in the ablation season, before the first snowfall (Riedel and Burrows, 2005). A useful scale for small glaciers, such as those found in Washington, is 1:12,000 scale (Riedel and Burrows, 2005). Larger glaciers like the tidewater glaciers located in Southeast Alaska can be photographed at larger scales. The purchased images should be georeferenced and delivered in a GIS-compatible digital format. Once the images are loaded into the GIS, the spatial position of the glacier area is recorded as a polygon, using manual, on-screen digitizing techniques (Riedel and Burrows, 2005). Figures 10 and 11 show a Landsat TM-7 image of the Kahiltna Glacier and the digitized glacier and perennial snow polygons.
Timing and frequency. According to Fountain et al. (1997) satellite or aerial photographic surveys should occur “late in the summer so the terminus will be in its most retracted position; the transient snowline nearest its final, seasonal position; and the accumulation-area ratio at its seasonal minimum.” The satellite or aerial surveys should generally be conducted on a five- to ten-year schedule. It is important to note that the terminus position of calving glaciers can change significantly over a brief period and may require a shorter (one- to five-year) monitoring interval (Post, 1975). Conversely, a longer (five- to ten-year or longer) monitoring interval may be adequate for small cirque glaciers (Fountain et al., 1997). If significant changes are observed during the interim period between surveys, a more frequent schedule may be appropriate.
Equipment and costs. Monitoring glacier area changes with aerial photography or satellite images is an efficient technique that requires highly specialized training and equipment. Producing aerial photographs and satellite images requires a large capital investment and expert personnel; therefore, images must be obtained from remote-sensing vendors or the appropriate government agencies. The monitoring technician should possess a basic understanding of remote-sensing techniques and be competent in the use of GIS. The necessary materials and equipment includes large-scale, digital, georeferenced images and a GIS workstation. The required computer hardware and GIS software can be purchased for approximately $2,000. The cost of the aerial photographs or satellite images is highly variable. Depending on the area and scale desired, imagery costs can range from free images available on the Internet to over $100,000 for custom products.
Limitations. The primary limitation of this method is the high cost of obtaining large-scale satellite or aerial imagery (Williams et al., 1991). Aerial imagery of mountainous environments often contains shadowed areas that may conceal glacial margins, making it difficult to interpret the glacial boundary. Debris-covered glaciers pose a substantial challenge for mapping, as it can be difficult to discern debris-covered ice from the surrounding terrain. Additionally, it is important to define where the stagnant ice ends and the active ice terminus begins. It is important that the satellite or aerial photography survey occur late in the ablation season before the first snowfall of winter.
Interpretation. Interpretations from this monitoring technique require the comparison of a minimum of two mapped glacier areas. If no historical aerial imagery exists, the first digitized data set season will establish a baseline for future comparison. The use of the GIS for data analysis facilitates the comparison of the mapped areas and allows the quantification of glacier change by calculating changes in glacier length and area. The greatest utility of this method is the ability to identify quantifiable trends and rates of glacier change.
Vital Sign 4: Glacier Surface Velocity
Glacier surface velocity is a measure of the rate at which a glacier is moving downhill under the influence of gravity, through the processes of sliding on its bed and internal deformation of the ice (Singh and Singh, 2001). Generalized, singular velocities are often presented for entire glaciers, but it is wrong to imagine the motion of the glacier to be like that of a train, uniformly descending a mountain pass. On the contrary, the nature of glacier movement is temporally and spatially variable.
Increases in the climatic variables of temperature and precipitation can affect glacier velocity. An increase in air temperature increases ice temperature; which correspondingly reduces the ice viscosity and increases glacier velocity. Increasing the air temperature increases the volume of basal meltwater, which reduces basal friction and increases glacier velocity. If precipitation increases, the ice thickness also increases, which can result in increased glacier velocity.
Level One: Repeat Photography
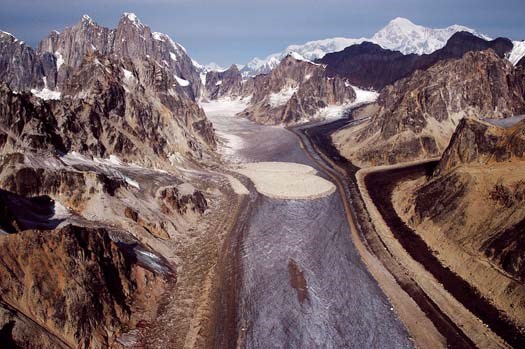
Repeat photography is a useful tool for determining the general surface velocity of a glacier. Based on landmarks in the photograph, the position of natural targets on the glacier surface can be approximated and plotted on a map. The change in distance of the location of the target in the photo pairs, and the known interval of time between images can be used to calculate the surface velocity of the glacier at the target location.
Timing and frequency. Repeat photography visits must be scheduled when the natural target is snow-free and easily visible. Under ideal circumstances, a camera with an intervalometer can be permanently fixed at the photo station, capturing time-lapse images at a rate of one or two frames per day. In many cases a permanent camera may not be practical; therefore, weekly, monthly, or annual photo station visits may be appropriate.
Equipment and costs. Monitoring glacier velocity with repeat photography is an economical technique that requires little specialized training and equipment. The monitoring technician should possess a basic understanding of photographic techniques, GPS operation, and map reading skills. Knowledge of GIS is helpful for basic analysis but not required. Advanced GIS skills are required to georeference the photographs to a DEM and perform the data analysis. The necessary equipment includes a digital camera, tripod, compass, GPS receiver, field notebook, and topographic map. See National Park Service (2006) for a detailed equipment list. Other useful equipment and supplies includes a weather-proof camera housing, tape measure, hammer, hand drill, expansion bolts and washers, steel fence posts or concrete rebar stakes, GIS workstation, and a DEM of the glacier and surrounding area (Hall, 2002). The required equipment is widely available and can be purchased from consumer home improvement or photographic supply stores for a few hundred dollars. A basic GIS workstation can be purchased for approximately $2,000.
Limitations. Using repeat photography to monitor glacier surface velocity has many limitations. The primary limitations of this method are that monitoring is restricted to glaciers with easily identifiable, natural targets, and that measurements are limited to a few sample locations on each glacier. Each monitoring location has fixed life span because the natural target will eventually move down the glacier and out of the field of view of the camera station or reach terminus of the glacier and stop moving. Other limitations are that measurements must be made during the snowfree summer season and are restricted to the ablation zone, due to year-round snow coverage of potential natural targets in the accumulation zone. Finally, unless the photograph is georeferenced to a DEM, plotting the position of the natural target on the map is an approximation based on the interpretation of the monitoring technician rather than an unbiased and precise measurement.
Interpretation. The results of this monitoring technique should be judiciously interpreted due to the many limitations previously presented. The paucity of data produced with this method precludes an in-depth analysis of ice dynamics, but may provide a useful indication of the dynamic response of the glacier to changes in mass balance (Kaser et al., 2003).
Level Two: GPS Survey
Surveying the position of artifi cial targets on the surface of a glacier with GPS is a simple but highly precise method of monitoring glacier surface velocity. This technique requires installing velocity stakes on the glacier surface and repeatedly surveying the position of the stakes using high-precision GPS. The change in distance of the location of the velocity stake and the known interval of time between surveys can be used to calculate the surface velocity of the glacier at the target location.
Methodology. The methodology for monitoring surface velocity with GPS surveying consists of velocity stake installation, data collection, post-processing, and velocity calculation. A convenient alternative to installing new stakes specifically for glacier velocity monitoring is to utilize stakes installed for mass balance monitoring (Kaser et al., 2003). If mass balance stakes are not available, velocity stakes must be installed by drilling a small diameter hole several meters deep with a steam drill or ice auger and inserting the velocity stake. Data collection involves recording a precise location of the velocity stake using a survey-grade GPS receiver. Figure 13 shows a high-precision GPS receiver mounted to a mass balance monitoring stake. To maximize precision, the position of the lowest exposed portion of the stake should be used for the measurement (Kaser et al., 2003). If the GPS receiver supports real-time differential-correction it should be employed during data collection. After the GPS data is collected, it is downloaded to a computer and differentially corrected using data collected simultaneously at a GPS base station. Post-processing the GPS data mitigates the signal degrading effects of the atmosphere and improves the accuracy of the data. Positional accuracy of differentially corrected data collected with a survey-grade GPS receiver is generally within a few centimeters (Vadon and Berthier, 2004). At this point, data should be imported into the GIS for inspection and quality control. After the prescribed interval, the velocity stake must be resurveyed. Calculating the surface velocity requires dividing the change in distance of the velocity stake (calculated using the GIS) by the change in time between surveys. The calculated velocity can be presented on a topographic map as a vector representing the magnitude and direction of the measurement (Singh and Singh, 2001).
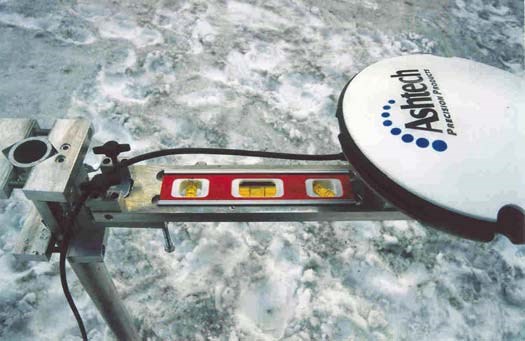
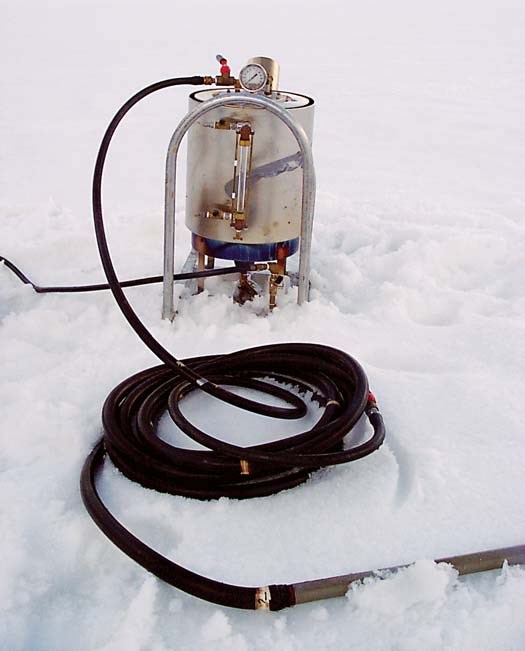
Equipment and costs. Monitoring glacier velocity with GPS surveying is a technique of moderate cost that requires a moderate level of specialized training and equipment. The monitoring technician should possess an understanding of GPS surveying and GIS mapping techniques. The minimum required equipment includes: velocity stakes made of aluminum, PVC pipe, or wood; a steam drill or ice auger; a GIS workstation; and a survey-grade GPS receiver and base station. The velocity stakes can be purchased from a home improvement store for a few dollars per stake. A steam drill, like the one pictured in Figure 14, will cost several thousand dollars, while the ice auger will cost a few hundred dollars. The necessary computer hardware and GIS software can be purchased for approximately $2,000; a survey-grade GPS system will cost several thousand dollars.
Limitations. The primary limitation of ground-based GPS surveying is that it is highly labor intensive and limited to the accessible portions of the glacier (Berthier et al., 2005). Surveying enough points to satisfy a complex ice-dynamics investigation is generally time-consuming and expensive. Data collectors should also be aware that poor GPS signal reception is commonly encountered in narrow valleys and other terrain with a limited view of the sky.
Interpretation. Despite the limitations, monitoring glacier surface velocity with GPS by utilizing existing mass balance stakes, or installing velocity stakes, provides a good indication of the glacier’s dynamic response to changes in mass balance (Kaser et al., 2003).
Level Three: Aerial Photos or Satellite Images
Tracking the motion of natural targets on a glacier surface using a series of vertical aerial photographs or satellite images is an effective technique for monitoring glacier velocity (Berthier et al., 2005; Hubbard and Glasser, 2005; Fountain et al., 1997; Harrison et al., 1992; Krimmel and Rasmussen, 1986; Meier et al., 1985). Remote-sensing techniques facilitate the monitoring of a large number of glaciers without the effort associated with field-based techniques. The displacement of natural features can be calculated from a series of georeferenced images using a GIS. The change in distance of the location of the target in the photo pairs and the known time interval between images can be used to calculate the surface velocity of the glacier at the target location.
Timing and frequency. The aerial photographs or satellite images must be taken when the natural target is snow-free and easily visible. Aerial imagery of mountainous environments often contains shadowed areas that may conceal portions of the glacier, making it difficult to identify the target; therefore images should be timed to avoid low sun-angles. Depending on the temporal resolution desired; annual to decadal monitoring may be appropriate.
Equipment and costs. Opportunistic monitoring of glacier velocity with aerial photography or satellite images is an effective technique that requires specialized training and equipment. Producing aerial photographs and satellite images requires a large capital investment and expert personnel; therefore, images must be purchased from remote-sensing vendors or government agencies. The monitoring technician should possess a basic understanding of remote-sensing techniques and be competent in the use of GIS. The necessary materials and equipment includes large-scale, digital, georeferenced images, and a GIS workstation. The required computer hardware and GIS software can be purchased for approximately $2,000. The cost of the aerial photographs or satellite images is highly variable. Depending on the area and scale desired, imagery costs can range from free image data sets available online to over $100,000 for custom products.
Limitations. The primary limitation of this method is the high cost of obtaining large-scale satellite or aerial imagery (Williams et al., 1991). Another potential limitation is that monitoring is restricted to glaciers with easily identifiable, natural targets, so measurements may be limited to a few sample locations on each glacier and may not be repeatable due to the target traveling down the glacier. Measurements are restricted to the ablation zone, because year-round snow covers most potential natural targets in the accumulation zone. Additionally, it is important that the satellite image or aerial photography survey occurs after the spring snowmelt, but before the first snowfall of winter to assure that the targets are visible.
Interpretation. The use of aerial photographs or satellite images is a proven method for monitoring glacier surface velocity. Interpretations from this monitoring technique require the comparison of images from a minimum of two time horizons. Historical images may be utilized to determine past surface velocities. If no historical aerial imagery exists, the first digitized data set will establish a baseline for future comparison. “For a long-term program, where the mass and volume of a glacier are expected to change, a coincident data set of flow information is useful for determining the dynamic response of glaciers to changes in mass input” (Fountain et al., 1997). Understanding how a glacier responds to changes in mass balance provides useful insight into how the glacier may respond to future climate changes.
STUDY DESIGN
Natural resource managers interested in monitoring glaciers must evaluate several study-specific variables before designing and implementing a glacier-monitoring plan. These criteria include: purpose of monitoring, availability of resources, study scale, and resource value. Defining these criteria will ensure that the glacier-monitoring plan will be successful in producing the appropriate data and decision-making information.
Monitoring Purpose
What are the goals of the glacier-monitoring study? The primary goal of most monitoring studies is to produce data and information for a wide range of uses (Haeberli, 1998). Typically, these uses include: providing information and evidence for management decisions and policy, producing data for the scientific community, and educational material for the general public. It is also important to define specific research goals for the study. For example, North Cascades National Park listed the following as the goals of its glacier-monitoring program: “(1) monitor the range of variation and trends in volume of glaciers in the park; (2) relate glacier changes to status of aquatic and terrestrial ecosystems; (3) link glacier observations to research on climate and ecosystem change; and (4) Share information on glaciers with the public and professionals” (Riedel and Burrows, 2005). Clearly defining the monitoring purpose allows the development of specific objectives necessary for achieving study goals.
Availability of Resources
What resources can be devoted to the glacier-monitoring study? Budget, personnel, and expertise are typically the limiting factors in most projects; therefore, is it important to identify these limitations and adapt the monitoring goals to the available resources. Limited resources should not preclude glacier monitoring. The vital signs presented in this chapter list a range of methods to fit most financial and personnel situations. Additionally, cost- sharing agreements with other projects should be considered when obtaining expensive material with multiple uses, such as aerial photography.
Study Scale
What is the extent of the study area and how large are the glaciers? This is an important consideration, because a park such as Wrangell–St. Elias National Park and Preserve in Alaska, with several thousand square kilometers of glaciers, will require a much different monitoring strategy than a park with only a few small glaciers, like Rocky Mountain National Park in Colorado. Parks with few glaciers may be able to intensively monitor all of the glaciers within their boundaries, while parks with a large number of glaciers should use an approach similar to the strategy developed by the U.S. Geological Survey (USGS) and outlined in Fountain et al. (1997). The USGS strategy “employs a nested approach whereby an intensively studied glacier is surrounded by less intensively studied glaciers and those monitored solely by remote sensing” (Fountain et al., 1997).
Resource Value
Why are glaciers important? Glaciers have signifi cant scientific and economic value. Monitoring glacier change is scientifically important because it links the impacts that glaciers impose on a variety of natural systems in the environment with the drivers that influence glacier health. The economic value of glaciers is related to their impact on regional water supplies and status as major tourist attractions.
CASE STUDY
The following case study illustrates the use of repeat photography for monitoring changes in glacier terminus position and area. Reid Glacier in Glacier Bay National Park and Preserve in Alaska was photographed in 2004 as part of a joint U.S. Geological Survey and National Park Service study assessing glacier change over the past century in several Alaska national parks. Beginning in 2003, the research project repeated over a hundred historic glacier photographs in Glacier Bay National Park and Preserve, Denali National Park and Preserve, and Kenai Fjords National Park.


The investigation consisted of searching photo archives, locating the historic photo stations, field visits, and data analysis. The majority of images used in this study were found at the U.S. Geological Survey Photo Library Collection in Denver, Colorado, and the National Snow and Ice Data Center (NSIDC) in Boulder, Colorado. The archive searches focused on collecting historic images of glaciers in Alaskan national parks. A large number of images taken by G.K. Gilbert during the Harriman Expedition in 1899 fit the search criteria. The locations of the photo stations were determined by consulting with National Park Service staff, triangulation using natural features, and trial and error. The photo stations were accessed by boat and on foot. The images in Figures 15 and 16 show a repeat photo pair of Reid Glacier in Glacier Bay National Park and Preserve in Alaska, taken by Gilbert in 1899 and by the author in 2004. Despite being located only 100 m above the shore, it took several hours of bushwhacking to locate this photo station. The location of the Reid Glacier photo station was recorded with a GPS receiver to expedite future visits. The 1899 Gilbert image consists of three mosaicked large-format images. To achieve a similar field of view and perspective, four images with a professional digital single-lens reflex camera with a 50 mm lens were required.
Data Analysis
Natural landmarks in the images were used to plot the 1899 and 2004 terminus positions on the topographic map in Figure 17. The terminus positions were digitized using GIS software. Based on the GIS analysis, Reid Glacier has retreated ~3.0 km and lost a total of ~4.5 km2 of ice during the 105 years between images.
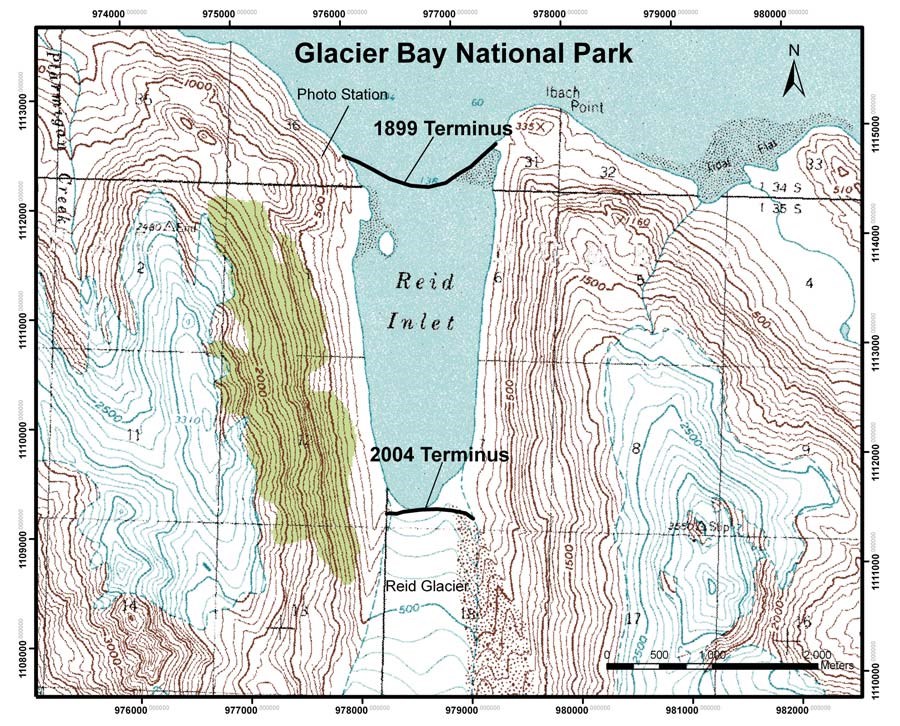
Glaciers are a dynamic natural resource that are influenced by environmental changes and have the capacity to alter local and global ecosystems. The glacier vital signs and associated monitoring levels presented in this chapter provide techniques for assessing glacier conditions and identifying trends in glacier change. The glacier monitoring methods presented in this chapter are summarized in Table 2. Several methods in this chapter can be used to monitor more than one vital sign. For example, repeat photography can be used to estimate glacier mass balance, terminus position change, area change, and velocity. Additionally, methods such as geodetic mass balance can be used to validate the results of the glaciological method. The techniques presented in this chapter are not intended as an exhaustive list of glacier research methods, but rather are designed to provide a variety of glacier monitoring options for a range of personnel resources and budget constraints. The goal of this chapter is to emphasize that regardless of the resources available, glacier monitoring can be conducted and valuable information can be produced. Monitoring glacier change generates critical data and information for conducting scientific research, making management decisions, and educating the public.
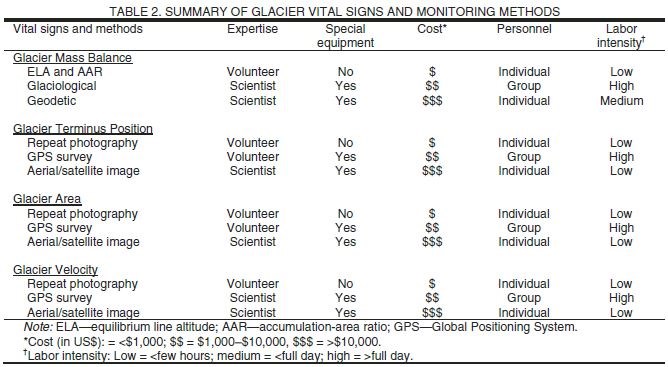
The following individuals provided valuable input and reviews of this chapter: Jonathan M. Achuff, Guy W. Adema, Roger G. Barry, Matthew J. Beedle, Andrew G. Fountain, Bruce A. Giffen, Lacy N. Karpilo, Siri Jodha Singh Khalsa, Bruce F. Molnia, Lisa Norby, Harold S. Pranger, Jon L. Riedel, Vincent L. Santucci, and Robert S. Young.
REFERENCES CITED
Adema, G.W., 2004, Geologic resources evaluation scoping meeting summary: U.S. National Park Service, Central Alaska Network, Anchorage, Alaska, 56 p.
Andreassen, L.M., 1999, Comparing traditional mass balance measurements with long-term volume change extracted from topographical maps: a case study of Storbreen glacier in Jotunheimen, Norway, for the period 1940–1997: Geografi ska Annaler, v. 81A, p. 467–476, doi: 10.1111/j.0435- 3676.1999.00076.x.
Arendt, A.A., Echelmeyer, K.A., Harrison, W.D., Lingle, C.S., and Valentine, V.B., 2002, Rapid wastage of Alaska glaciers and their contribution to rising sea level: Science, v. 297, p. 382–386, doi: 10.1126/ science.1072497.
Berthier, E., Vadon, H., Baratoux, D., Arnaud, Y., Vincent, C., Feigl, K.L., Remy, F., and Legresy, B., 2005, Surface motion of mountain glaciers derived from satellite optical imagery: Remote Sensing of Environment, v. 95, p. 14–28, doi: 10.1016/j.rse.2004.11.005.
Corripio, J.G., 2004, Snow surface albedo estimation using terrestrial photography: International Journal of Remote Sensing, v. 25, no. 24, p. 5705–5729, doi: 10.1080/01431160410001709002.
Cox, L.H., and March, R.S., 2004, Comparison of geodetic and glaciological mass-balance techniques, Gulkana Glacier, Alaska, U.S.A: Journal of Glaciology, v. 50, p. 363–370, doi: 10.3189/172756504781829855.
Driedger, C.L., and Fountain, A.G., 1989, Glacier outburst floods at Mount Rainier, Washington State, U.S.A., in Wold, B. ed., Proceedings of the symposium on snow and glacier research relating to human living conditions: Annals of Glaciology, v. 13, p. 51–55.
Dyurgerov, M.B., 2002: Glacier mass balance and data of measurements and analysis: Institute of Arctic and Alpine Research, University of Colorado, Boulder, Occasional Paper, 275 p.
Elsberg, D.H., Harrison, W.D., Echelmeyer, K.A., and Krimmel, R.M., 2001, Quantifying the effects of climate and surface change on glacier mass balance: Journal of Glaciology, v. 47, p. 649–658, doi: 10.3189/172756501781831783.
Fountain, A.G., and Vecchia, 1999, How many stakes are required to measure the mass balance of a glacier?: Geografiska Annaler, v. 81A, p. 563–573.
Fountain, A.G., and Tangborn, W.V., 1985, The effect of glaciers on stream flow variations: Water Resources Research, v. 21, p. 579–586, doi: 10.1029/WR021i004p00579.
Fountain, A.G., Krimmel, R.M., and Trabant, D.C., 1997, A strategy for monitoring glaciers: U.S. Geological Survey Circular 1132, 19 p.
Fountain, A.G., Hoffman, M.J., Jackson, K.M., Basagic, H.J., Nylen, T., and Percy, D., 2007, Digital Outlines and Topography of the Glaciers of the American West: U.S. Geological Survey Open-File Report 2006-1340, 23 p.
Granshaw, F.D., 2002, Glacier change in the North Cascade National Park Complex, Washington, 1958 to 1998 [M.S. Thesis]: Portland State University, 94 p.
Haeberli, W., 1998, Historical evolution and operational aspects of worldwide glacier monitoring, in Haeberli, W., Hoelzle, M., and Suter, S., eds., Into the Second Century of World Glacier Monitoring—Prospects and Strategies: Paris, UNESCO Publishing, 35–51.
Hall, F.C., 2002, Photo point monitoring handbook: General Technical Report PNW-GTR-526, Portland, Oregon: U.S. Department of Agriculture, Forest Service, Pacific Northwest Research Station, 134 p.
Harrison, W.D., Echelmeyer, K.A., Cosgrove, D.M., and Raymond, C.F., 1992, The determination of glacier speed by time-lapse photography under unfavorable conditions: Journal of Glaciology, v. 38, p. 257–265.
Heucke, E., 1999, A light portable steam-driven drill suitable for drilling holes in ice and firn: Geografi ska Annaler, v. 81A, p. 603–609, doi: 10.1111/j.0435-3676.1999.00088.x.
Hooke, R.L., 2005, Principles of glacier mechanics: Cambridge, United Kingdom, Cambridge University Press, 429 p.
Hubbard, B., and Glasser, N.F., 2005, Field techniques in glaciology and glacial geomorphology: West Sussex, United Kingdom, John Wiley and Sons, 400 p.
Huybrechts, P., De Nooze, P., and Decleir, H., 1989, Numerical modeling of Glacier d’Argentiere and its historic front variations, in Oerlemans, J., ed., Glacier fluctuations and climatic change: Boston, Kluwer Academic Publishers, p. 373–390.
Jorgenson, M.T., Frost, G.V., Lentz, W.E., and Bennett, A.J., 2006, Photographic monitoring of landscape change in the southwest Alaska network of national parklands: Report No. NPS/AKRSWAN/NRTR-2006/03. Fairbanks, Alaska: ABR, Inc., Environmental Research & Services, 214 p.
Kaser, G., Fountain, A., and Jansson, P., 2003, A manual for monitoring the mass balance of mountain glaciers: UNESCO, Paris, IHP-VI Technical Documents in Hydrology No. 59, 107 p.
Knight, P.G., 1999, Glaciers: Cheltenham, United Kingdom, Stanley Thornes Ltd., 261 p.
Krimmel, R.M., and Rasmussen, L.A., 1986, Using sequential photography to estimate ice velocity at the terminus of Columbia Glacier, Alaska: Annals of Glaciology, v. 8, p. 117–123.
Mayo, L.R., 1992, Internal ablation: an overlooked component of glacier mass balance: Eos (Transactions, American Geophysical Union) v. 73, no. 43, Fall Suppl., Abstract H22A-9, p. 180.
Meier, M.F., 1964, Ice and glaciers, in Chow, V., ed., Handbook of applied hydrology: New York, McGraw Hill, 32 p.
Meier, M.F., and Post, A.S., 1962, Recent variations in mass net budgets of glaciers in Western North America: International Association of Scientific Hydrology (IAHS), Publication No. 58, p. 63–77.
Meier, M.F., Rasmussen, L.A., Krimmel, R.M., Olsen, R.W., and Frank, D., 1985, Photographic determination of surface altitude, terminus position, and ice velocity of Columbia Glacier, AK: U.S. Geological Survey Professional Paper 1258-F, 41 p.
Meierding, T.C., 1982, Late Pleistocene glacial equilibrium-line altitudes in the Colorado Front Range: A comparison of methods: Quaternary Research, v. 18, p. 289–310, doi: 10.1016/0033-5894(82)90076-X.
Mercanton, P.L., 1916, Vermessungen am Rhonegletscher. Mensurations au Glacier du Rhone 1874–1915: Geleitet und herausgegeben von der Gletscher-Kommission der Schweizerishen Naturforschenden Gesselschaft, v. LII, 190 p.
Molnia, B.F., 1993, Major glacier surge continues: Eos (Transactions, American Geophysical Union), v. 74, p. 521–524, doi: 10.1029/93EO00675.
National Park Service, 2006, Photo monitoring procedure for the Southwest Alaska Network (SWAN), documenting a photopoint using digital photography, Alaska standard operating procedure (SOP) #1: U.S. National Park Service, Alaska, v. 1.0, 7 p.
Østrem, G., 1975, ERTS data in glaciology—an effort to monitor glacier mass balance from satellite imagery: Journal of Glaciology, v. 16, p. 403–415.
Østrem, G., and Brugman, M., 1991, Glacier mass balance measurements: A manual for field and office work: Saskatoon, Saskatchewan, Environment Canada, National Hydrology Research Institute, NHRI Science Report 4.
Østrem, G., and Haakensen, N., 1999, Map comparison or traditional mass balance measurements: which method is better?: Geografi ska Annaler,v. 81A, p. 703–711, doi: 10.1111/j.0435-3676.1999.00098.x.
Paterson, W.S.B., 1994, The physics of glaciers, third edition: Oxford, Elsevier, 480 p.
Porter, S.C., 1977, Present and past glaciation thresholds in the Cascade Range, Washington—Topographic and climatic controls and paleoclimatic implications: Journal of Glaciology, v. 18, p. 101–116.
Post, A.S., 1975, Preliminary hydrography and historic terminal changes of Columbia Glacier, Alaska: U.S. Geological Survey Hydrographic Investigations Atlas 559, 3 sheets.
Post, A.S., and Mayo, L.R., 1971, Glacier dammed lakes and outburst floods in Alaska: U.S. Geological Survey Hydrological Investigations Atlas HA-455, 3 sheets, scale 1:1,000,000.
Post, A., Richardson, D., Tangborn, W.V., and Rosselot, F.L., 1971, Inventory of glaciers in the North Cascades, Washington: U.S. Geological Survey Professional Paper, 705-A, 26 p.
Riedel, J.L., and Burrows, R.A., 2005, Long term monitoring of small glaciers at North Cascades National Park: a prototype park for the North Coast and Cascades Network: North Cascades National Park, Washington, 39 p.
Rodbell, D.T., 1992, Late Pleistocene equilibrium-line reconstructions in the northern Peruvian Andes: Boreas, v. 21, p. 43–52.
Singh, P., and Singh, V.P., 2001, Snow and glacier hydrology: Dordrecht, Netherlands, Kluwer Academic Publishers, 742 p.
Tangborn, W.V., 1980, Two models for estimating climate-glacier relationships in the North Cascades, Washington, USA: Journal of Glaciology, v. 25, p. 3–21.
Vadon, H., and Berthier, E., 2004, Measurement of glacier velocity fields using very precise multitemporal correlation on high resolution SPOT5 images: ISPRS Symposium, Istanbul, July 2004.
Williams, R.S., Jr., Hall, D.K., and Benson, C.S., 1991, Analysis of glacier facies using satellite techniques: Journal of Glaciology, v. 37, p. 120–128.
SELECTED REFERENCES FOR FURTHER READING
Cox, S.M., and Fulsaas, K., eds., 2003, Mountaineering freedom of the hills, seventh edition: Seattle, Washington, The Mountaineers Books, 575 p. (This book provides detailed information on equipment and techniques for all aspects of mountaineering and backcountry travel. The chapters on snow and glacier travel and safety are highly relevant for anyone working on or around glaciers.)
Fountain, A.G., Krimmel, R.M., and Trabant, D.C., 1997, A strategy for monitoring glaciers: U.S. Geological Survey Circular 1132, 19 p. (The authors of this U.S. Geological Survey paper present rationale, techniques, and study design information for monitoring glaciers in Alaska and the continental United States. The monitoring strategy utilizes three hierarchical levels of monitoring intensity; ranging from intensive glaciological mass balance studies to region-wide remote-sensing inventories.)
Hall, F.C., 2002, Photo point monitoring handbook: General Technical Report PNW-GTR-526: Portland, Oregon, U.S. Department of Agriculture, Forest Service, Pacific Northwest Research Station, 134 p. (This handbook details the methodology for monitoring vegetation and soil change with repeat photography. Although this handbook does not focus on glaciers, many of the techniques and procedures presented in this publication can be adapted for monitoring glaciers.)
Hubbard, B., and Glasser, N.F., 2005, Field techniques in glaciology and glacial geomorphology: West Sussex, United Kingdom, John Wiley and Sons, 400 p. (This book details a variety of glacier research methods and techniques. The authors successfully communicate technical information in a manner that is understandable to a broad audience, ranging from undergraduates to professionals.)
Kaser, G., Fountain, A., and Jansson, P., 2003, A manual for monitoring the mass balance of mountain glaciers: Paris, UNESCO, IHP-VI Technical Documents in Hydrology No. 59, 107 p. (All aspects of designing a glacier monitoring plan and conducting fieldwork are presented in this manual. Glacier travel, mountain safety, and first aid are also addressed.)
Knight, P.G., 1999, Glaciers: Cheltenham, United Kingdom, Stanley Thornes Ltd., 261 p. (This general glaciology textbook is targeted at undergraduate students and non-glaciologists. This resource is helpful for readers unfamiliar with the field of glaciology.)
Reardon, B.A., Harper, J.T., and Fagre, D.B., 2008, Mass balance of a cirque glacier in the U.S. Rocky Mountains: in Proceedings of the mass balance measurement and modeling workshop, Skeikampen, Norway, 5 p. (This paper concisely presents a case study detailing the monitoring of Sperry Glacier in Glacier National Park, Montana.)
Riedel, J.L., and Burrows, R.A., 2005, Long term monitoring of small glaciers at North Cascades National Park: a prototype park for the North Coast and Cascades Network: North Cascades National Park, Washington, 39 p. (The complete glacier-monitoring plan for North Cascades National Park is presented in this paper. The plan details standard operating procedures for a variety of glacier monitoring techniques, including glaciological mass balance and a park-wide glacier inventory using aerial images. This document is an excellent model of a comprehensive glacier-monitoring plan.)
