Last updated: January 31, 2025
Article
Denali's Muldrow Glacier
Chasing the Muldrow Glacier: Denali’s Muldrow Glacier is surging for the first time in 64 years and scientists are rapidly responding
On March 4, 2021, K2 Aviation pilot Chris Palm was flying on the north side of Mount McKinley and noticed unusual activity on the Muldrow Glacier. The Muldrow Glacier, which is usually slow moving and relatively smooth, suddenly appeared thoroughly fractured by cracks, called crevasses. The heavy crevassing extended throughout nearly the entire length of the glacier, indicating that the Muldrow Glacier had finally begun its long-awaited surge. A glacial surge is a short-lived, cyclical event where ice within a glacier advances suddenly and substantially, sometimes moving at speeds 10 to 100 times faster than normal.

Photograph by Chris Palm
This section of glacier is normally easily and safely traversed and is the common northern route up Mount McKinley, but may be impossible to cross after the surge, which is to be expected based on reports from climbers after the 1956-57 surge and the abundant recent imagery collected from the current surge.
The Muldrow Glacier is a 39-mile-long glacier that originates high on the northeastern slope of Mount McKinley and flows to the McKinley River. The last surge of the Muldrow occurred in 1956-57, at which time the glacier advanced over 4 miles. Evidence of earlier surges, including one between 1906 and 1912, indicate that the Muldrow Glacier has a history of surging approximately every 50 years.

Imagery is Alaska SDMI SPOT 5 Mosaic Dataset (2010-2013), glacier outlines are from Randolph Glacier Inventory.
Anatomy of a Surge-type Glacier
All glaciers are defined by ice flowing downhill. However, in some glaciers this flow does not occur at a constant rate. Surge-type glaciers are characterized by short periods of rapid flow (surges) followed by longer periods when the ice is slow moving or stagnant (quiescence). During a surge, ice is transferred from a reservoir area in the upper portion of the glacier to the terminus. It is estimated only about one percent of the world’s glaciers surge (Jiskoot et al. 1998). Denali National Park Preserve contains several surge-type glaciers, most of which emanate from the face of the mountain itself.
For over six decades, Muldrow Glacier has been in its quiescent phase, which has shaped this well known glacier’s familiar appearance. Features that developed during the period included heavy debris cover, ponds and flowing water at the glacier’s surface, and relatively few crevasses.
This surge is suddenly and dramatically transforming the Muldrow Glacier’s appearance. One of the most visually striking of these features are the large and pervasive crevasses forming throughout most of the glacier. These crevasses reflect increased deformation within the glacier because of the rapid flow of the surge. Additional features include sheared tributary glaciers and advance of the terminus of the glacier.


Left image
On the left, the heavy debris cover and surface ponds associated with the quiescent stage are seen.
Credit: Alaska SDMI SPOT 5 Mosaic Dataset (2010-2013)
Right image
On the right, the heavy crevassing caused by the surge is seen.
Credit: NPS Image


Left image
Satellite imagery of Muldrow Glacier from 2010-2013
Credit: Alaska SDMI SPOT 5 Mosaic Dataset (2010-2013)
Right image
Aerial imagery of the same area taken on March 17, 2021
Credit: NPS Image

NPS Photo

NPS Photo

NPS photo

NPS Photo
What Causes a Glacier to Surge?
Glacier surges are likely caused by the interplay of ice buildup at higher elevations over time, and supply of the ever-present meltwater to the base of a glacier. During the long quiescent (or non-surge) period of surge type glaciers, ice accumulates and thickens on the upper glacier over many years with only a slow flow or transfer of ice to the lower glacier. At some point during this quiescent phase (which varies in length among different surge type glaciers), the glacier thickness reaches a threshold where the internal hydrology of the glacier is disrupted. Much of the meltwater that typically drains to the glacier bed and emerges at the terminus becomes trapped at the base of the glacier. This accumulated meltwater lubricates the interface between the ice mass and the ground and may even lift the ice itself – both leading to less friction and faster glacier flow. Once the surge begins, a positive feedback between enhanced sliding and the destruction of existing meltwater channels can, for a time, contribute to the speed and duration of the surge. Typically, however, the glacier’s internal plumbing system is eventually overwhelmed by the accumulated meltwater, and the sequestered water is released at the glacier terminus, often in a sudden outburst flood. Small secondary surges may occur, but after most meltwater is released a surge type glacier will return to its quiescent phase and once again begin accumulating mass in its depleted upper elevations.
Science Response: What Are We Doing Now?
Satellite Data Analysis
Satellite data analysis done a few days after we received photos of the heavily crevassed glacier confirmed the Muldrow Glacier is surging and the surge started sometime in January. Mark Fahnestock (University of Alaska Fairbanks) and Bretwood Higman created animations of the Muldrow surge using Sentinel Synthetic Aperture Radar (SAR) images. Imaging radars like Sentinel 1 SAR send pulses of microwaves at the surface and record the intensity of the energy scattered back to the satellite. SAR can “see” the surface through the frequent cloud cover and darkness of winter at this latitude, allowing us to view the motion of the Muldrow Glacier as the surge begins and then accelerates around the corner toward the glacier’s end. The ice is moving 50-60 feet per day by the animation’s end.

Animation courtesy of Mark Fahnestock, containing modified Sentinel 1 and Sentinel 2 data provided by European Space Agency.
Aerial Surveys and Structure from Motion Mapping
The surface of the surging Muldrow Glacier has now been mapped in detail twice (on March 13 and March 17, 2021) using a method called Structure from Motion. Structure from Motion (SfM) is a photogrammetry technique that stitches together many aerial photographs of an object to create an elevation map. High-resolution cameras and an accurate GPS are used to geotag about 1000 aerial photographs to produce the elevation models.

Repeatedly making 3D models of the surface of the glacier can highlight changes over time and help scientists calculate flow rates throughout the glacier. Scientists plan to conduct SfM flights at least twice every month and less than a week apart. Frequently repeating these data-gathering flights will help the computer algorithms to properly recognize and match ice features it uses to track the motion of the glacier’s rapidly changing surface in order to accurately calculate velocities of the ice. For example, the heaviest crevassed area of the glacier is just below the Brooks Glacier (center top of image below). This velocity model has a blank area where the computer was unable to recognize any features in the ice between subsequent images, and as a result it was unable to calculate velocities for that area. These SfM data set will be the highest resolution imagery and digital elevation maps we collect for this project.

Figure courtesy of Mark Fahnestock.
Continuous GPS
Two GPS units were placed on the glacier on March 28, 2021, that will record positions every 30 seconds. These units will monitor detailed vertical and horizontal changes. With two GPS units continually operating, park scientists are hoping to capture the detailed motion of the glacier during the surge and how the surge ends. Is the motion of a surging glacier smooth and continuous, or are there velocity changes during the surge? Previous studies have found that glacier surges can stop suddenly, often in a matter of hours or days, and usually associated with a dramatic and potentially dangerous outburst flood. If these units are able to capture the end of the surge, will scientists observe the elevation of the glacier change? If so, will it be associated with an outburst flood? Will there be a gradual slow down, or an abrupt end to the surge?
These GPS units have a high potential to answer some of the questions, but they are also tenuous. Providing power to continuously operating GPS units on a rapidly moving and changing glacier is challenging. And, more importantly, safely maintaining the GPS units during the surge when crevasses can appear suddenly around the units will become increasingly challenging the longer the surge continues. One or both of the units may need to be removed while it is still safe to retrieve them before the surge ends.

NPS Photo
Time-lapse Cameras
Four time-lapse cameras were placed during the first instrumentation trip on March 28th. Two were placed at the great corner near Anderson Pass, one looking up the main stem of the glacier and one looking down towards the toe. These cameras will capture the fastest moving portion of the glacier and the growth of the ice wall that is forming.

NPS Photo
One camera was placed at the terminus of the glacier to monitor the advance of the ice front as it bulldozes the dead-ice moraine.

NPS Photo

NPS Photo
Scientists plan to install a telemetered time-lapse camera at the toe of the glacier and at the McKinley River to remotely monitor the advance of the ice and the river flow. Return to this webpage to check if these cameras were installed on the planned maintenance trip in mid-April.
Sound Station – “Can you imagine what this sounds like?!”
After hearing about the surge, scientists were just as excited to learn what a surging glacier sounds like, considering the massive amounts of ice-fall occurring and the actively grinding glacier ice. Fortunately, the Alaska Region Soundscape Program Manager, Davyd Betchkal, is based in Denali, and he was able to assist the team in setting up and placing a sound station that records sound levels as well as continuous audio recordings along the main stem of the glacier. The long-term sound monitoring plan includes a repeat sound station location in the middle of the Muldrow Glacier, which will allow the park to share sound clips of the normal glacier soundscape and compare it to what will likely be a much louder soundscape during the surge.

NPS Photo
Seismic Monitoring
The surge is being captured by a seismic station located near the Eielson Visitor Center on top of Thorofare Ridge. The cracking, popping, ice-fall, and grinding of the ice has caused an increase in the baseline noise at the station. Although subtle, there was a clear uptick in energy in December. This seismic station may be our best telemetered information for monitoring the activity of the surge. Visit the Alaska Earthquake Center website to see the current activity level of the surge.

Potential Impacts/ What Can Be Seen Summer 2021?
It’s still uncertain what the extent of the impacts Muldrow Glacier’s surge will have on visitors to Denali National Park this summer, or in the future. Some short term impacts could include:
-
The old debris-covered ice visible from the Eielson Visitor Center may be broken up, creating a stark contrast between the freshly exposed ice and the surrounding landscape. More visible ‘white’ ice in the lower reaches of the glacier. Elevated ice structures may also be visible from the Park Road and the Eielson Visitor Center. These features will gradually collapse after ice stops moving. The bulging toe of the glacier should also be visible from the Eielson Visitor Center.
-
Outburst flood risk is high along the McKinley River around and beyond the terminus of the Muldrow Glacier. Outburst flooding can occur with little warning, and will likely make the McKinley River very dangerous, or impossible, to cross this summer. Visitors interested in accessing this area are advised to proceed with extreme caution and check in with the NPS Backcountry Information Center prior to their trip.
-
The old debris-covered ice along the last few miles of the Muldrow Glacier may be dramatically broken up. As a result, the backpacking route over this portion of the glacier that is normally used to access the Pirate Creek area (Backcountry Unit 19) may not be traversable. The surging ice may or may not advance through the current area of debris covered terminal ice.
-
The common northern route up Mount McKinley involves crossing the Muldrow Glacier, which is normally easily, but may be impossible to cross after the surge due to unsafe ice conditions.
Visitors hoping to get a closer look at the Muldrow Glacier during the summer are advised to proceed with caution, and avoid travel on or directly adjacent to the glacier. The jumbled ice is highly unstable.
When Will the Surge End?
The amount of ice movement has been tracked based on distinctive medial moraines using a Sentinel 2 image from September 2020 and the new SfM imagery from March 2021. The ice has moved 1.1-3.1 km in the main stem of the Muldrow with the greatest motion just upstream from the great bend and less motion at the terminus and the upper elevations. Comparing that to the 1956-57 ice movement of 6.6 km estimated by Post (1960), we may only be about halfway through the surge.
As of March 17, 2021, the active terminus has advanced 3.5 km since September 2020. It is already within 800 meters of the extent of the 1957 surge. At 10 m/day the terminus will reach the 1957 moraine sometime in June.
1956/57 Muldrow Glacier Surge
The last major surge of the Muldrow Glacier occurred in 1956-57. Observations by climbers and debris patterns suggest that the surge initiated in May 1956 on the Traleika Glacier, the largest tributary of the Muldrow (Harrison 1964; Harrison 1969). Huge crevasses formed as the surge wave moved down the glacier. Photographs from July 16th, 1956 show no change below the right-angle turn near the terminus of the Muldrow Glacier, but observable crevassing up-glacier that may have been the wave of advancing ice (Post 1960). In January 1957, NPS staff noticed the lower part of the glacier was thicker and more crevassed than the previous year, indicating that the surge had reached the terminus. The terminus of the Muldrow advanced throughout the summer of 1957, amounting to a total estimated advance of more than three miles (Millett 1960). Practically all motion ceased in August 1957 and by September the advance was over (Millett 1960).
The 1956/57 surge caused dramatic changes to Muldrow Glacier and its tributaries. About 3.3 km3 of Ice was redistributed from the upper and middle portions of the glacier to the toe (Post 1960). This caused lowering of the ice surface by 170 m in the upper parts of the glacier; lateral moraines were stranded and the lowering of the main trunk left some of the smaller glacier tributaries hanging by as much as 61 m (Post 1960). In contrast, the toe of the glacier gained ice, causing the surface to rise and the toe to advance forward forming a wall of ice 200 feet tall (Millett 1960).
The following are quotes from scientists studying the surge in 1957 that describe some of the changes they observed:
“To observe and photograph this phenomenon we made numerous overnight expeditions up the lateral moraine of the Muldrow to Anderson’s Pass. Where once you looked down onto the Glacier from the ridge along Glacier Creek, you now looked a hundred feet up into the air at the bizarre seracs which are over-running and pushing up under the green tundra. At places high up on the ice one could observe a mesa of grass and willow that had been lifted up by the force of the moving ice. At other spots, wild flowers waved in the sunlight a few inches away from slabs of ice that would soon engulf them. A chain of small lakes formed along the lateral moraine, some of which would drain out overnight as water cut an outlet.” – Morton Wood, from Millett (1960).
“Above the big icefall at Gunsight Pass, the glacier has remained unchanged. Below Gunsight Pass to the terminus, it is a mass of jumbled ice blocks and crevasses that appear to bar any possible travel. A group of mountaineers from Everett, Washington spent three weeks trying to find a route from McGonagall Pass out onto the glacier so they could climb the mountain. They returned defeated. In late August Celia Hunter and Garry Kenwood managed to ford the McKinley River, now swollen from the quantity of melting ice at lower altitudes, and made their way up to McGonagall. They reported the glacier at the point had dropped more than two hundred feet, leaving just a shelf of old ice clinging to the cliffs about thirty feet broad. Beyond this a sheer precipice fell away to the main glacier mass far below. To find a route onto Mt. McKinley from this approach will now be a major undertaking for mountain climbers.” – Morton Wood, from Millett (1960).
Literature Cited
Dortch, J. M., L. A. Owen, M. W. Caffee, and P. Brease. 2010. Late Quaternary glaciation and equilibrium line altitude variations of the McKinley River region, central Alaska Range. Boreas 39(2):233–246.
Harrison, A. E. 1964. Ice Surges on the Muldrow Glacier, Alaska. Journal of Glaciology 5(39):365–368
Harrison, A. E. 1969. Glacial activity preceding the 1956 Muldrow Glacier surge in Alaska. Canadian Journal of Earth Sciences 6(4):1001–1007.
Jiskoot, H., P. Boyle, and T. Murray. 1998. The incidence of glacier surging in Svalbard: Evidence from multivariate statistics. Computers & Geosciences 24(4):387–399.
Millett, M. T. 1960. Advance of the Muldrow Glacier 1957. Geological Society of America, Cordilleran Section, Vancouver, British Columbia, Canada.
Post, A. S. 1960. The Exceptional Advances of the Muldrow, Black Rapids, and Susitna Glaciers. Journal of Geophysical Research 65(11):3703–3712

Harrison (1964) hypothesized that the previous surge of Muldrow occurred between 1906 and 1912, based on observations by climbers and explorers in those years. Harrison (1964) adds that debris paPerns on Muldrow Glacier suggest that Muldrow had surged at least three times in the 200 years prior to the 1956-‐57 surge, further suggesting that Muldrow Glacier had maintained a roughly 50 year surge cycle for over two centuries.
However, it is unclear whether Muldrow Glacier will surge again under current climate conditions. It is possible that changes in climate have interrupted Muldrow’s surge cycle similar to other Alaska glaciers (e.g., Heinrichs et al., 1996).
To investigate the likelihood that Muldrow will surge again, we utilize both DEMs and airborne laser altimetry to trace the elevation changes of Muldrow Glacier from 1952, four years before the surge, to 2010.
Methods
We use three DEMs:
(1) the National Elevation Dataset (NED) 2-arcsecond DEM, based on surveys in 1952;
(2) the Washburn DEM, based on aerial photogrammetry and ground-‐based surveys supervised by B. Washburn in 1976; and
(3) the Aero-Metric DEM based on a LiDAR survey completed by Aero-‐Metric, Inc. in 2006.
We calibrated all three DEMs with off-ice locations north of the Muldrow terminus.
We use two centerline elevation profiles from 2008 and 2010 acquired using airborne laser altimetry acquired as part of the UAF laser altimetry project

1952 to 2006
If the Muldrow Glacier was retaining its historical surge period of ~50 years, we would expect similar elevations in 2006, 49 years post-‐surge, to those just prior to the surge in 1952 with a near-‐zero mass balance. Instead, the surface of Muldrow is ~30 to 40 m below its surface in 1952 and the mass balance and mass change are both negative (-0.52 +0.22/-0.24 m/yr w.e. and -0.06 + 0.02/-0.03 Gt/yr).
1952 to 1976
This period is dominated by the 1956-‐57 surge that caused significant drawdown above the hinge line (~1250 m) and buildup below. The elevation changes of the surge are muted by the unavoidable inclusion of the first 19 years of post-‐surge recovery. The mass balance of the measured region is slightly negative (-‐0.2 +0.2/-‐0.6 m/yr w.e.) and the mass change is negligible.
1976 to 2006
Recovery from the surge continued to dominate during this portion of the quiescent period. There was slight build-up of ice above the hinge line, but significant wastage below the hinge line. The mass balance and mass change of the measured region are both negaEve (-‐0.74 +0.44/-‐0.42 m/yr w.e. and -‐0.08 +/-‐0.05 Gt/yr). The included portions of the upper Muldrow and Traleika did show positive elevation change.
2008 to 2010
The overall mass balance and mass change of Muldrow Glacier are negative over this two year period, which may suggest Muldrow will be unable to achieve the ice mass and driving stress necessary to trigger another surge. However, both the Traleika Glacier and upper Muldrow (>1700 m) show positive mass balance.
Conclusions
If Muldrow Glacier had maintained its historical surge period, it should have surged in the mid 2000s. The lack of a surge suggests that the mass balance of Muldrow Glacier and its tributaries has decreased since the last surge cycle.
However, since past Muldrow surges have originated on the Traleika, some form of a surge—either the entire Muldrow or some portion of it— may still occur. Driving stress calculations (not shown here) suggest that the Traleika needs to add approximately 25 m of ice to match 1952 driving stress.
Hence, the Traleika and some portion of the Muldrow may surge again if the Traleika maintains a positive mass balance.

Courtesy Mark Fahnestock
2021 Updates of the Muldrow Surge
April 26, 2021 Update
Animation of the toe advancing from 4/7 to 4/25 using ESA Sentinel-2 imagery. Provided by Mark Fanestock, Remote Sensing Specialist, UAF-Geophysical Institute.
Mark Fahnestock
May 3, 2021 Update
A clear Sentinel 2 image on May 2nd gives a 10-day velocity map that fits the same story as a week ago—mid-glacier speeds are the same, with the front advancing and flowing at 24 m/d in the center and fast flow of 17 m/d for the first 4 km up the Traleika and appearing to move higher.

NPS Photo / Chad Hults
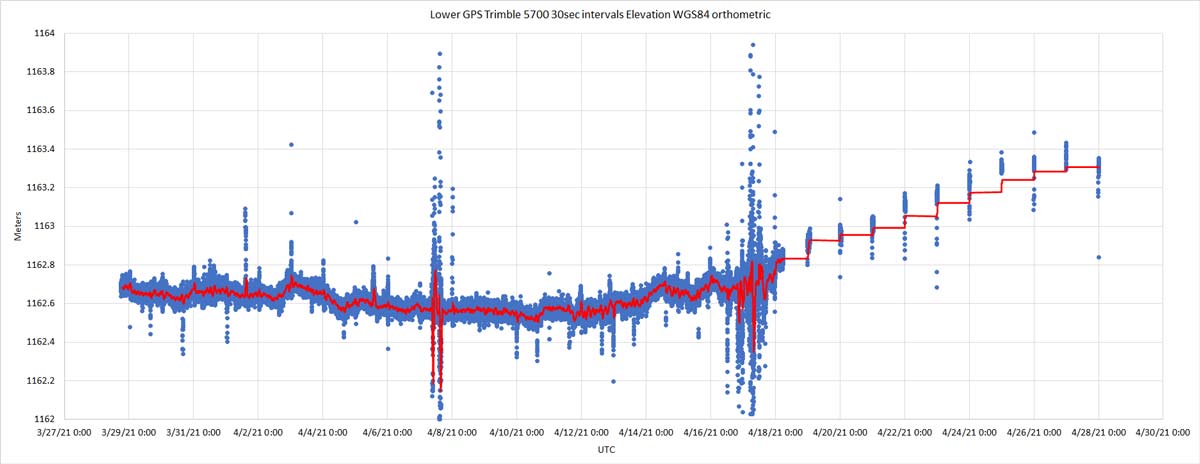
May 4, 2021 Update
View a chart showing the GPS derived elevation for the lower GPS from 3/28 to 4/28. Collection interval was set at 30 seconds. The red trend line is smoothed to average every 1 hour of data. The scale is in meters.The GPS elevation dropped slowly about 0.2 meters from 3/28 to 4/10. Then it rose about 0.7 meters to 4/28. There were a couple noisy days on 4/7 and 4/15 that might have been caused by solar flares, which commonly disrupt GPS signals.
The rise in the elevation is reflected in the SfM vertical differencing that shows that the toe area rising in elevation. This GPS almost fell into a crevasse, which formed under the tripod over the month. We moved it to a more stable location.

Chad Hults, NPS
May 7, 2021 Update
Vertical change of the Muldrow Glacier measured using structure from motion (SFM) aerial imagery flown by the NPS.The vertical change shows that the glacier surface has dropped in the upper reaches (down 50 meters at Gunsight Pass) and is building up near the toe (grown up to 120 meters).
This shows at the surge is moving ice from the upper glacier areas to the toe where it is both advancing forward and growing in volume.
May 11, 2021 Update
-

Muldrow Surge Timelapse (May 1 to May 8, 2021)
The advance of the toe of the surging Muldrow Glacier from May 1 to May 8. Watch for movement below the tallest peak in the center of the frame. Moving at 25 meters (65') per day, the glacier moved 175 meters (575') during this week-long period. The white broken ice of the active glacier ice is easy to see, but look carefully at "dead ice" (lower part of the frame) as it get pushed forward by the advancing toe. This dead ice has been slowly melting and stable since 1957's surge.
- Duration:
- 24.792 seconds
June 3, 2021
-
Surging Muldrow Glacier Time Lapse (May 8 to 25, 2021)
Time lapse video of the toe of the Muldrow Glacier advancing from May 8 to May 25. The toe advanced approximately 340 meters (370 yards) during these 17 days. The ground in the foreground rises up as this dead-ice moraine is pushed by the glacier from behind. Thrust faults and fractures form in the foreground as it is activated. Near the end of the video, The area of the toe far from the camera starts piling up as it runs into some of the dead-ice moraine from the 1957 surge.
- Duration:
- 30.08 seconds

June 10, 2021
On Saturday, June 6, the McKinley River rose 1 meter in just 3 hours. This was a small glacier outburst because there was an outflow of water observed in the Nupoint camera image in the foreground area that started on Saturday that has subsided in-line with the river gage measurement.
Check out the live river gage data.

Courtesy Mark Fahnestock
July 1, 2021
The speed of the lower reach of the glacier has slowed by about half in the last week or two.The speed can be determined using an image from 7/1 and one 5 days earlier (6/26). This provides a 5 day average of speed, so the actual present speed could be lower (e.g., if it was moving fast for the first 2.5 days and stopped for the last 2.5 days, it would give the same result as just moving at half the speed for the five day period). The middle glacier is a bit slower than it was, but the Traleika trunk is still racing along at 20 meters per day.
A field visit by NPS staff revealed that a tripod-mounted GPS monitoring the upper portion of the glacier had nearly fallen into a crevasse, so it was rescued from its precarious position. Some of the equipment near the toe of the glacier had been disturbed by wildlife.
July 26, 2021—Surge End?
- Based on the images from the Nupoint camera from the last three days, not including today's image, the toe of the glacier is barely advancing anymore. If you compare the last few images to the amount the glacier was advancing each day a week prior, you can easily tell that the glacier has dramatically slowed down. You can also see the McKinley River rise rapidly starting on July 18 and continued to rise for a few days.
- Looking at the inReach track at the lower GPS, it appears to have stalled. It hasn't moved further than its margin of error (+/- 30 feet) since July 22.
- July 22 corresponds to when the McKinley River gage stopped working right after the temperature plunged to 1.4 C, which is likely the temperature of the river water, so the gage was likely overtopped.
Conclusion: The glacier toe stopped surging on or soon after July 22. The upper glacier may still be surging, but we don't have any sources of information right now that can help us figure that out. Only the satellite imagery velocity modeling or collecting the upper GPS data will let us know if the upper glacier has also ceased surging. The weather has been very poor lately, so we likely won't have satellite imagery pairs for velocity modeling for a couple weeks. We last flew structure from motion (SfM) on July 16th, and we'll try for another flight in the next couple weeks.
-
Muldrow Surge Timelapse (July 2 to August 23, 2021)
This time lapse covers July 2 to August 23, 2021. Watch for the slowdown on July 22 (at 00:34 seconds).
- Duration:
- 1 minute

David Polashenski, University of Alaska, Fairbanks
October 1, 2021
In May 2021, a team of researchers from the University of Alaska Fairbanks spent approximately two weeks observing the surging Muldrow Glacier near Anderson Pass in Denali National Park.
In coordination with the National Park Service, the team deployed an array of six seismometers around the glacier and operated a ground-based radar interferometer. The seismic stations continue to operate over the summer and will hopefully provide insights to subglacial processes by recording small-scale 'icequakes' caused by the surging glacier.
The team collected radar scans of the glacier surface every two minutes for most of their time in the field. From their campsite at Anderson pass, the radar could view up glacier towards Mt. Brooks and down glacier towards the terminus.
All of these two-minute interval radar scans can be used create a data product known as an interferogram. This interferogram shows a map or birds-eye view of the study area created by comparing two radar images taken two minutes apart. The radar location was at the origin of the semi-circle near the middle, left side of the image. The radar works by emitting an electromagnetic signal which travels to the the surface of the glacier before being reflected back to the instrument. The process of 'interfering' two radar images produces the colorful, repeating fringe pattern seen throughout the bend of the Muldrow.
This fringe pattern shows that from one scan to the next two minutes later, ice from up valley moved closer to the instrument and ice down valley moved away from the instrument. The full, two week data set of hundreds of interferograms like this one will allow the research team to precisely estimate the surface velocity of the Muldrow Glacier surge.

UAF
March 18, 2022
The work continues to process the data that was collected during the surge last year. Creating these new time-lapse videos required editing and adjusting the lighting of thousands of photos.-
Muldrow Surge Time-lapse (July 1 to 25, 2021)
Time-lapse video of the toe of the surging Muldrow Glacier from July 1–25, 2021. Watch for a "lurch" toward the end of the video—just before the camera view shifts slightly, the speed of the glacier nearly doubles, then dramatically slows on July 22 as the surge ends.
- Duration:
- 15 seconds
-
Muldrow Surge Time-lapse (May 25 to July 30, 2021)
Time-lapse video of the surging Muldrow Glacier from May 25 to July 30, 2021. Watch for the dramatic slowdown of the glacier in the last several seconds.
- Duration:
- 1 minute
June 26, 2022
Check out the latest time-lapse video that has been processed from photographs collected last summer. In the first part of the video, the land in front of the advancing toe appears to be rising up. This is caused by deep-seated reactivation of debris-covered, stagnant ice left on the valley floor from the retreat of the glacier since the last surge in 1956–57. As the glacier pushes the stagnant ice, the active toe advances rapidly downstream.-
Muldrow Surge Time-lapse (May 8 to July 1, 2021)
This time-lapse video shows the advance of the toe of the Muldrow Glacier during the 2021 surge from May 8 to July 1. During the 54 days in this time-lapse the active toe front advanced more than 1 kilometer (0.6 miles). Digital elevation models developed from air-photo flights indicated that the toe of the glacier rose about 200 m (650 feet) over the summer of 2021. The growth of the toe and rising height of the glacier are visible throughout the video.
- Duration:
- 30 seconds