NPS Photo / Kent Miller
The physical environment strongly affects vegetation patterns in Alaska, and songbird communities are tied to vegetation patterns. In designing a long-term monitoring program for Denali, we saw an opportunity to collect integrated data to better understand how the ecosystem functions as a whole and to delineate the specific relationships among these elements of the biota.
We developed a sampling design where repeated observations of the physical environment, vegetation and birds are made at randomly selected points (Roland et al. 2003). This design will allow detection of changes in the ecosystem at a landscape scale, for long periods of time. The sampling design is comprised of five rows of five plots, all 547 yards (500 m) apart, arranged in a grid pattern at each study area. These “mini-grids” are themselves arranged on a macro-grid with 6.2 miles (10 km) spacing. By utilizing a randomized site selection procedure, the program provided unbiased data about the status and trend of park resources over large spatial scales.
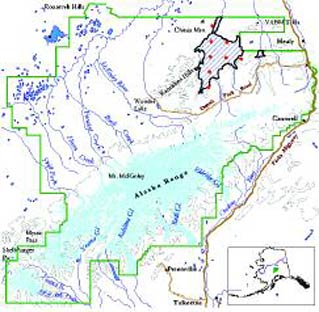
One focus of data collection was the Toklat Basin in the northeastern region of Denali (Figure 1). We collected data on the physical environment, vegetation, and passerine birds on nearly 200 plots in eight mini-grids in this region from 2001 to 2003. This data set has allowed us to establish a baseline of ecological conditions for this area and to quantify some of the primary ecological dynamics in this ecosystem. In this article, we highlight our research by presenting one example of the benefits of integrated data collection of physical attributes, vegetation, and birds for understanding ecological dynamics.
An Example of Integrating Monitoring at a Landscape Scale
A main attribute of the Toklat Basin region is permanently frozen ground (or permafrost), which affects many aspects of the ecosystem. The basin slopes to the north and lies in the shadow of the Alaska Range. Thus, solar energy inputs in this area are low compared to areas with southerly aspects, or those not in the shadow of the Alaska Range. In addition, strong winter winds often blow away the insulating blanket of snow, allowing the subarctic winter cold to penetrate and freeze soils deeply.
During fieldwork, it was noted that active layer depth and elevation were strong predictors of the vegetation patterns in the Toklat Basin. Many predictions concerning the nature of landscape change focus on vegetation changes along elevation gradients and on interrelationships between warming, permafrost degradation, and resulting vegetation change. The integrated monitoring program allows us to quantify and monitor these dynamics through time, providing insight into the relationships among permafrost, vegetation structure, and bird distribution.
Physical Environment
One measure of the intensity of permafrost in an area is the summer active layer depth, the depth to which the soil thaws in the summer. The deeper the thawed or active layer, the greater the amount of substrate available for plant roots to colonize, to draw nutrients from, and to support life functions. Sites with deeper active layers often have warmer soils that are more favorable to plant growth and the microbial activity that frees nutrients for plants to use.
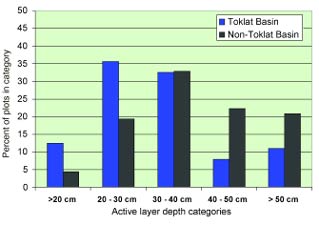
To illustrate the importance of permafrost in the Toklat Basin relative to other areas of Denali, we compared the data from plots in this region to all of the low elevation plots (<1100 m in elevation) that we measured in Denali. We observed some differences in soil temperature and active layer depth values between these two data sets. Mean soil temperature for the Toklat Basin plots was 38.1°F ±1.6°F (3.4°C±0.9°C), whereas for all other low-eleva-tion plots the mean soil temperature was 46.2°F ±3.8°F (7.9°C ±2.1°C). Mean active layer depth in the Toklat Basin plots was 13 inches ±2.2 (33 cm ±5.7), whereas in low elevation plots outside of this study area, mean active layer depth was 16.5 inches±3.8 (42 cm ±9.7). The soil temperature and active layer depth values are lower in the Toklat Basin, as compared to other low elevation sample locations (Figure 2).
Tree Density and Live Plant Cover
Many important vegetation attributes in the Toklat Basin varied in response to the active layer depth and elevation. These two physical factors influence the microclimate of a site, and thus the conditions for plant growth. Here we focus on the responses of two vegetation parameters that are relevant to bird habitat selection: the quantity of vegetative cover at specific heights off the ground (percent cover of live vegetation), and tree density.
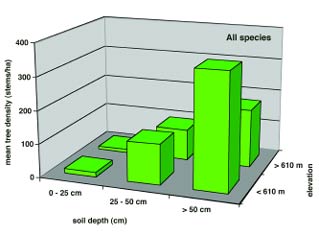
The data showed that percent of plant cover higher than 6.6 feet (2 m) and density of trees varied in response to the active layer depth and elevation. Specifically, tree density was very low in plots that were most highly permafrosted in both elevation categories (Figure 3) and was highest in low elevation sites with deeply thawed soils. Intermediate positions along this gradient had intermediate values for tree density, as did sites at high elevation. Plant cover greater than 6.6 feet (2 m) showed essentially the same response to this set of gradients, with highest biomass in deeply thawed soils at low elevation and lowest biomass in sites with thin active layers (Figure 4).
Overall, at this large spatial scale, the data reflected predicted variation in response to important environmental variables. At sites with shallow active layers, the vegetation was generally low with little plant cover over 6.6 feet (2 m) in height and very few, scattered trees. With increasing active layer depth, plant cover increased in higher height strata, and generally, the vegetation was more productive with a greater density of trees.
Songbirds
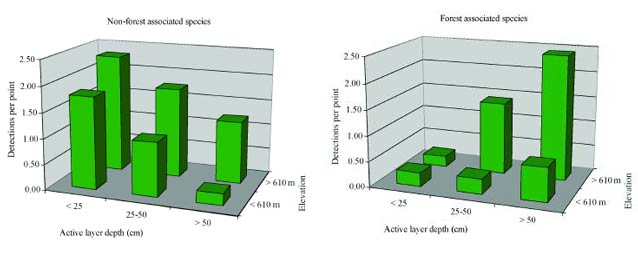
For species associated with open, non-forested landscapes (e.g., horned lark, American tree sparrow, white-crowned sparrow) more individuals were detected in plots where there was permafrost closer to the surface and consequently less vegetative cover. The mean number of detections of these species was substantially higher at plots where the active layer was less than 9.8 inches (<25 cm) (Figure 5). Correspondingly, for species strongly associated with forests (boreal chickadee, ruby-crowned kinglet, American robin, and yellow-rumped warbler), more individuals were detected where the active layer was deep, and there was more vegetative biomass. The mean number of detections of these species was substantially higher at plots where the active layer was greater than 9.8 inches (25 cm) (Figure 5).
NPS Photo / Kent Miller
Discussion
Two goals of the integrated monitoring program are to quantify the relationships between environment, vegetation, and song-bird distributions across Denali’s landscape and to detect changes in these distributions in response to ecological changes over time. Many complex factors influence the distribution of both vegetation and songbirds; however, our analysis suggests that we can partially explain the distribution of boreal vegetation and songbird populations using active layer depth and elevation. Current scientific literature suggests that vegetation change along these two environmental gradients may be very pronounced in Alaska in the coming decades (Camill 2005, Calef et al. 2005). Our data show that any changes in the active layer depth resulting from thawing permafrost could lead to major changes in vegetation patterns, which in turn could profoundly alter bird habitats over large regions of the park.
This program was specifically designed to monitor the interrelationships between physical attributes of the ecosystem, vegetation patterns, and bird distribution at large spatial scales. We colocated our sampling activities to maximize the information gained about a diverse cross-section of the park biota and to help understand the complex interactions among species and their environments. By collecting baseline data using a rigorous sampling design, we are establishing a foundation for effective long-term monitoring of resources that will allow us to better understand and manage park resources in a changing world.
References
Camill, Peter. 2005.
Permafrost Thaw Accelerates in Boreal Peatlands During Late-20th Century Climate Warming. Climatic Change 68(1-2):135-152.
Calef, Monica, A. David McGuire, Howard Epstein, T. Scott Rupp, and Herman H. Shugart. 2005.
Analysis of vegetation distribution in Interior Alaska and sensitivity to climate change using a logistic regression approach. Journal of Biogeography 32: 863-878
Part of a series of articles titled Alaska Park Science - Volume 5 Issue 1: Scientific Studies in Denali.
Previous: Long-Term Golden Eagle Studies
Last updated: February 6, 2015
