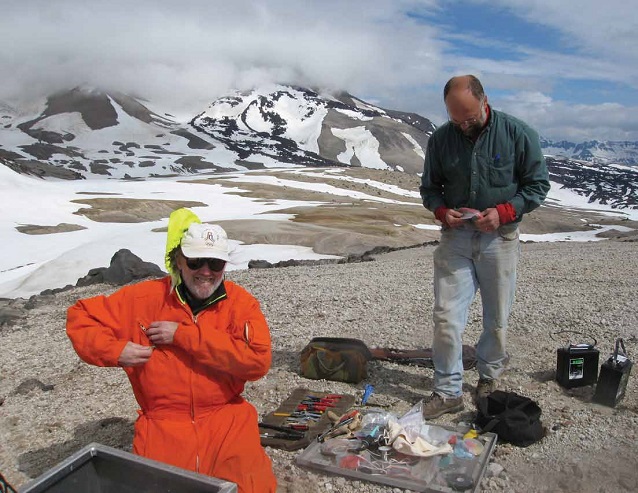
USGS AVO photograph by Stephanie Prejean
Introduction
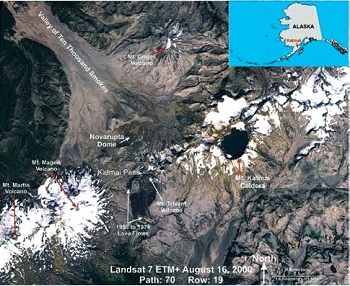
The 1912 eruption of Novarupta was the largest of the 1900s (Fierstein and Hildreth 2001, Hildreth et al. 2003). A century later, fundamental questions remain regarding the source of the magma for that eruption. A previous seismic study of the Katmai area (Jolly et al. 2007) identified a single large area of anomalous structure in the subsurface centered beneath Katmai Pass (Figure 2), but the magma source for the 1912 eruption is thought to have been be-neath Mt. Katmai (Hildreth et al. 2003). This mystery was a prime motivation for the research project described here.
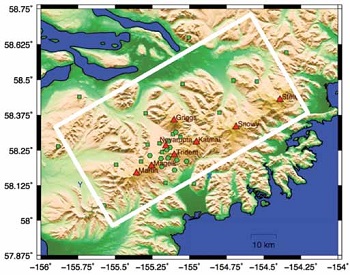
In summer 2008, scientists and staff from the Alaska Volcano Observatory (AVO) and the University of Wisconsin-Madison installed 11 temporary seismic recording instruments around the Katmai Pass area, complementing the existing AVO seismic network stations (Figure 3). The primary goal of the deployment was to record data from local earthquakes in order to yield an improved model of the three-dimensional structure of the upper crust beneath and surrounding Katmai Pass, using an analysis method known as double-difference seismic tomography (Zhang and Thurber 2003). The method yields a three-dimensional image of the velocity of seismic waves in the subsurface, and also produces improved estimates of the locations of the earthquakes beneath the seismic stations.
Our main finding is that there is not a single large anomalous zone centered beneath Katmai Pass; rather there are several separate anomalous zones, one each beneath Katmai, Trident-Novarupta, and Martin-Mageik. Furthermore, the earthquakes are tightly clustered beneath the various volcanic centers, and are found to be systematically deeper than previously thought. Linear trends of earthquakes are also revealed, similar to features observed at other volcanoes, possibly outlining previously unidentified fault structures or indicating the path of migrating magma or magmatic fluids and gases.
Seismic Waves and Seismic Tomography
There are two main categories of seismic waves: body waves that travel through the Earth’s solid interior, and surface waves that have their energy trapped near the Earth’s surface. Body waves come in two types, P (for primary, arriving first) and S (for secondary, arriving after P). P waves are compressional waves analogous to sound waves in the air, propagating pressure disturbances. S waves are shear or transverse waves that can only travel through a solid. Rayleigh waves, the most important surface waves, are caused by an interaction between P and S waves, although they are most sensitive to the S-wave velocity structure. The velocity of Rayleigh waves also varies with the frequency (or wavelength) of the wave. These different waves provide complementary information about the Earth’s interior. The S-wave velocity is particularly sensitive to temperature as well as the presence of fluids, gases, and cracks. Higher tem-peratures and a greater proportion of fluids, gases, and/or cracks all cause a reduction in seismic wave velocity.
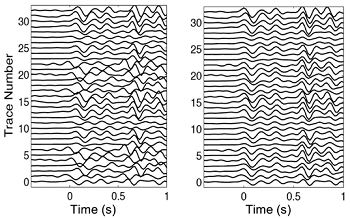
Seismologists construct images of the Earth’s interior using a method analogous to medical CAT (Computed Axial Tomography) scans. For body-wave tomography, the seismic waves generated by earthquakes play the role of the CAT scan X-rays, with the observed arrival times for waves traveling from the earthquakes to the seismic stations being used to infer the velocity of the seismic waves in three dimensions. The locations (including origin times) of the earthquakes are estimated at the same time. A basic review of seismic tomography can be found in Thurber and Aki (1987). The body-wave tomography method we use is known as “double-difference” tomog-raphy (Zhang and Thurber 2003), which takes advantage of a technique called waveform cross-correlation, a computerized method to “line up” seismograms, yielding more accurate seismic wave arrival times (Figure 4).
An entirely independent technique for obtaining an image of the S-wave velocity structure is called ambient noise tomography. The Earth is constantly vibrating, nor-mally imperceptibly, and these vibrations are known as ambient noise. This noise is caused mainly by ocean waves and wind, but also by vehicles and machinery. Snieder and Wapenaar (2010) present an excellent overview of this and other correlation-based seismic imaging techniques.
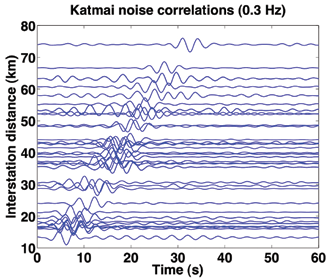
This method proceeds in three main steps. The first step is the cross-correlation of continuous records of up to months of seismic noise for each pair of seismic stations in an area. It has been shown both theoretically and empirically that the cross-correlation of the ambient noise produces a “seismogram” that represents surface waves traveling from one station to the other. This happens because the noise is predominantly made up of surface waves traveling in random directions, and the cross-correlation analysis brings out those waves that happen to pass by both stations. An example is shown in Figure 5, where the ambient noise “seismograms” (known technically as Green’s functions) for the Katmai area are lined up according to the distance between the two stations. The second step is the estimation of the velocity of the surface wave, which as noted above is a function of the frequency of the wave (a phenomenon known as dispersion), for all pairs of stations. The dispersion behavior is most sensitive to the S-wave velocity structure. For the third and final step, the dispersion results for all station pairs are used to construct the image of the S-wave velocity structure in three dimensions.
Images of the Seismic Velocity Structure
Figures 6 and 7 display slices through the three-dimensional models of the body-wave P and ambient noise S velocity models, respectively. Warm colors represent areas of the models with relatively low seismic wave velocity, and conversely cold colors represent areas with relatively high seismic wave velocity. We note that seismic wave velocity normally increases with depth (mainly due to the effects of increasing pressure), so areas that are anomalous can be identi-fied by deviations from this general pattern.
There are several key features that we interpret in the P-wave (body-wave) model (Figure 6). One is the very low velocity at 2 km depth in the Katmai Pass area, between Mageik and Novarupta/Trident. Jolly et al. (2007) found very low seismic velocity at shallow depths in this area as well. At greater depths, we identify separate zones of relatively low P-wave velocity that are visible in the 4 km depth slice beneath Mt. Mageik and in the 4 and 6 km depth slices beneath Trident. The latter extends northeastward toward Katmai. This result is in contrast to that of Jolly et al., who found a single, large anomalous zone of low P-wave velocity centered beneath Katmai Pass. The difference is likely due to increased seismic station coverage in our study, which provides us with a sharper focus in imaging the subsurface. We can image multiple low-velocity bodies that were blurred together in the results of Jolly et al.
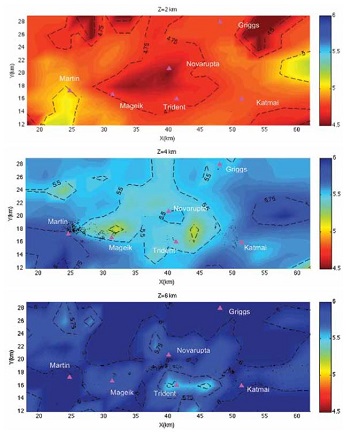
The “noise tomography” results for S-wave velocity in Figure 6, which are based on the analysis of data only from AVO network stations, are generally consistent with the body-wave image. Near the surface (0 to 2 km depth), a region of very low S-wave velocity is evident in the Katmai Pass area, similar to the P-wave model (Figure 6). There is also a low velocity anomaly at 4 km depth roughly beneath Trident that extends toward Katmai, similar to the body-wave model. One feature in the ambient noise model that is not present in the body-wave model is the low velocity anomaly just northeast of Katmai at 2 km depth. This is an area lacking in seismic station coverage, so the body-wave model is not well imaged there. The separate low-velocity anomaly beneath Mageik present in the body-wave model at 4 km depth is not present in the noise tomography model. It may be that the body-wave data have enough resolving power in this area to distinguish two features, whereas they are blurred together in the noise tomography model.
The model at the right is represented mathematically as smoothly varying between points spaced 2 km apart where the seismic velocity value is defined.

Earthquake Locations
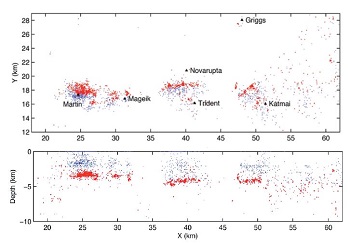
As part of the body-wave imaging process, the locations of the earthquakes are refined. With the improved accuracy from the cross-correlation analysis (Figure 4), the earthquake locations are more accurate, “sharpening” our view of the seismicity distribution. In Figure 7, we compare the routine AVO catalog locations to our refined locations. There is a systematic deepening of the earthquakes throughout the region, as well as a slight shift to the north. These changes result from including the data from the temporary stations and from the effect of the three-dimensional velocity model. The clusters of earthquakes near the various volcanoes also are much more compact, although some of the smaller earthquakes still have scattered locations.
One aspect that is particularly noteworthy is the relatively sharp cutoff in the earthquake depths, at roughly 4 km beneath Martin and Mageik and 5 km beneath Trident, Novarupta, and Katmai. There are two plausible explanations for this. The temperature of the rocks may increase rapidly at these depths, so that the rocks flow in a ductile manner under stress rather than failing in a brittle manner (i.e., as earthquakes). Alterna-tively, these earthquakes may be sitting on top of magma storage zones, which would be weak areas that would concentrate stresses just above them. The presence of the low velocity zones in the tomographic images supports the second explanation, but other evidence is necessary in order to distinguish definitively between these two possibilities, or possibly reveal a third explanation.
The model above is represented mathematically as cubes 2 km in size of constant seismic velocity. The structure deeper than 4 km is not adequately resolved by the ambient noise data, so is not shown.
Conclusions and Future Work
Our seismic imaging research has provided important insight into the magmatic plumbing system of the Katmai volcanoes. The body-wave and surface-wave models display similar features that, along with the spatial distribution of earthquakes, suggest the presence of multiple areas of magma storage below 4 to 5 km depth. Further research will be able to refine the results shown here. Noise tomography can be applied to a combined set of data from the AVO network and the temporary stations (Figure 3) to enhance the surface-wave imaging capability. Body-wave tomography using S waves can be added to the P-wave modeling to provide another estimate of the S-wave structure. Ultimately, the body-wave and surface-wave models can be determined together in a joint inversion that will combine the imaging power of both data types to yield a clearer picture of the magmatic system beneath Katmai.
Acknowledgements
The research presented here was supported by National Science Foundation grant EAR-0910674 and by the USGS Volcano Hazards Program. We also thank the National Park Service for permission to deploy seismic instruments in Katmai National Park and Preserve.
References
Fierstein, J., and W. Hildreth. 2001. Preliminary volcano-hazard assessment for the Katmai volcanic cluster, Alaska. U.S. Geological Survey Open-File Report OF 00-0489.
Hildreth, W., M.A. Lanphere, and J. Fierstein. 2003. Geochronology and eruptive history of the Katmai volcanic cluster, Alaska Peninsula. Earth and Planetary Science Letters 214: 93-114.
Jolly, A.D., S.C. Moran, S.R. McNutt, and D.B. Stone. 2007. Three-dimensional P-wave velocity structure derived from local earthquakes at the Katmai group of volcanoes, Alaska. Journal of Volcanology and Geothermal Research 159: 326-342.
Snieder, R., and K. Wapenaar. 2010. Imaging with ambient noise. Physics Today 63: 44-49.
Thurber, C.H., and K. Aki, 1987. Three-dimensional seismic imaging. Annual Review of Earth and Planetary Sciences 15: 115-139.
Zhang, H., and C.H. Thurber. 2003. Double-difference tomography: the method and its application to the Hayward fault, California. Bulletin of the Seismological Society of America 93: 1875-1889.
Part of a series of articles titled Alaska Park Science - Volume 11 Issue 1: Volcanoes of Katmai and the Alaska Peninsula.
Last updated: June 23, 2016
