The hydrographic statistics presented here are based on processing the high-resolution (1:24,000; 1:63,360 in Alaska, except for Bering Land Bridge National Preserve, Cape Krusenstern National Monument, Denali National Park, and Glacier Bay National Park, which have been updated to 1:24,000 scale) National Hydrography Dataset (NHD). Although officially complete since August 2007, the NHD is a dynamic representation of the surface water network. The U.S. Geological Survey (USGS) and state stewards constantly seek to improve the database. Consequently, statistics generated for a park based on NHD data downloaded in 2009 may be different than the same statistics generated on NHD data downloaded in 2011 due to corrections to the geometric network, topology, and attributes made during various USGS maintenance phases and state stewardship efforts. Additionally, hydrographic statistics may also change if higher-resolution/larger scale data are incorporated into NHD (e.g. from LIDAR-derived hydrography). Incorporating larger scale data into the NHD would typically increase the values of all hydrographic statistics.
Hydrographic statistics are also greatly influenced by the park boundary used when processing a park. This project strives to use the most up-to-date park boundaries supplied by the NPS Land Resources Division (LRD). An 'official' LRD endorsed digital GIS park boundary, however, is not available for all park units. As of September 2018, 375 parks were processed using LRD endorsed digital GIS boundaries. The remaining parks were processed using the best available digital GIS park boundary. When LRD releases new versions of the digital GIS park boundary dataset, updates to the hydrographic statistics will be made as warranted. Additionally, hydrographic statistics will need to be regenerated if Congress enacts boundary changes — either enlarging or shrinking existing parks or adding new parks.
303(d) Impairment Statistics
The basic unit for assessing 303(d) attainment status is the assessment unit (AU). Multiple data sources were used for georeferencing 303(d) AU's to the NHD. The format, quality, and date of these sources varied considerably. As alluded to in the HIS Methods, georeferencing AU's is extremely difficult. The EPA's 2002 Integrated Water Quality Monitoring and Assessment Report Guidance discusses this problem:
Currently, state and territory AUs are defined using a wide range of criteria - from individual monitoring stations to Natural Resource Conservation Service watersheds. Sometimes these AUs are defined using geographic information systems (GIS) but more often are only described textually. As a consequence, it is extremely difficult to ensure adequate assessment of all waters. EPA strongly encourages states and territories to uniformly adopt the National Hydrography Dataset (NHD) reach addressing protocol for assigning AUs. Through a unique reach number and a position, reach addresses precisely locate water features, such as AUs.
Reasonable efforts were made to accurately georeference the NHD with the most current 303(d) listings, but it should be noted that impairment statistics offered here may be of a precision greater than that of the data sources. While the EPA Reach Address Database (RAD) 303(d) database served as the baseline for identifying water impairments within each park, state listings, reports, and GIS layers were also utilized to georeference impairments when available. Since the EPA RAD 303(d) database was produced using medium resolution (1:100,000 scale) NHD, larger scale state GIS layers, where available, were generally used for georeferencing impairments in HIS instead of the EPA RAD 303(d) database.
The HIS Database attempts to provide the most current 303(d) listings furnished by states and EPA for the most recent reporting cycle. As some states may be delayed in reporting, the impairments listed for them may lag two years (or more) behind the impairments listed for the other states. Also, there is often a delay between a state making their impairments publicly available and EPA approving them. Consequently, the impairments shown for a particular park may change for the current reporting cycle if the EPA subsequently requires modifications to the state's 303(d) list.
Not All Impaired Waterbodies are 303(d) Listed
State 303(d) lists do not necessarily include all impaired waterbodies. One reason for this is that not all waterbodies have been assessed. Although WRD often reports on the percent of park waterbody miles and acres that are impaired, this does not mean that ALL park waterways and waterbodies have been FULLY assessed. This issue, in the broader context of all the nation's waters, is discussed in the EPA's Guidance for 2004 Assessment, Listing and Reporting Requirements Pursuant to Section 303(d) and 305(b) of the Clean Water Act:
The majority of the nation's waters remain unmonitored and unassessed, even though the CWA requires that States update the description of the quality of all navigable waters in the State every two years. It is neither necessary nor practicable for States to physically conduct site specific monitoring of all waters in order to undertake some level of an assessment. EPA believes that States should employ a combination of monitoring tools to most efficiently address the full range of water quality management needs. These tools include probability-based monitoring surveys, landscape and water quality models, remote sensing, and targeted site specific monitoring.
Waterbodies with completed total maximum daily loads (TMDLs) are also not 303(d) listed. A TMDL is simply a plan for attaining water quality standards — it should not be interpreted as a clean bill of health. State 305(b) and Integrated Reports should detail impairment status for all waterbodies within each state. As discussed in the HIS Water Quality Standards page, waters placed in categories two to four may still be impaired, but not listed in a state's 303(d) list. Consequently, once a waterbody has been identified as impaired (i.e. in Category 5) by a state, WRD considers that waterbody impaired until the measured water quality improves sufficiently to attain all applicable water quality standards, regardless of whether the publication of a TMDL moves the waterbody into Category 4a and off the state’s 303(d) list. NPS impaired waters, as tabulated in HIS, include both Category 4 and 5 waterbodies.
Servicewide Hydrographic Statistics Do Not Equal the Sum of the Statistics from Individual Parks
Some waterbodies are shared by multiple parks. For instance, sections of the Potomac River are adjacent to both the Chesapeake & Ohio Canal National Historical Park and the George Washington Memorial Parkway. The Appalachian National Scenic Trail overlaps several other parks. Summing the hydrographic statistics from individual parks would inflate the servicewide statistics. Consequently, the servicewide statistics were generated with database queries designed to exclude any waterbodies that occur more than once due to overlapping park boundaries or shared adjacencies.
Number of Impairments
States define and track impairments in different ways that make it difficult to compare the number of impairments between parks. The cleanest definition of an impairment is one assessment unit failing to meet a specific water quality standard due to one or more pollutants. States, however, define assessment units differently. Assessment units may be a portion of a reach (or lake), an entire reach (or lake), or sometimes an entire subbasin. Consequently, an impaired assessment unit many not correspond to exactly one specific feature on the earth's surface because it is an entire subbasin or a state uses the assessment unit (waterbody ID) for more than one feature. Therefore, the number of impairments for each park is completely contingent upon how states define its assessment units. Consequently, the best impairment comparison between parks are the miles of waterway or acres of waterbodies impaired, which identifies all impaired water features and doesn't count multiple impairments of the same water feature as new/separate impairments.
NHD Peculiarities Affecting NPS Hydrographic Statistics
Certain peculiarities exist within NHD, which generally reflect inconsistencies and deficiencies with the source data used to create the NHD. The primary source data used to create the NHD were the USGS 7.5 minute (15 minute in Alaska) topographic maps. These maps were created over a period of several decades and by different cartographers, which is reflected in the NHD. Some of these peculiarities are described below. Many of these peculiarities will likely be removed from NHD in the future through editing or incorporation of more recent, consistent, and/or larger scale data.
Differences in Hydrographic Densities
Cartographic representations of river networks, as digitized into the seamless NHD, can appear to have abrupt changes in density. This is a reflection of the source topographic map created by different cartographers, rather than an actual change in the hydrography. Calculated river miles will skew slightly higher in the denser areas and vice versa.
Reservoir vs. Lake/Pond
Many waterbodies that are typically considered reservoirs are classified as lake/pond in NHD. A lake/pond is defined in NHD as a standing body of water with a predominately natural shoreline, whereas a reservoir has a constructed basin. In building the NHD, only those waterbodies with a clearly constructed basin were classified as reservoirs. Since lakes and reservoirs were not clearly distinguishable in the NHD, HIS has lumped lake and reservoir acres into a single waterbody category.
Stream/River vs. Lake/Pond
When a stream/river is impounded or has its flow controlled for navigation, it often is difficult to classify the feature based on the information shown on the topographic map. Does it behave like a stream/river or more like a lake/pond? Generally, if a feature was named on a map as a 'lake', it was coded as such in the NHD. Such discrepancies were typically dealt with on a park-by-park basis. For example, the portion of the Cumberland River adjacent to Fort Donelson National Battlefield is known as Lake Barkley. While NHD classified this impounded riverine waterbody as a lake, Fort Donelson park staff consider the waterbody an impounded stream/river. For hydrographic statistics, the waterbody was reclassified as a stream/river. Decisions to reclassify waterbodies were often based on the preference of each park.
2-D "Linear" (Areal) Features
Acres for stream/river and canal/ditch were calculated based on the polygonal features in NHDArea. Only stream/rivers and canal/ditches that were wide enough (typically 50ft) were portrayed in NHDArea with a left and right bank. Cartographic standards for 2-D (left and right bank) delineations are set forth by the USGS. While only wide stream/rivers and canal/ditches were included in the areal statistics, all stream/rivers and canal/ditches were captured in the linear statistics (length) using NHDFlowline.
Spring/Seeps Under-Represented in NHD
The number of springs depicted in NHD is less than what actually occurs. For instance, at 24K resolution, there appears to be zero springs in Pipe Spring National Monument.
Lock Chambers, Rapids, and Special Use Zones
Areal statistics for lock chambers, rapids, and special use zones were calculated based on polygonal features in NHDArea. The USGS may not have included these features on all topographic maps or may have represented them as points or lines rather than areas. Since the topographic maps were a primary source for NHD delineations, statistics for these features may not be completely accurate.
Foreshores Defined
Foreshore data is integrated from the National Ocean Service (NOS, part of the National Oceanic and Atmospheric Agency (NOAA)) into NHD. In order for foreshore features to be incorporated, the USGS set forth "Capture Conditions." As stated in the NHD User Guide, foreshores are included in NHD under these conditions:
"For a topographic/bathymetric edition only, if FORESHORE is on the final compilation provided to USGS by NOS, or If FORESHORE is ≥ 0.1" along the longest axis and ≥ 0.04" along the shortest axis, then capture."
Swamp/Marsh and Wetlands
The swamp/marsh delineations in the NHD are typically those that appear on the source USGS' 7.5-minute (15 minute in Alaska) topographic map quadrangles unless they were removed during processing. These swamps/marshes should not be construed as the only wetlands. The U.S. Wish and Wildlife Service National Wetlands Inventory is the best source for wetlands data across the country.
Ephemeral Streams Under-Represented in NHD
The identification of ephemeral streams in the NHDFlowline feature class is still in its infancy. While most ephemeral streams have been incorporated into the intermittent stream category, USGS and state stewards are slowly parsing out ephemeral streams from intermittent and placing them into their own classification. Consequently, intermittent stream statistics are most likely an overestimate. For example, NHD indicates that Grand Canyon National Park has over 3,700 miles of intermittent streams. This figure undoubtedly includes a significant proportion of ephemeral streams.
Perennial, Intermittent, and Ephemeral Attributes in Alaska
All Alaskan streams in the NHD are incorrectly attributed as perennial. No intermittent or ephemeral streams appear in NHD. It is unknown whether this attribution flaw is the result of the original NHD source topographic map quadrangles lacking the distinction between perennial and intermittent or whether the attribution occurred in subsequent processing of the source data into the NHD.
Tidally-Influenced Statistics
The official NHD does not include attributes to distinguish which waterway reaches or waterbodies are tidally influenced. This attribute was added prior to calculating hydrographic statistics for certain parks where it was either obvious that the park's water resources were tidally influenced or park staff could provide a good estimate of where tidal influence stopped. For most parks, however, that have both tidally influenced and non-tidal water resources, the tidal and non-tidal statistics were combined into a single non-tidal statistic due to an inability to acurately estimate tidal influence.
Lake Counts in NHD
In many cases, NHD may have several adjoining/adjacent polygons in the NHDWaterbody feature class that may represent only one lake/pond or reservoir. Therefore, simply counting the lake/pond and reservoir entries for each park may not accurately reflect the actual lake counts. To more accurately assess the number of lakes and reservoirs within each park, the NHDWaterbody feature class was overlaid with ESRI ArcGIS World Imagery basemap to help quantify existing lakes within each park. Some margin of error is expected as some of the images from the World Imagery basemap may be outdated.
Handling Inundation Areas in NHDArea
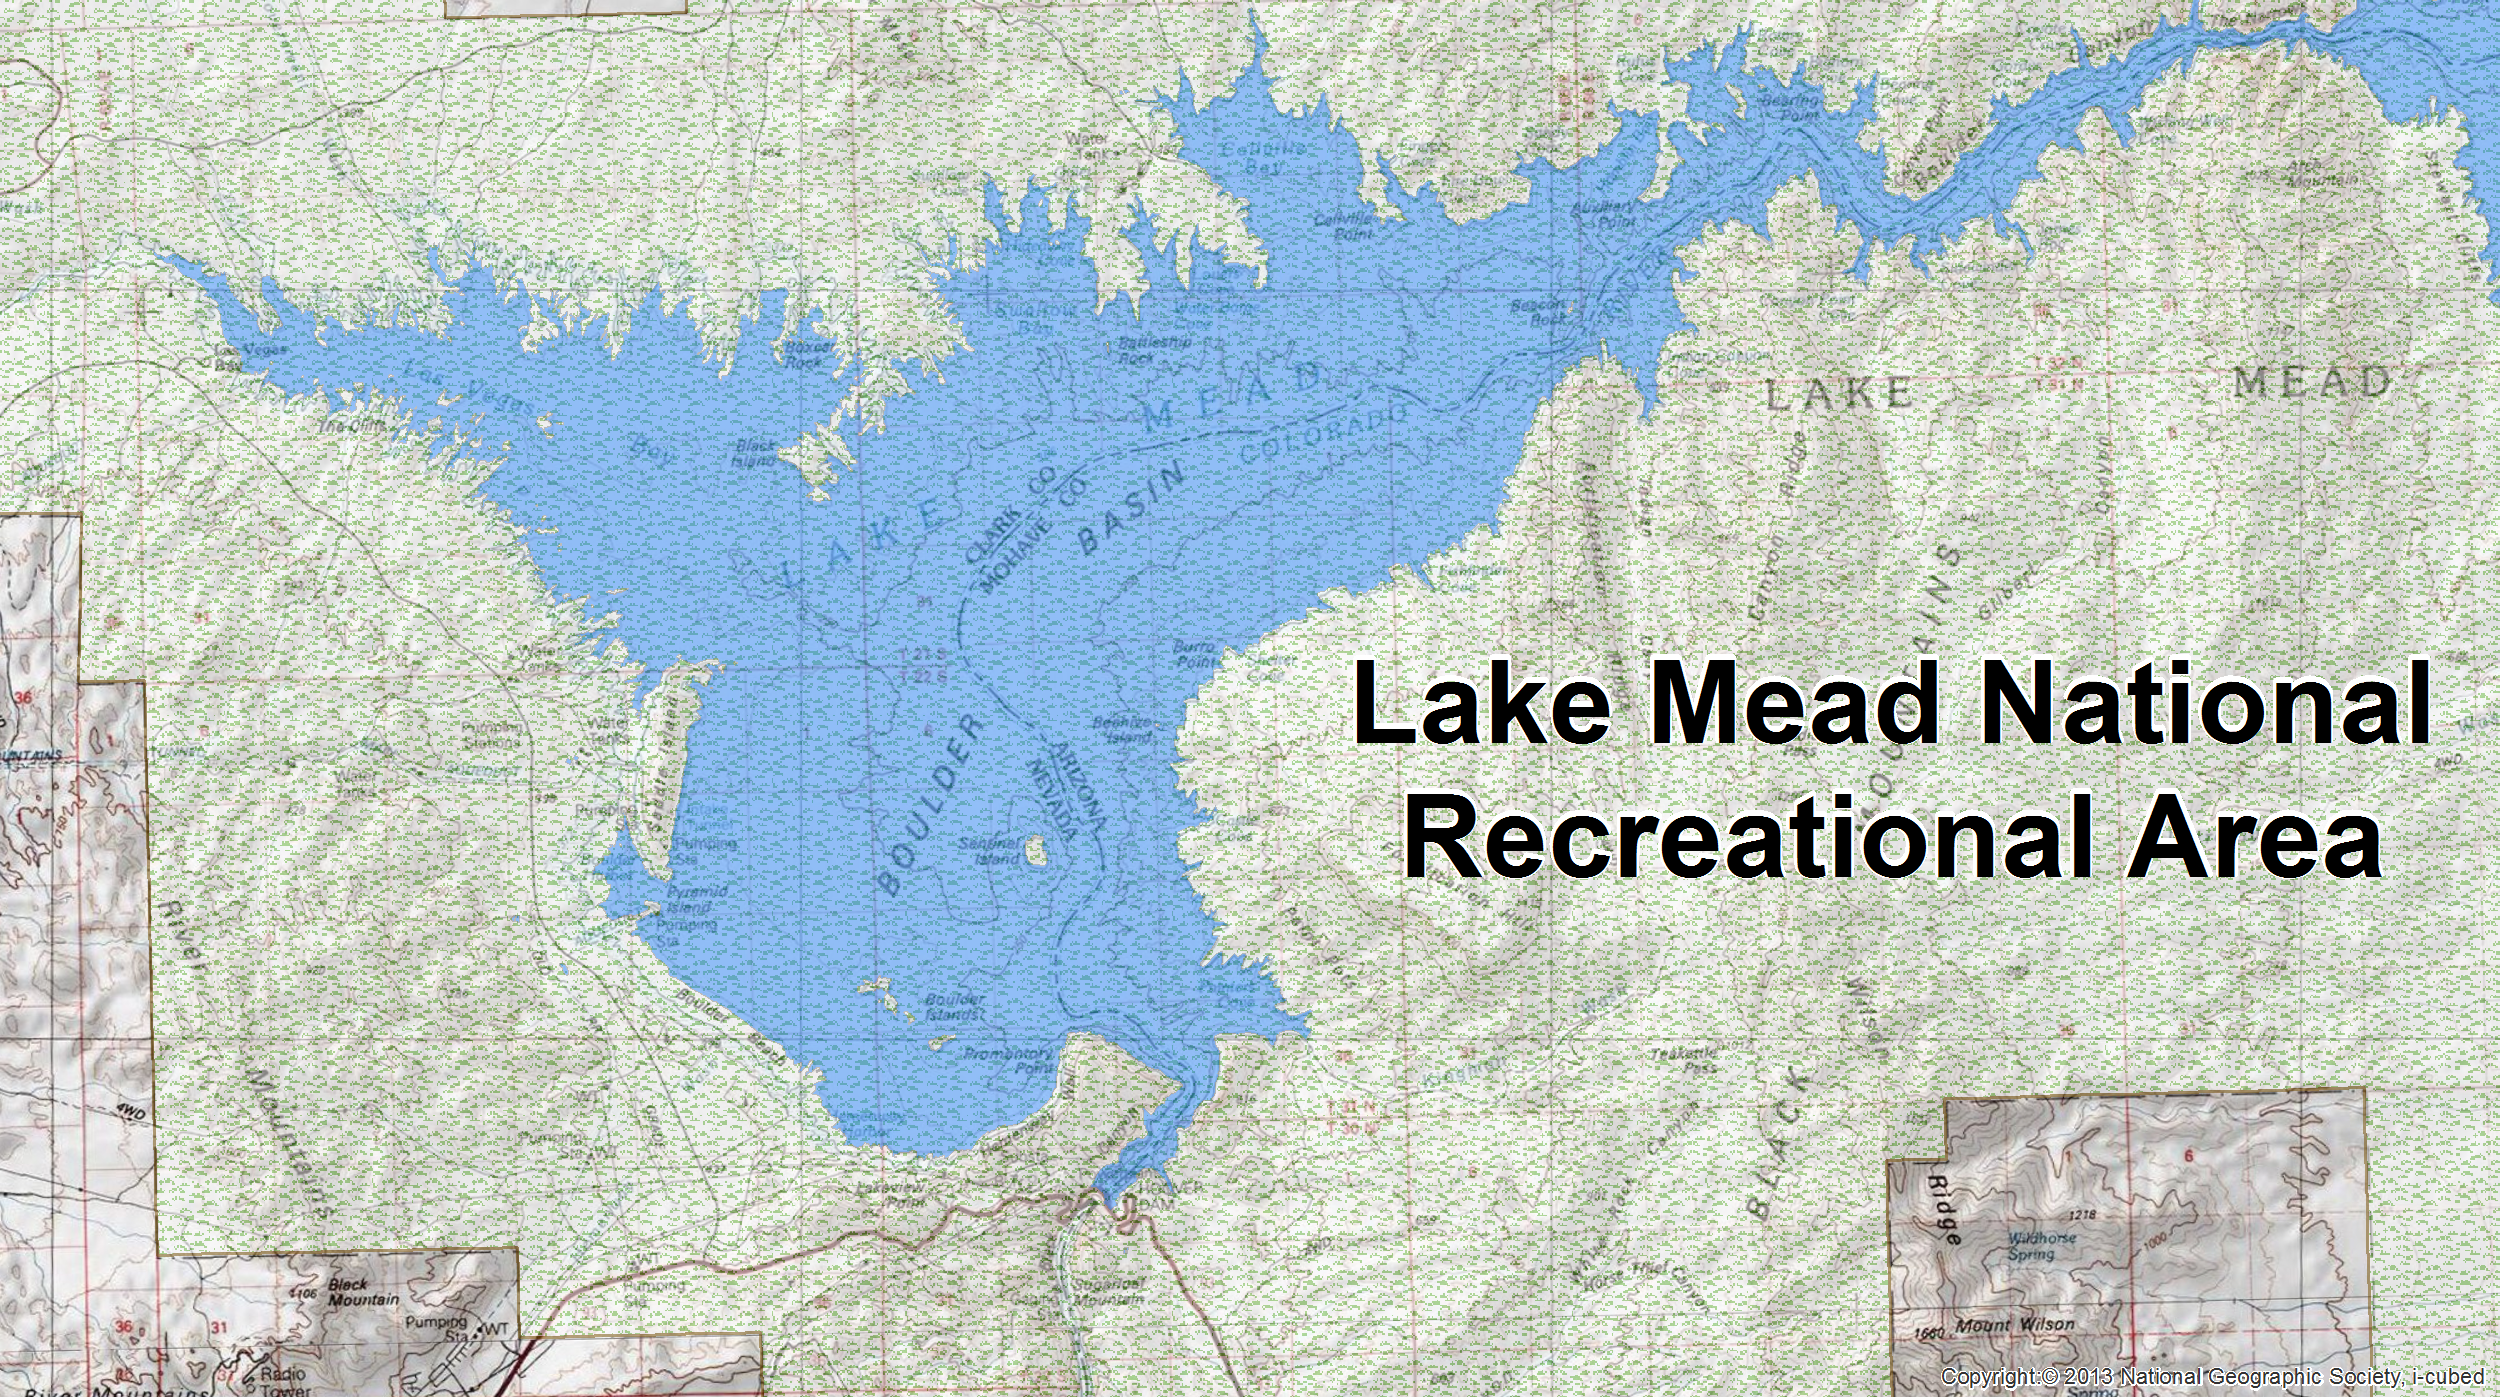
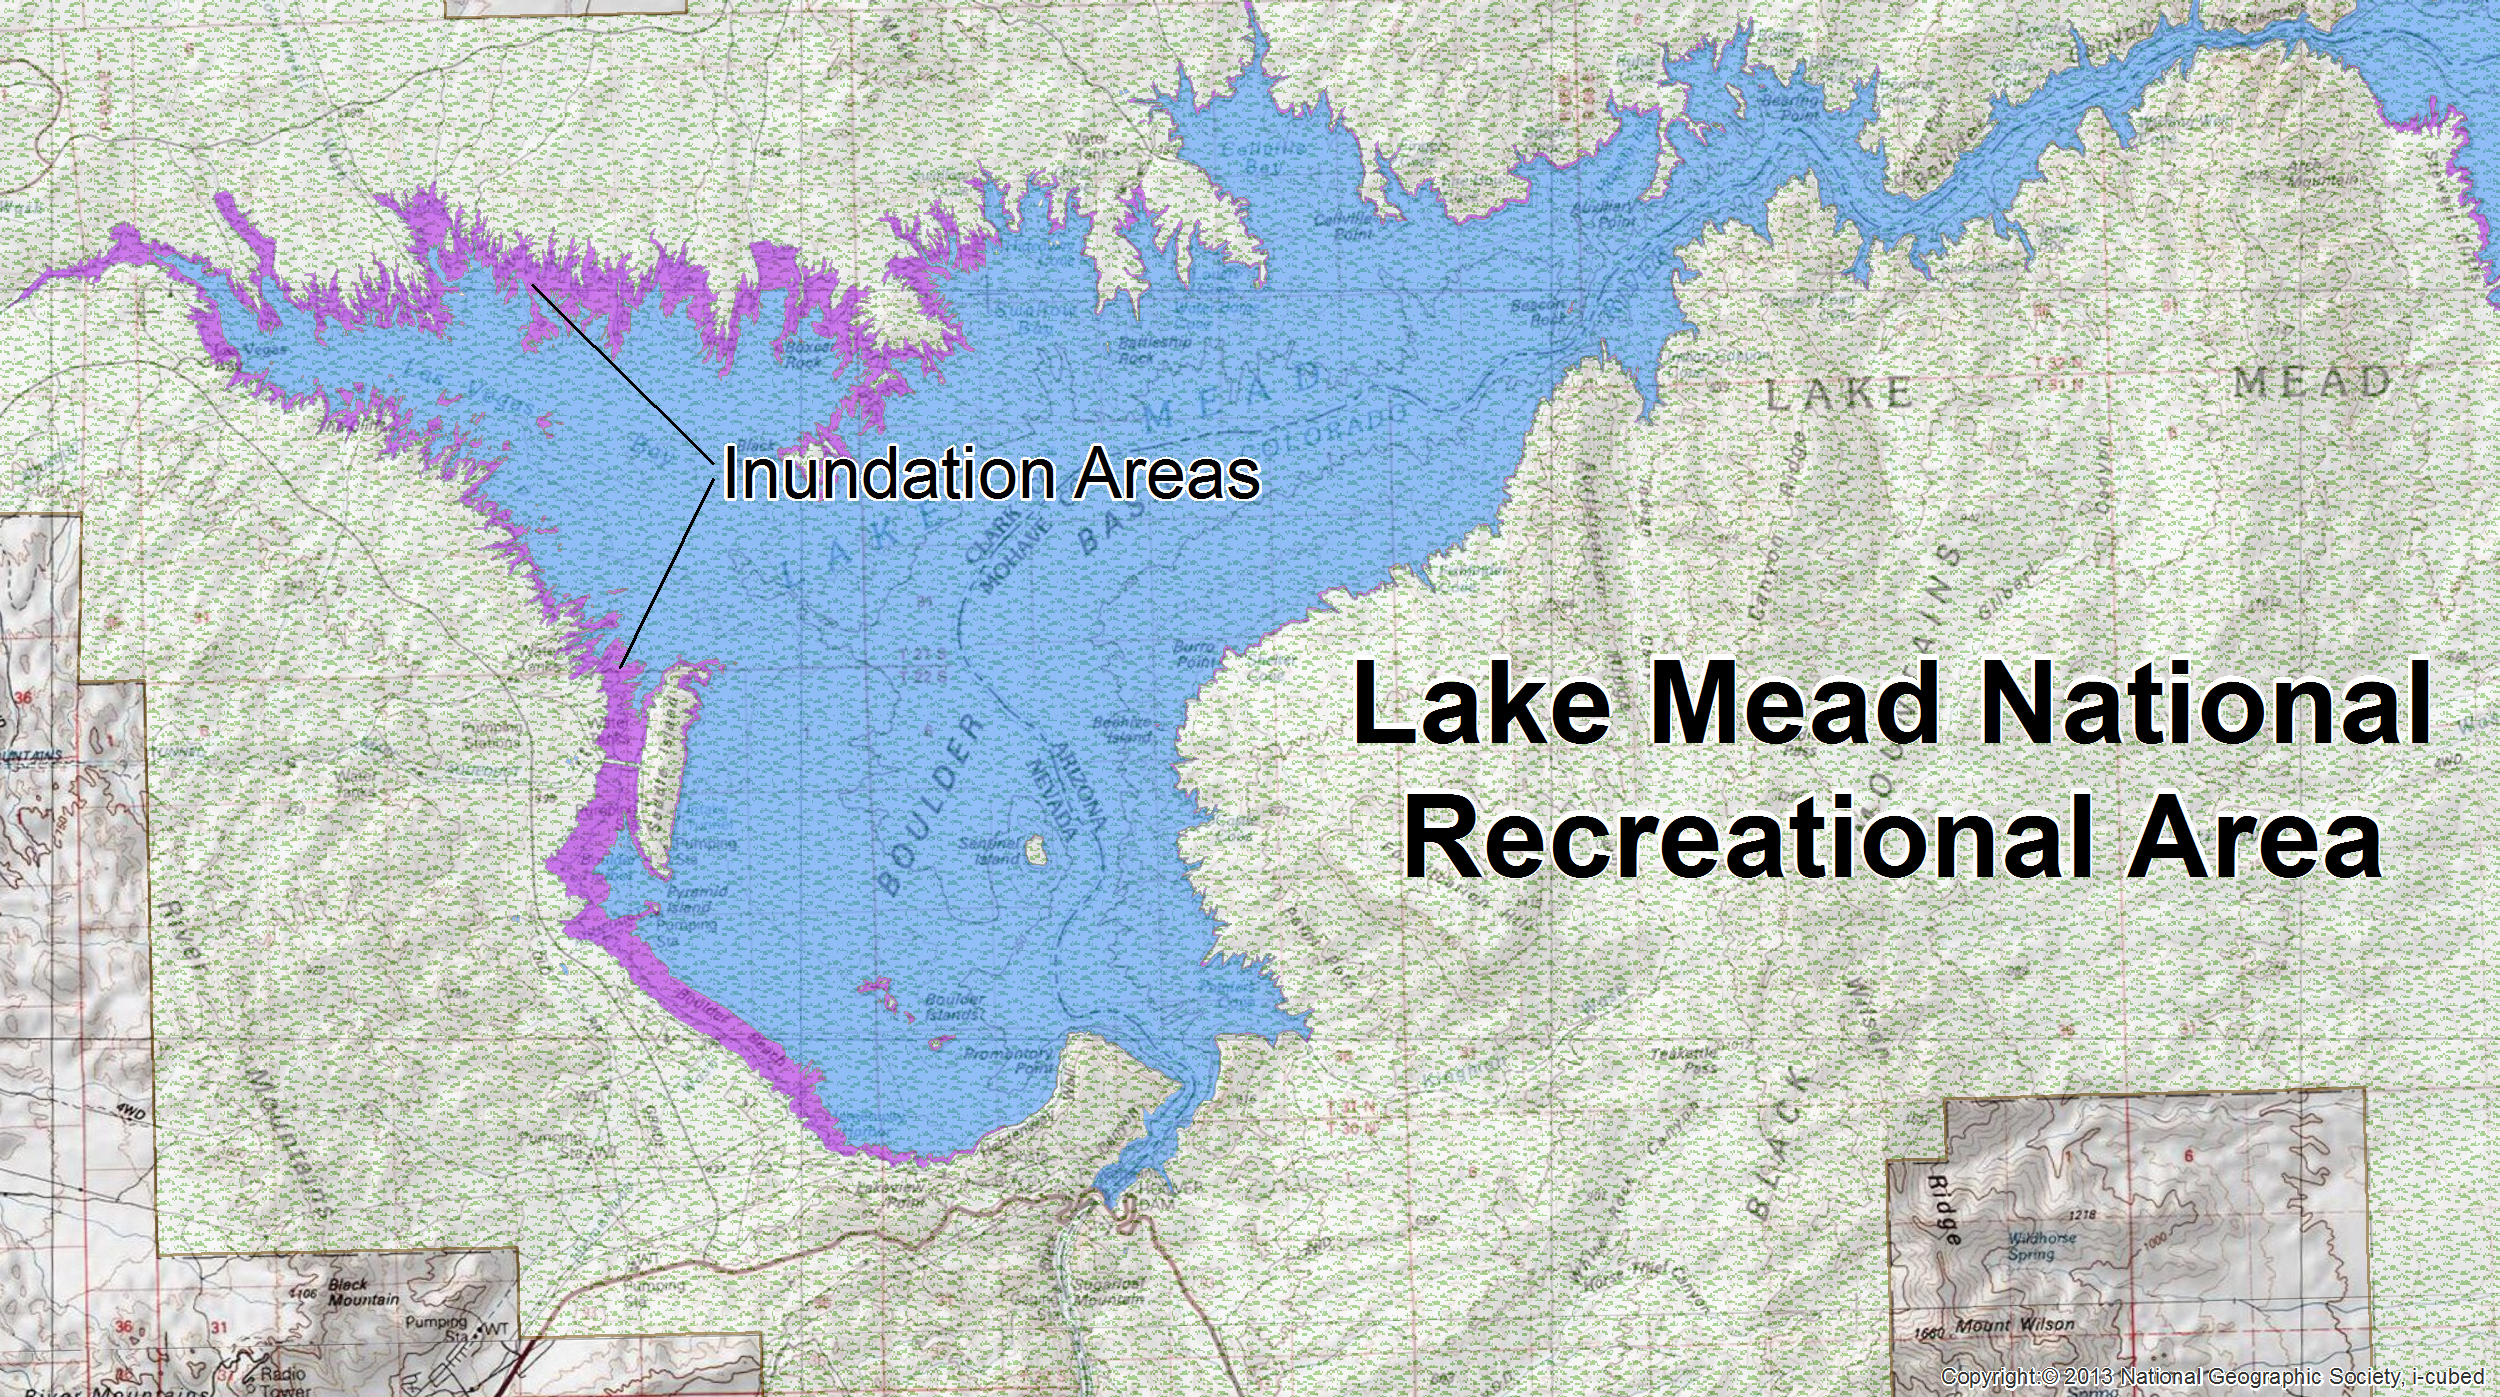
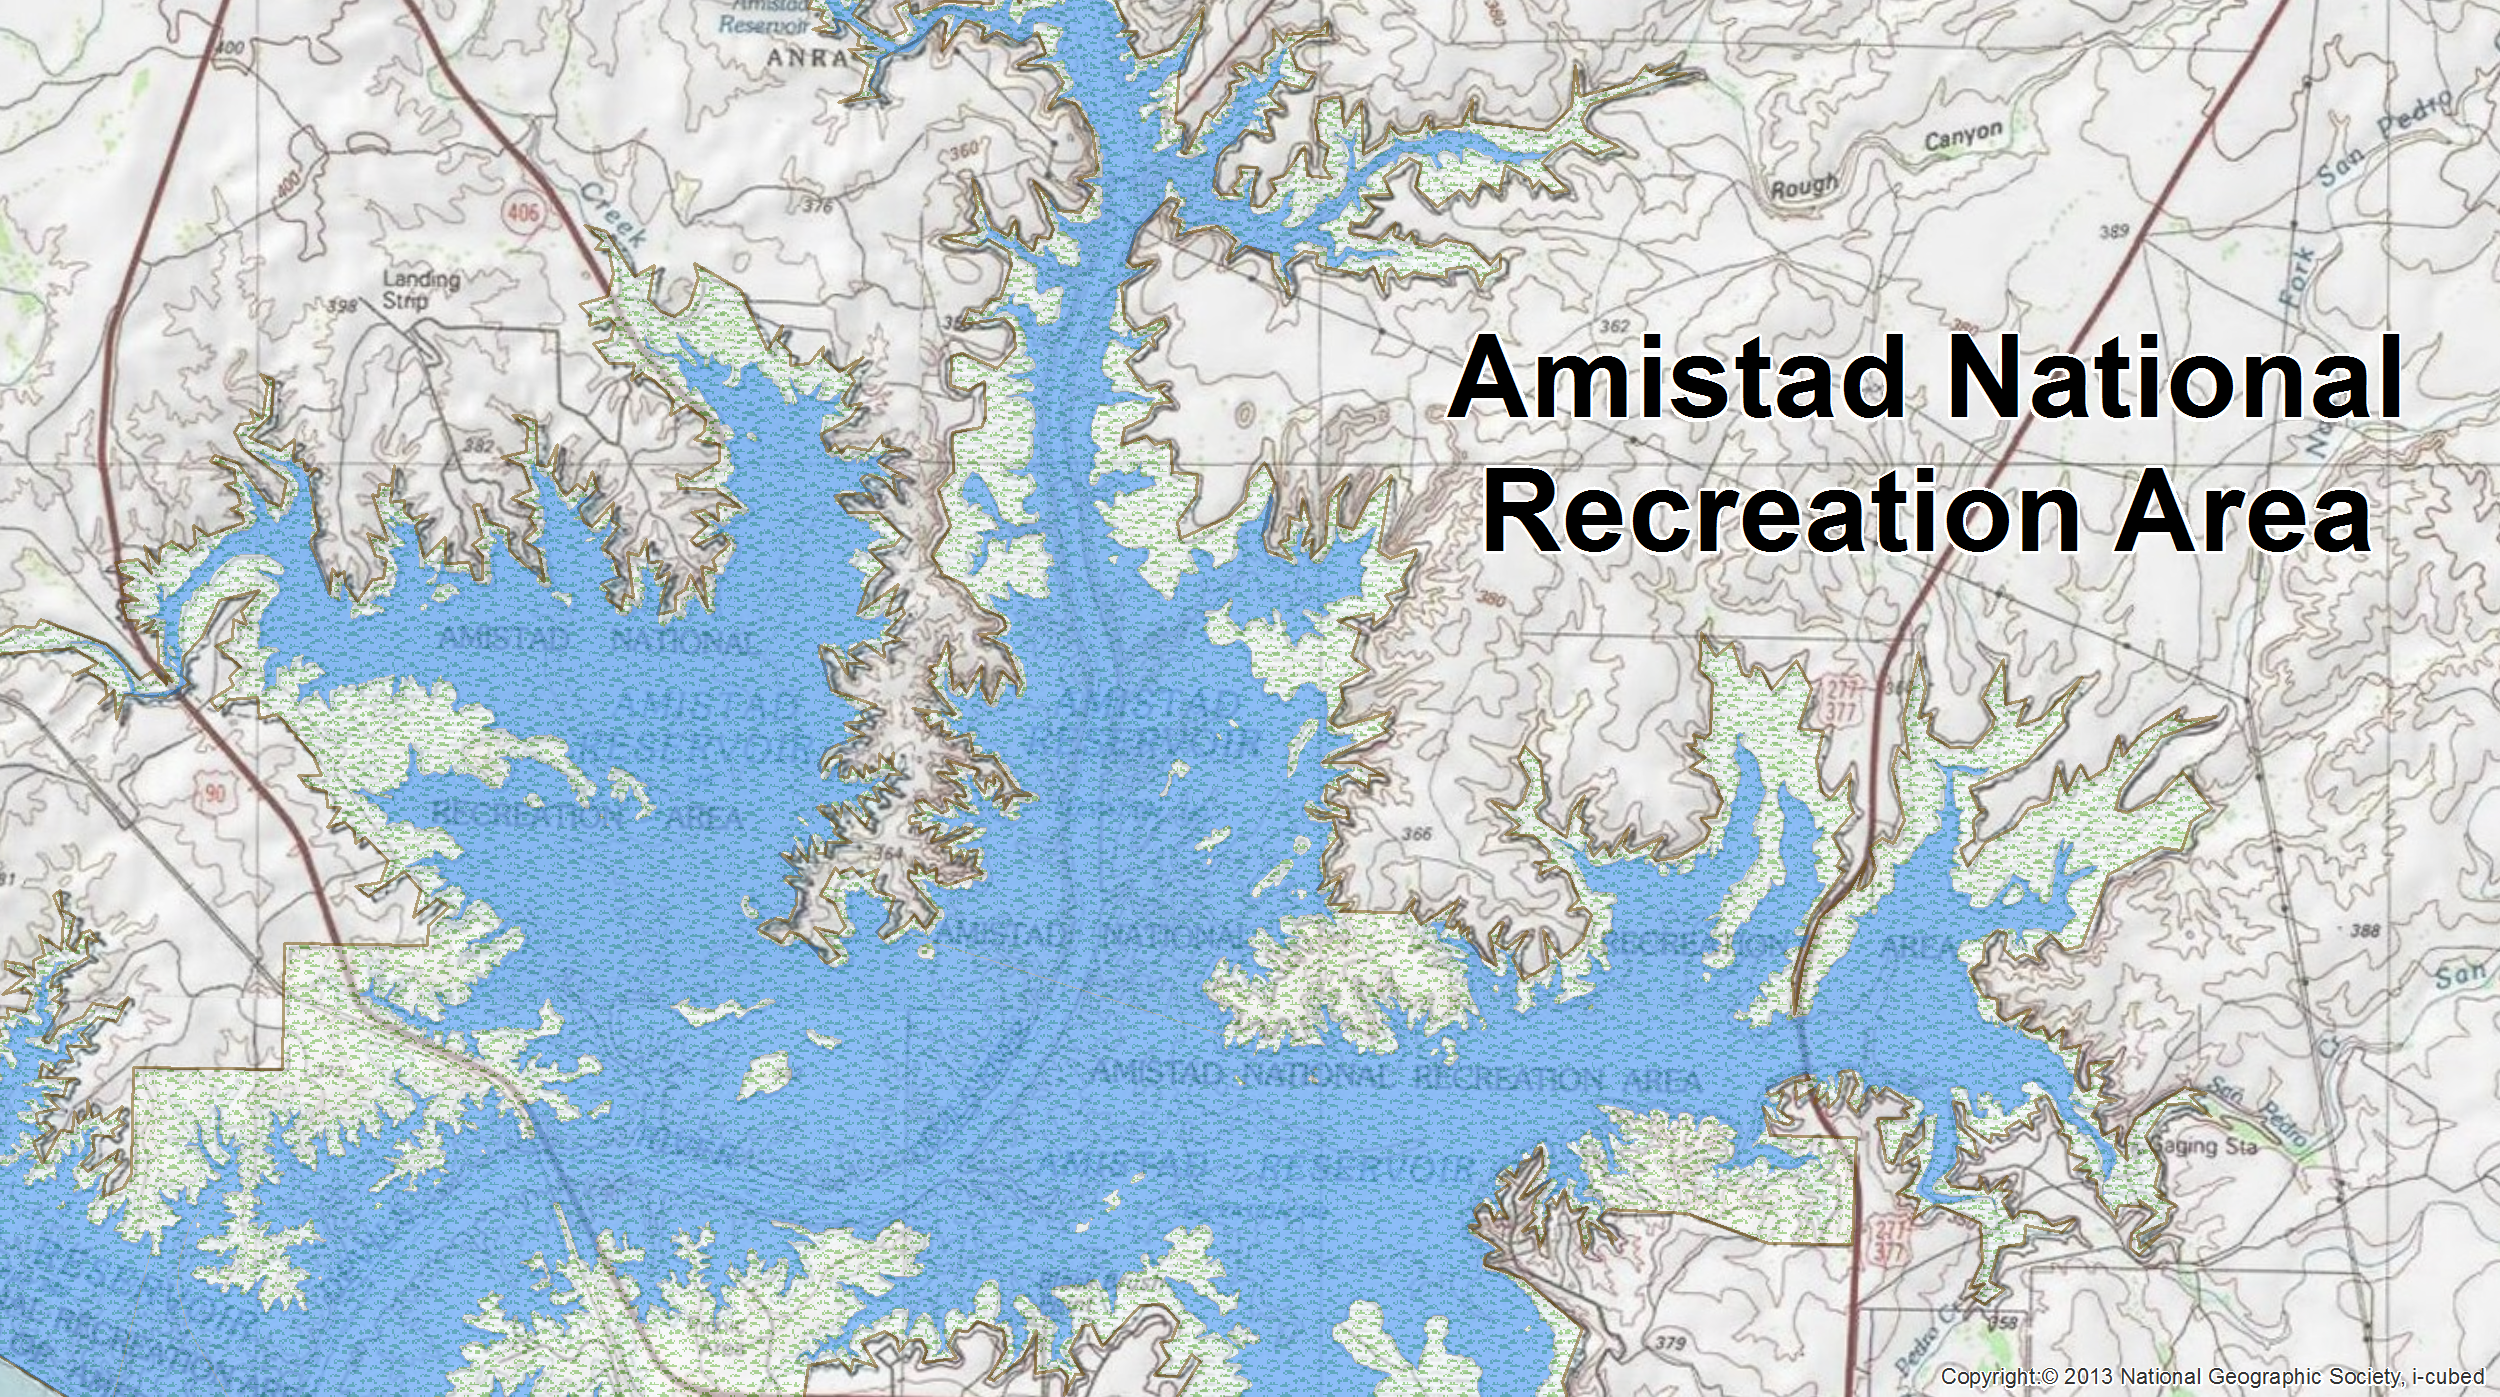
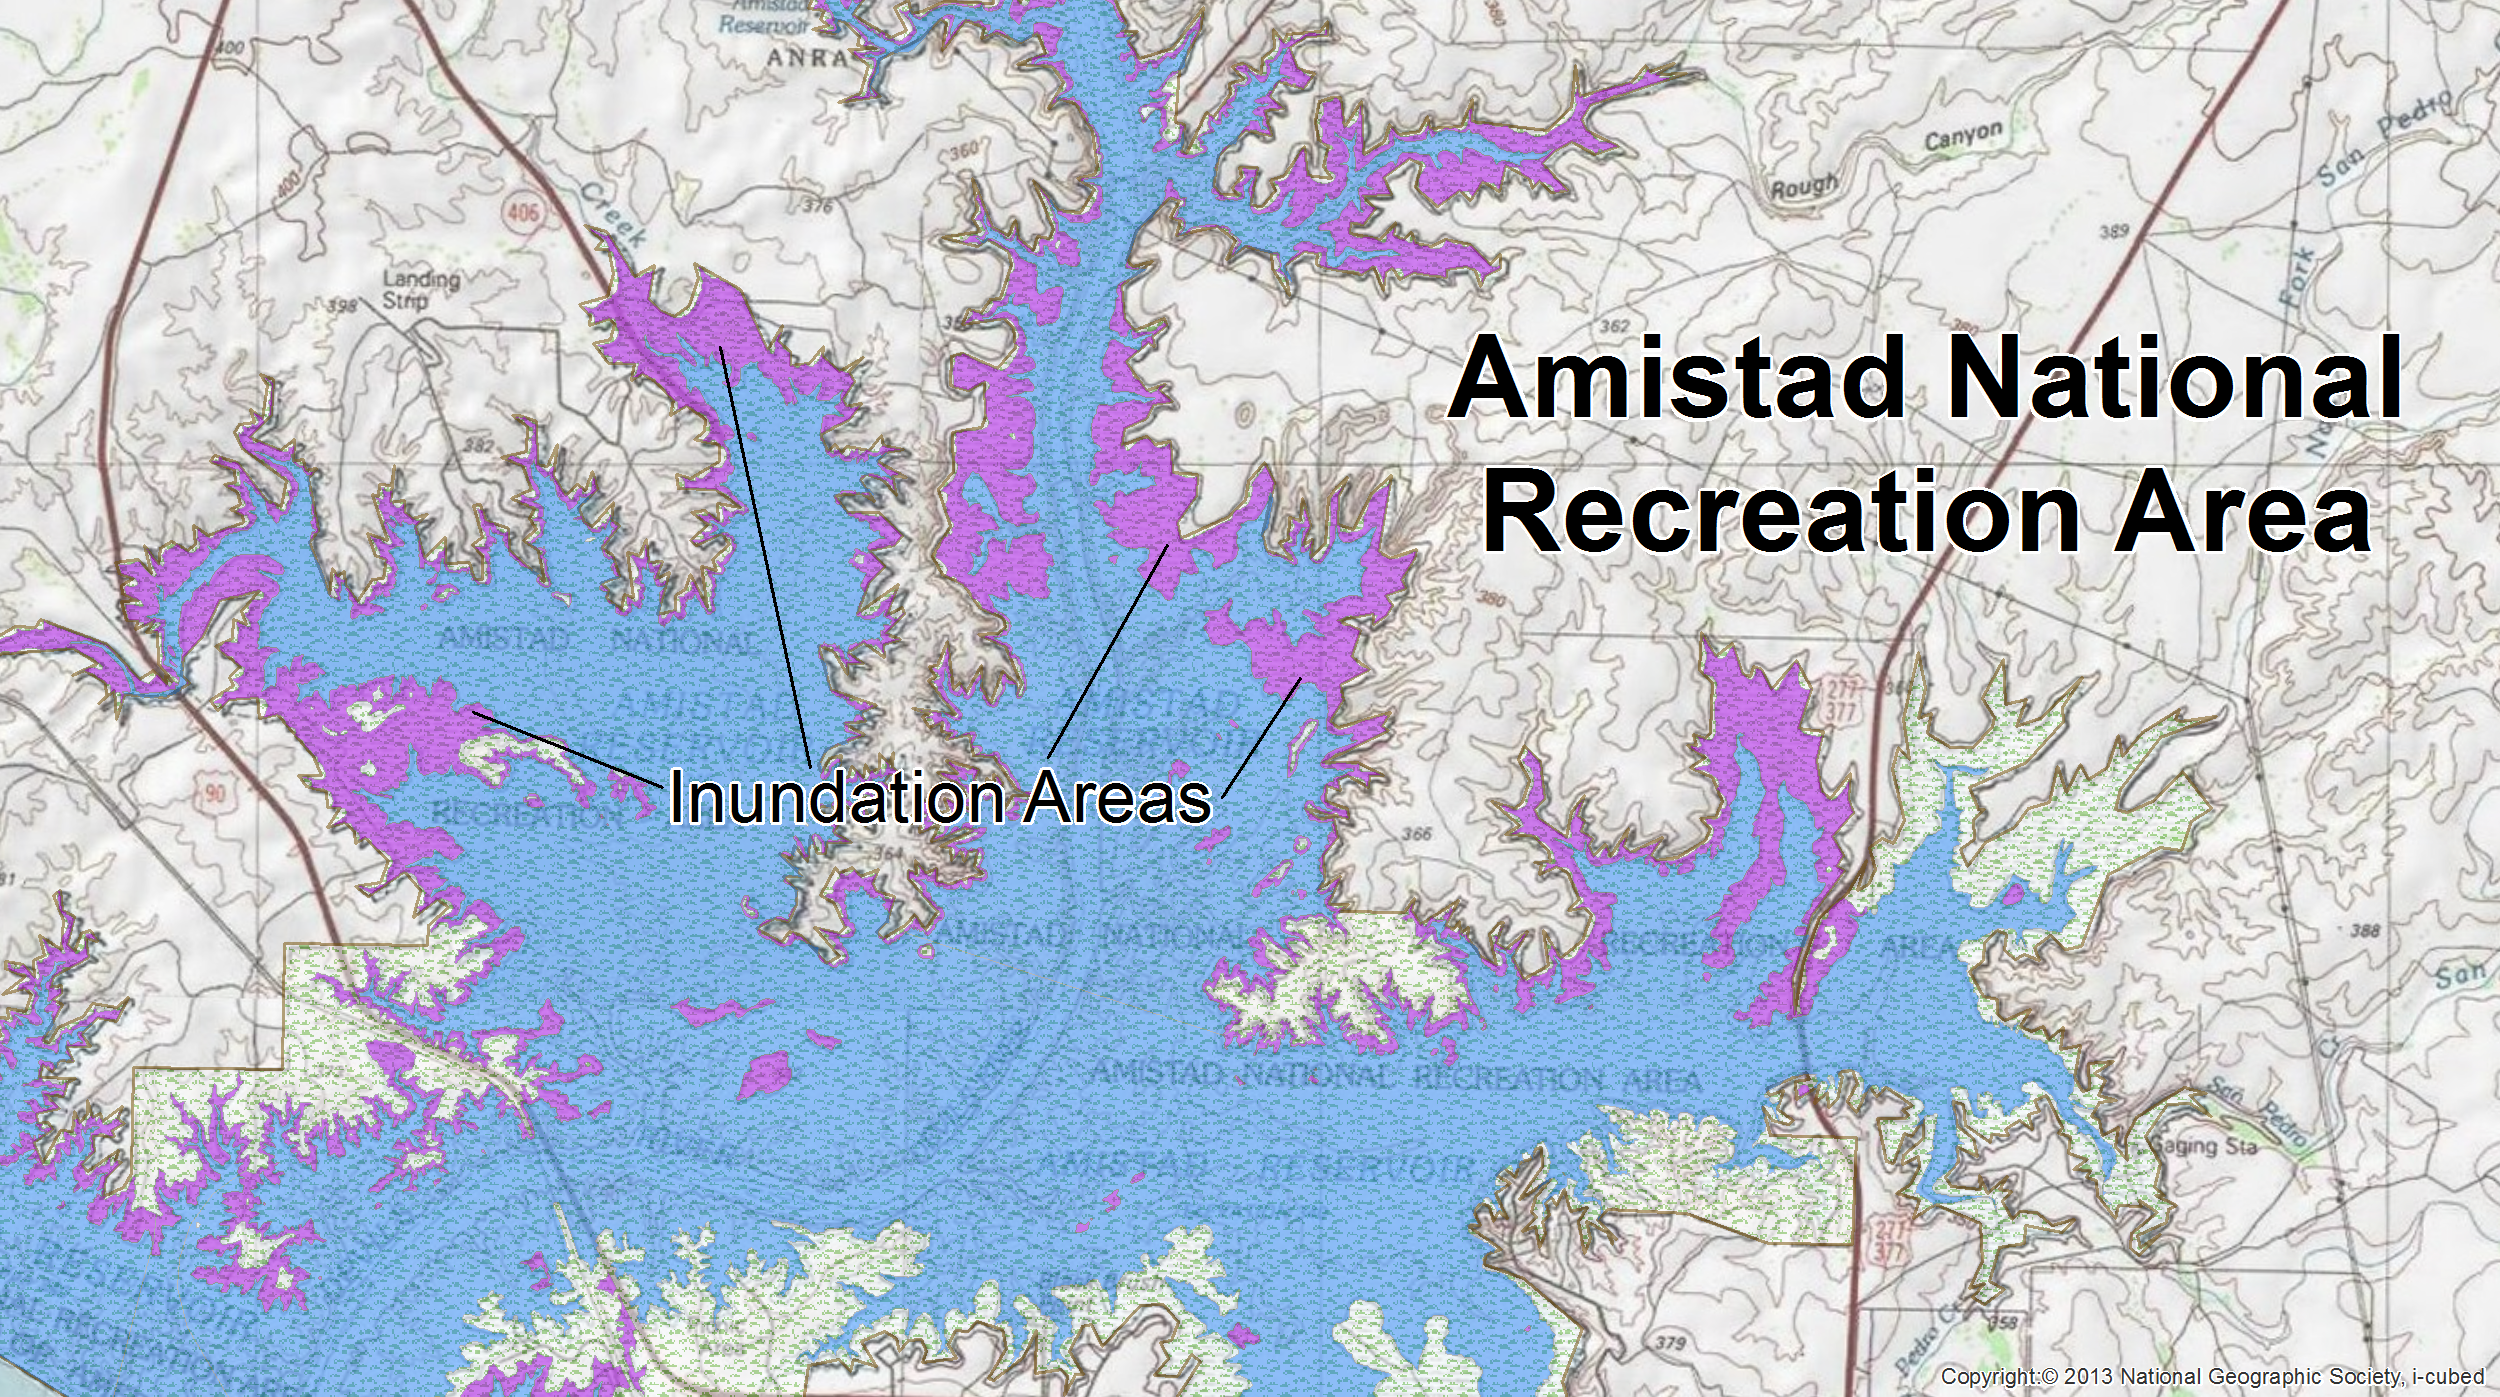
Inundation areas (FCODE 403xx) are delineated in NHDArea, typically surrounding large waterbodies with fluctuating water levels. Although inundation polygons are part of a waterbody, they were excluded from the waterbody acreage estimation. Below are two examples (Lake Mead National Recreation Area and Amistad National Recreation Area) of how these inconsistencies may affect park hydrographic statistics.

Lake Mead National Recreational Area
This is an image of part of Lake Mead National Recreational Area. The blue polygon is the NHDWaterbody delineation of Lake Mead.

The purple polygon is the NHDArea representation of the inundation areas surrounding Lake Mead. This likely reflects the discrepancy in high and low water levels of the lake. In this situation, due to changing water levels, inundation areas were summarized in a separate inundation category for each park.

Amistad National Recreation Area
The image to the right represents the southeastern portion of Amistad National Recreation Area and the Amistad Reservoir from NHDWaterbody is delineated in blue.

The purple polygon represents the NHDArea depiction of inundation areas surrounding the Amistad Reservoir. This is the result of the reservoir's high/low water levels. Therefore, in order to avoid the overestimation of reservoir acreage, inundation areas were summarized in a separate inundation category for each park.
NPS Wild and Scenic River Statistics
NPS Wild and Scenic Rivers included in HIS are rivers, or portions of rivers, that flow through national park units, or are themselves national park units, and rivers that are listed as Partnership Rivers administered by the NPS in partnership with local governments, councils, watershed groups, and non-governmental organizations, generally through the use of cooperative agreements. Other federally managed Wild and Scenic Rivers and State 2(a)(ii) rivers where the NPS only has Section 7 compliance responsibility are excluded. For example, the Snake Rivers Headwaters Wild and Scenic River is jointly administered by the NPS, U.S. Forest Service, and U.S. Fish and Wildlife Service, but only the portions overseen by the NPS are included and summarized in HIS. Consequently, the mileage for the Snake Rivers Headwaters Wild and Scenic River across all management entities is 413.5 miles (see https://www.rivers.gov); but HIS only includes the approximately 96 miles administered by Grand Teton and Yellowstone National Parks. This management exclusion also explains why the mapped spatial extent of an NPS Wild and Scenic River may differ from what appears at https://www.rivers.gov. Further, the mapped spatial extents of some rivers depicted in https://www.rivers.gov were found to be slightly off due to digitization and/or source dataset issues which were corrected in HIS.The mileage shown for NPS Wild and Scenic Rivers that flow through a national park unit is also included in the host national park unit's stream/river mileage (for the portions within the national park unit boundary). This encompasses 31 of the 47 NPS Wild and Scenic Rivers. Consequently, adding the stream/river mileage from the National Park System to the stream/river mileage from NPS Wild and Scenic Rivers would double count this shared stream/river mileage. The 16 rivers that are entirely outside National Park System boundaries are the Partnership Rivers.
Last updated: October 27, 2021
